ACIS
ACIS DOSE Registered-Photon-Map
The steps we took to compute the dose map are;
- Level 1 Event files for a specified month are obtained from archive.
- Image data including I2, I3, S2, S3 CCDs are extracted from all event files.
- All the extracted image data were merged to create a month long exposure map for the month.
- The exposure map is opened with ds9, and check a distribution of count rates against energy. From this, estimate the upper threshold value. Any events beyond this upper threshold are assumed erroneous events such as bad pixels.
- Using this upper threshold, the data is filtered, and create a cleaned exposure map for the month.
- The exposure map from each month from the Sep 1999 is added up to create a cumulative exposure map for each month.
- Using fimgstatistic, we compute count rate statistics for each CCDs.
- For observations with high data drop rates (e.g., Crab nebula, Cas A), we corrected the observations by adding events.
Please check more detail plots at Telemetered Photon Dose Trend page.
)
)
)
Statistics:
# IMAGE     NPIX     MEAN        RMS        MIN     MAX
ACIS_jul22 6004901       5.956         8.860           0.0     2036


I2 node 0  262654	5.148346	2.649693	0.0	 56.0
I2 node 1  262654	5.447605	4.455809	0.0	1737.0
I2 node 2  262654	5.302146	2.714024	0.0	 81.0
I2 node 3  262654	5.297992	3.013855	0.0	415.0

I3 node 0  262654	5.631935	2.816128	0.0	 91.0
I3 node 1  262654	6.061223	3.944495	0.0	115.0
I3 node 2  262654	5.707134	3.155765	0.0	 61.0
I3 node 3  262654	5.342607	5.060718	0.0	2036.0

S2 node 0  262654	8.346461	6.900102	0.0	896.0
S2 node 1  262654	8.859878	7.610444	0.0	802.0
S2 node 2  262654	9.653788	7.891652	0.0	653.0
S2 node 3  262654	9.573162	8.036968	0.0	672.0

S3 node 0  262654	11.310815	14.222877	0.0	359.0
S3 node 1  262654	11.940422	8.163542	0.0	1568.0
S3 node 2  262654	12.041058	7.323598	0.0	193.0
S3 node 3  262654	10.856030	7.078096	0.0	217.0
)
)
)
Statistics:
 IMAGE     NPIX      MEAN        RMS           MIN      MAX
ACIS_total   6004901       2580.758         3306.881           0.0   142063


I2 node 0  262654	2236.154304	450.407450	477.0	13677.0
I2 node 1  262654	2352.883375	644.755430	493.0	136530.0
I2 node 2  262654	2381.859081	504.146044	512.0	14300.0
I2 node 3  262654	2387.615607	616.237665	484.0	28880.0

I3 node 0  262654	2565.453278	631.492640	479.0	13826.0
I3 node 1  262654	2647.050128	1737.728505	508.0	55843.0
I3 node 2  262654	2360.710752	443.560420	478.0	14076.0
I3 node 3  262654	2345.614860	474.328488	446.0	34891.0

S2 node 0  262654	3007.671251	488.266812	1632.0	22383.0
S2 node 1  262654	3188.529388	725.029339	1816.0	17235.0
S2 node 2  262654	3527.515066	727.517073	2232.0	30290.0
S2 node 3  262654	3490.267366	583.424530	1969.0	72915.0

S3 node 0  262654	5351.080565	2931.429601	2346.0	54113.0
S3 node 1  262654	6552.863831	2365.627763	0.0	47483.0
S3 node 2  262654	5283.043022	1342.648410	2427.0	27265.0
S3 node 3  262654	4138.110675	759.485208	2497.0	26479.0
)
|
)
|
)
|
)
|
| Apr 2022 | Jan 2022 | Oct 2021 | Jul 2021 |
|---|
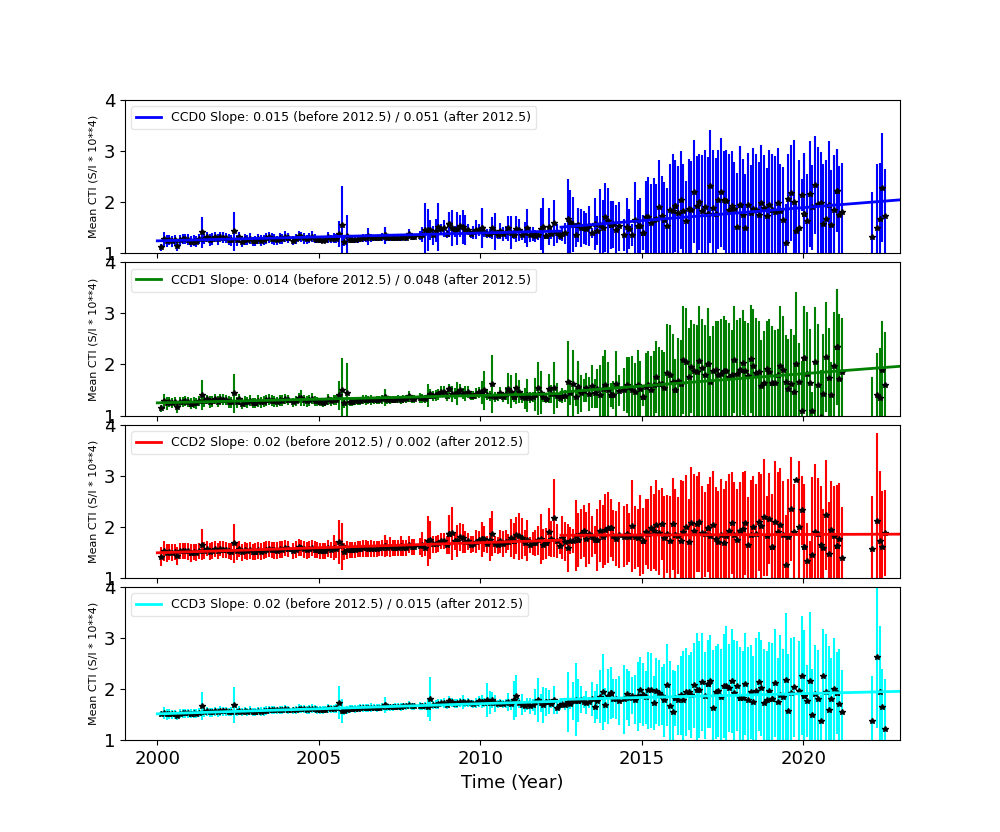
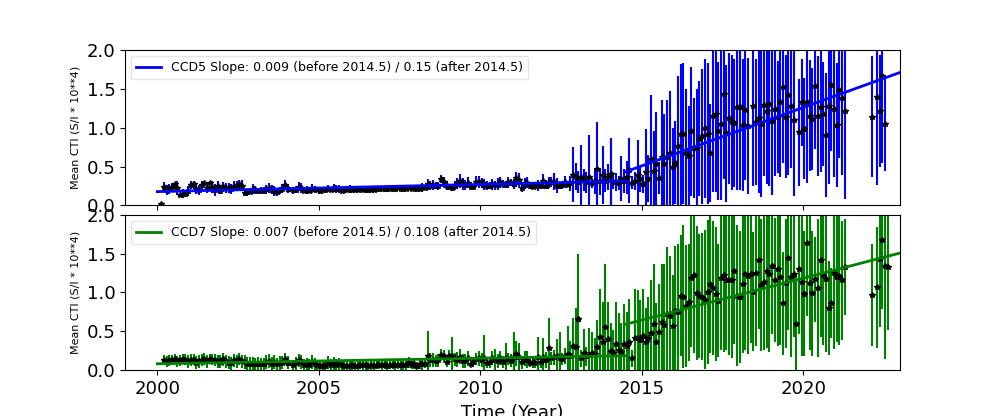
The Mean Detrended CTI
We report CTIs with a refined data definition. CTIs were computed for the temperature dependency corrected data. Please see CTI page for detailed explanation. CTI's are computed for Mn K alpha, and defined as slope/intercept x10^4 of row # vs ADU. Data file: here
Imaging CCDs
Spectral CCDs
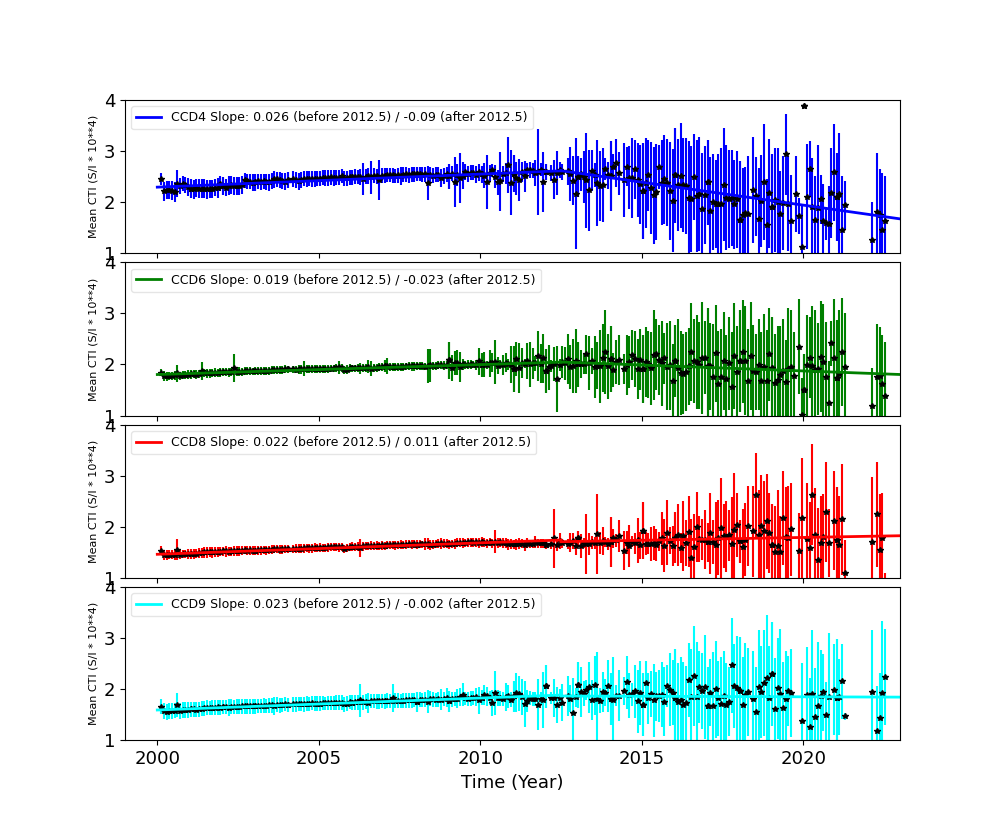
Backside CCDs
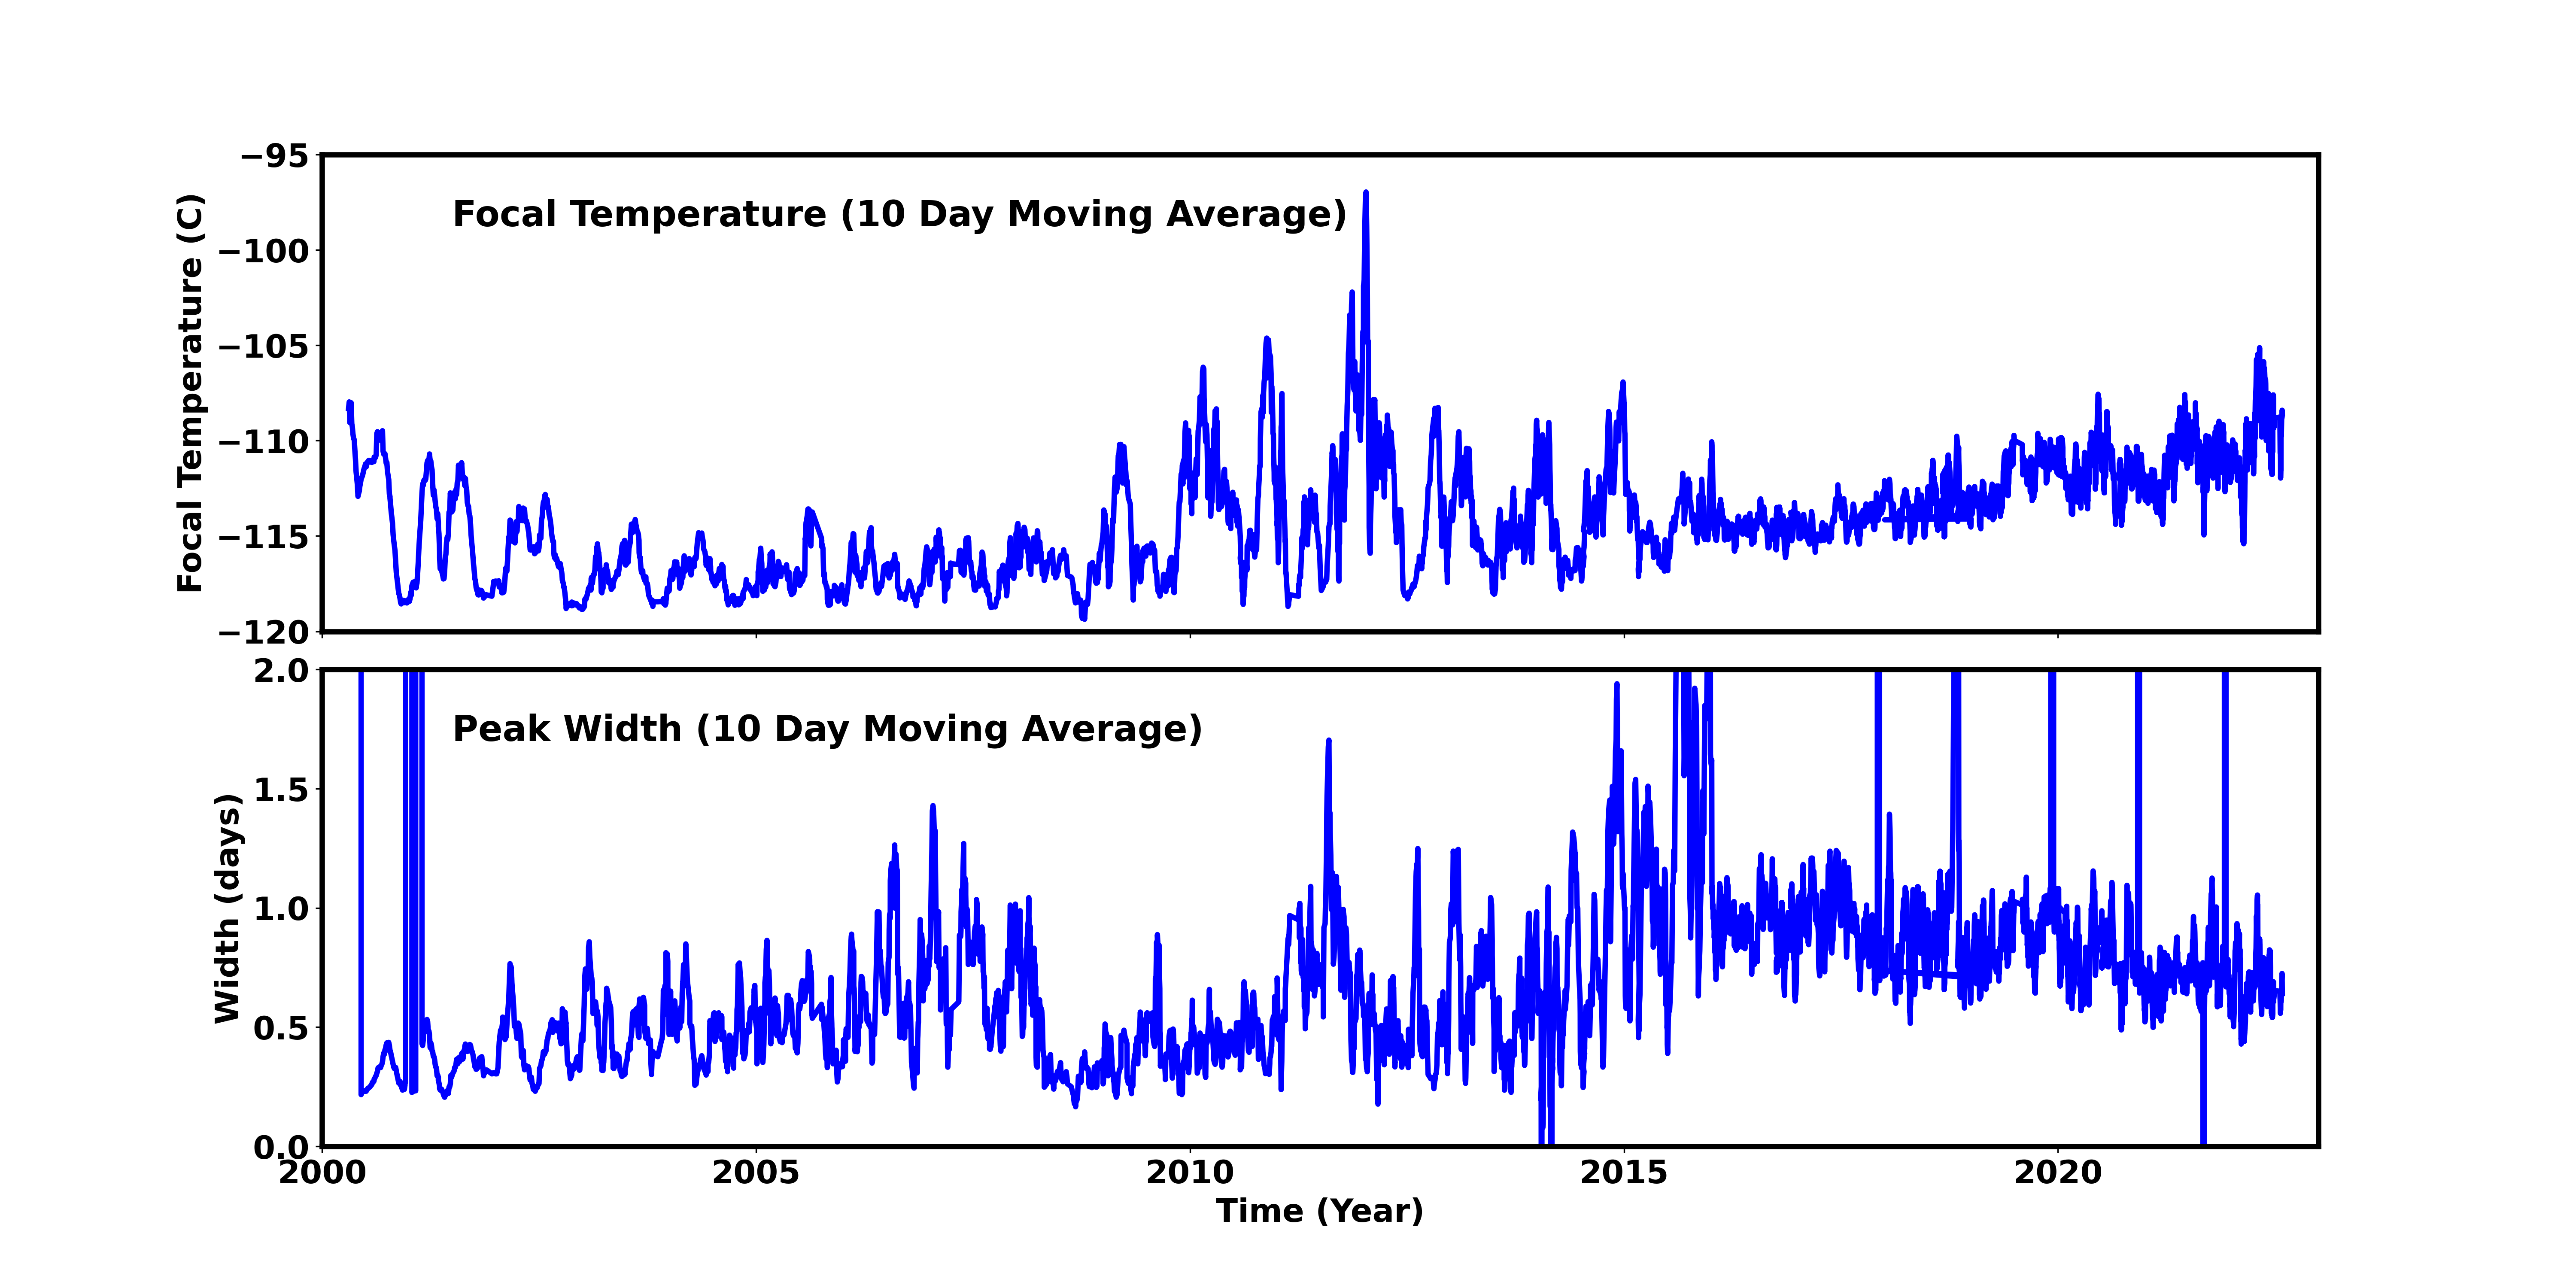
Focal Plane Temperature
Jul 2022 Focal Temperature
| The Mean (max) FPT: | |
|---|---|
| -109.71 | +/- 4.63 C |
| Mean Width: | |
| 0.66 | +/- 0.21 days |
Averaged Focal Plane Temperature
We are using 10 period moving averages to show trends of peak temperatures and peak widths. Note, the gaps in the width plot are due to missing/corrupted data.
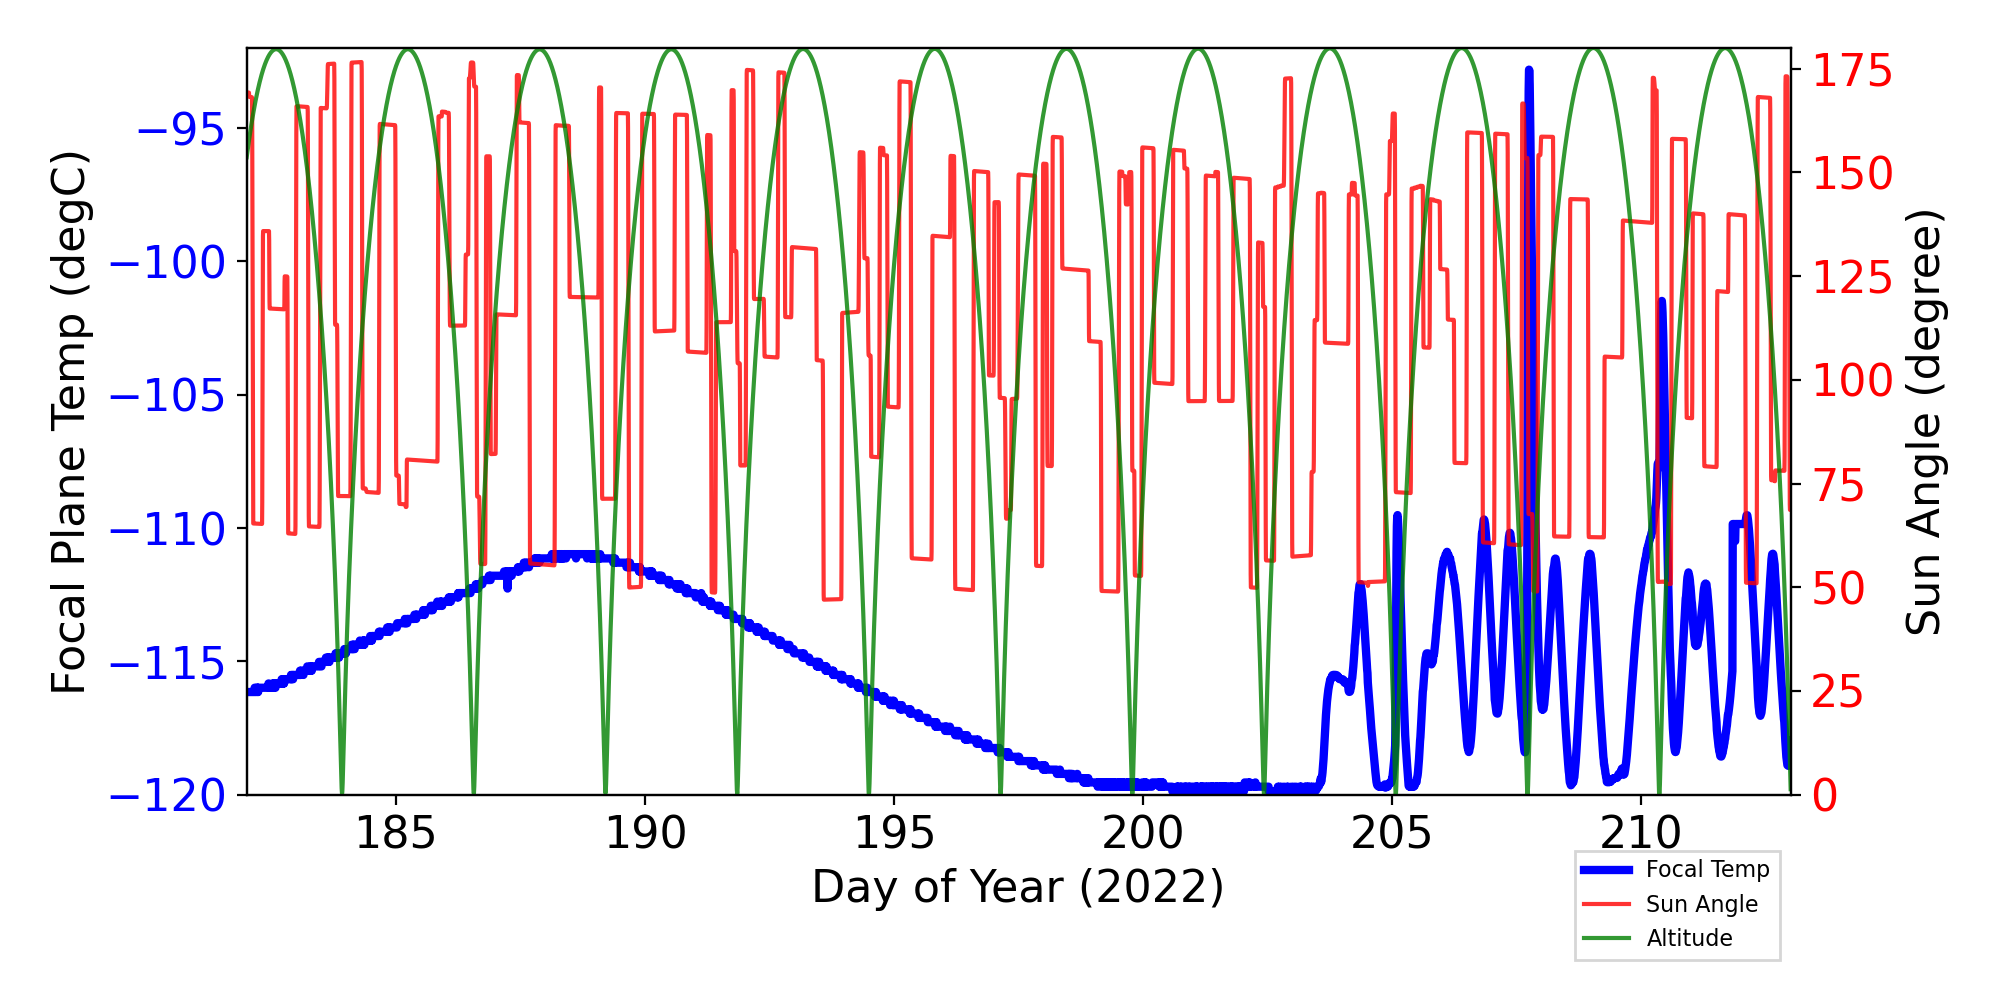
Focal Plane Temperature, Sun Angle and Altitude
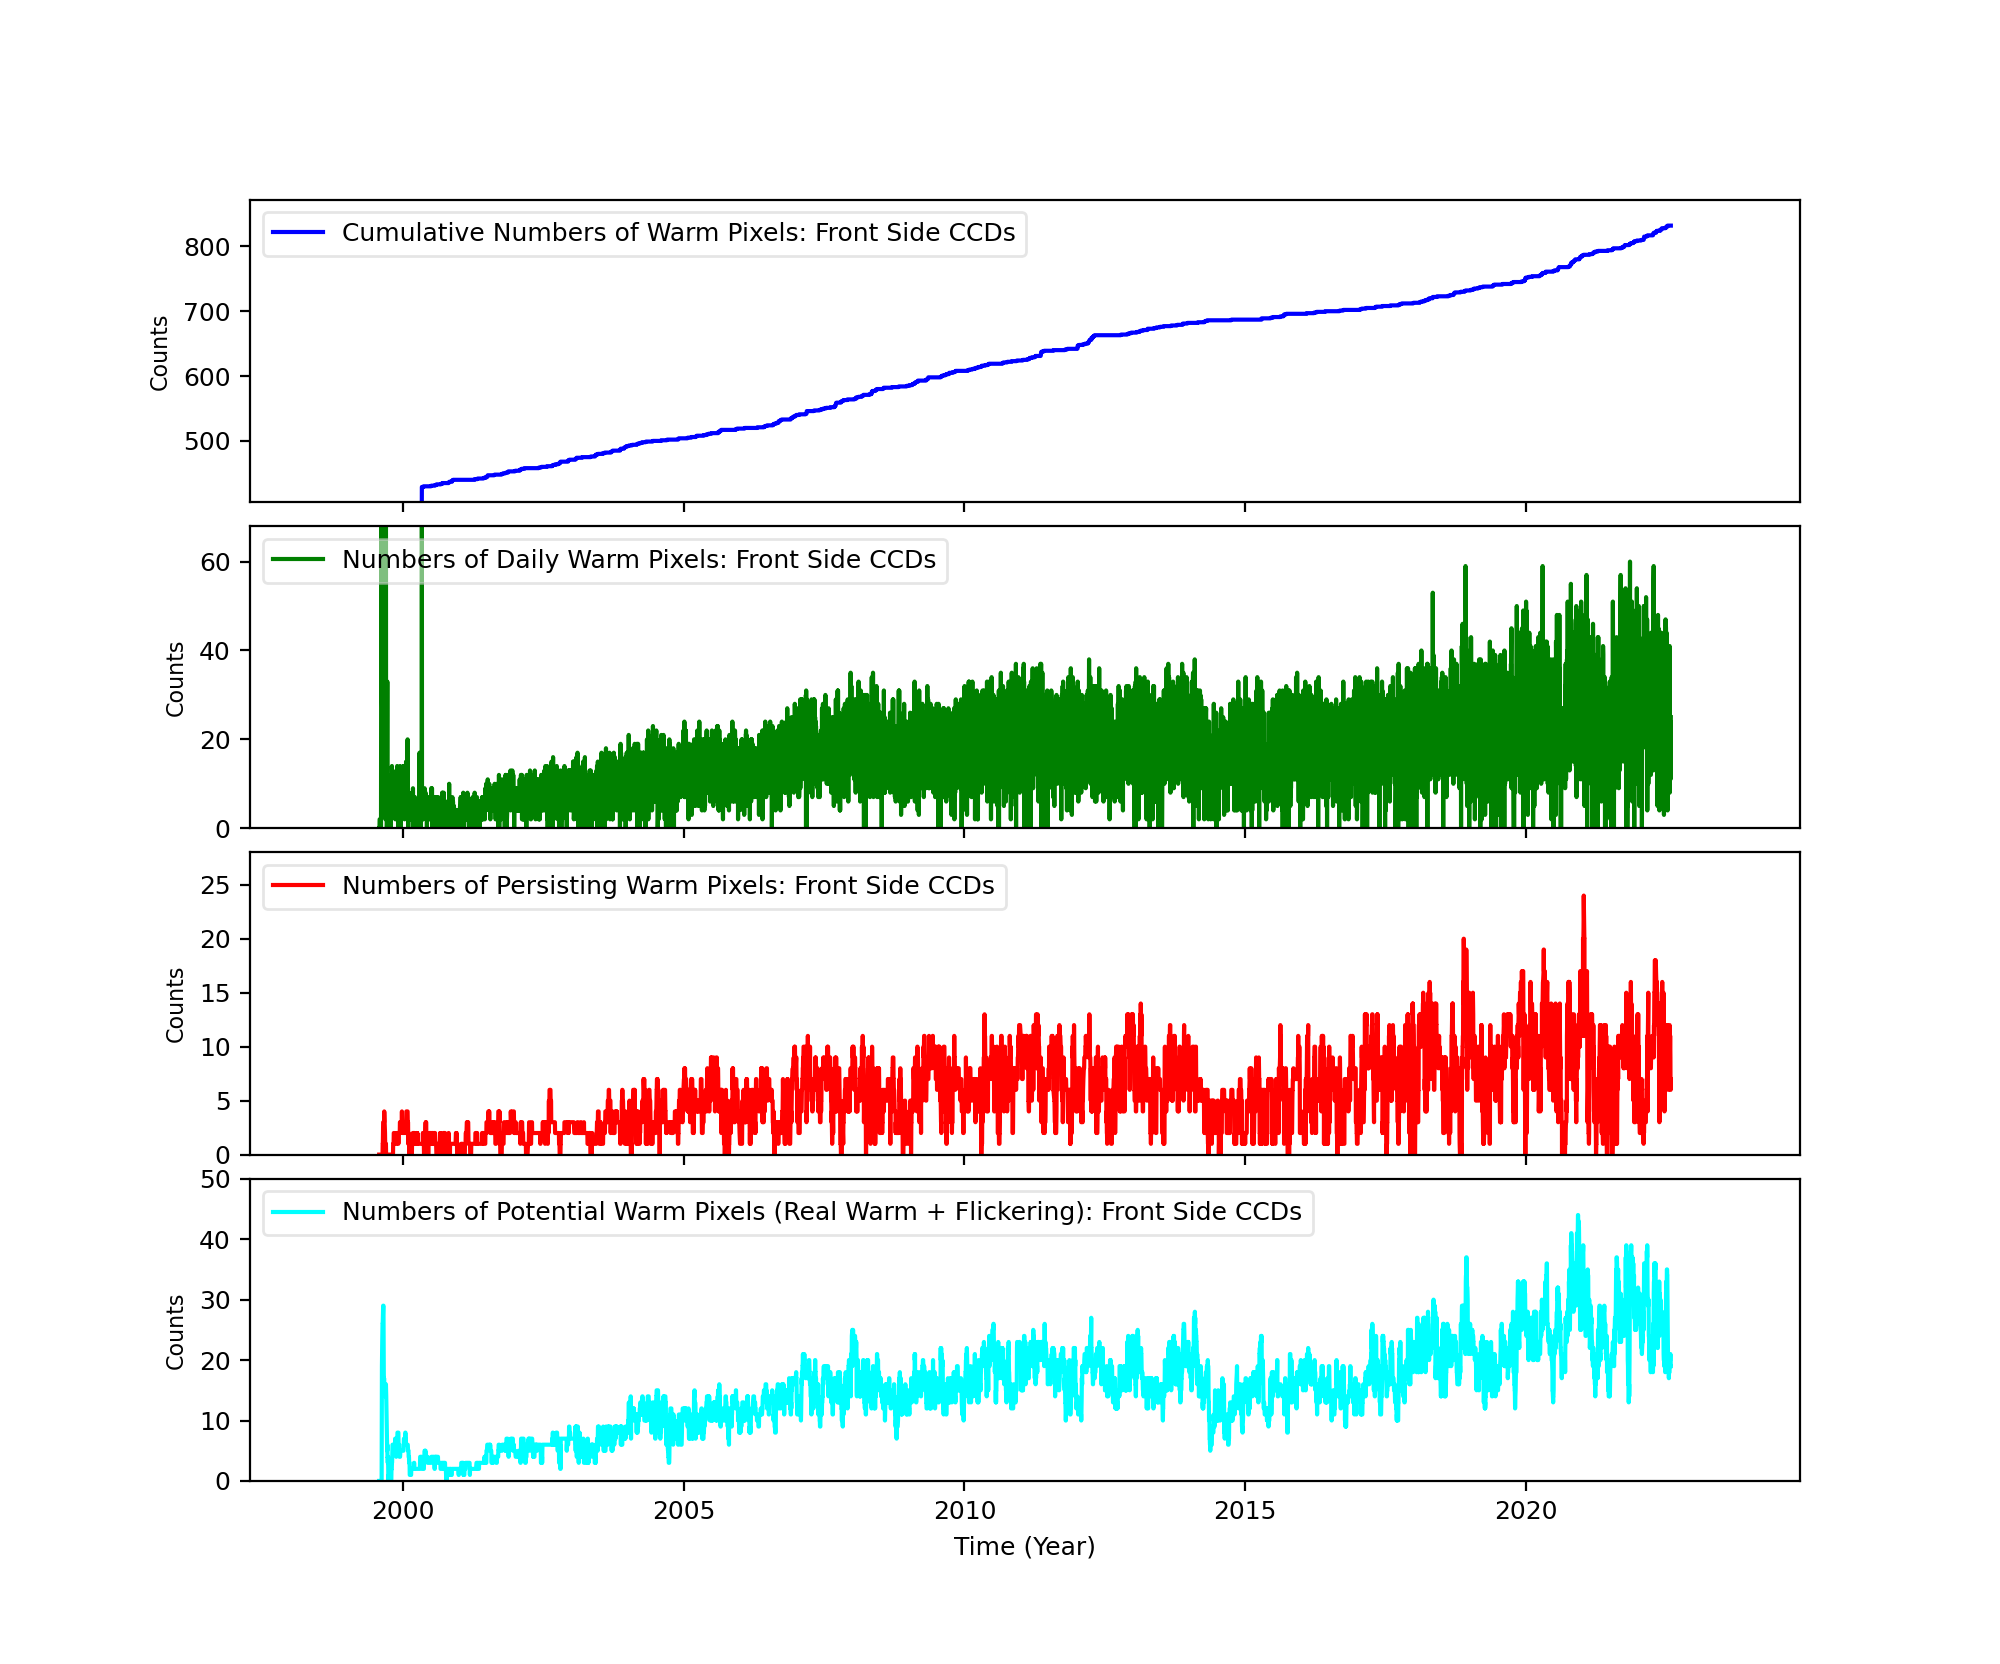
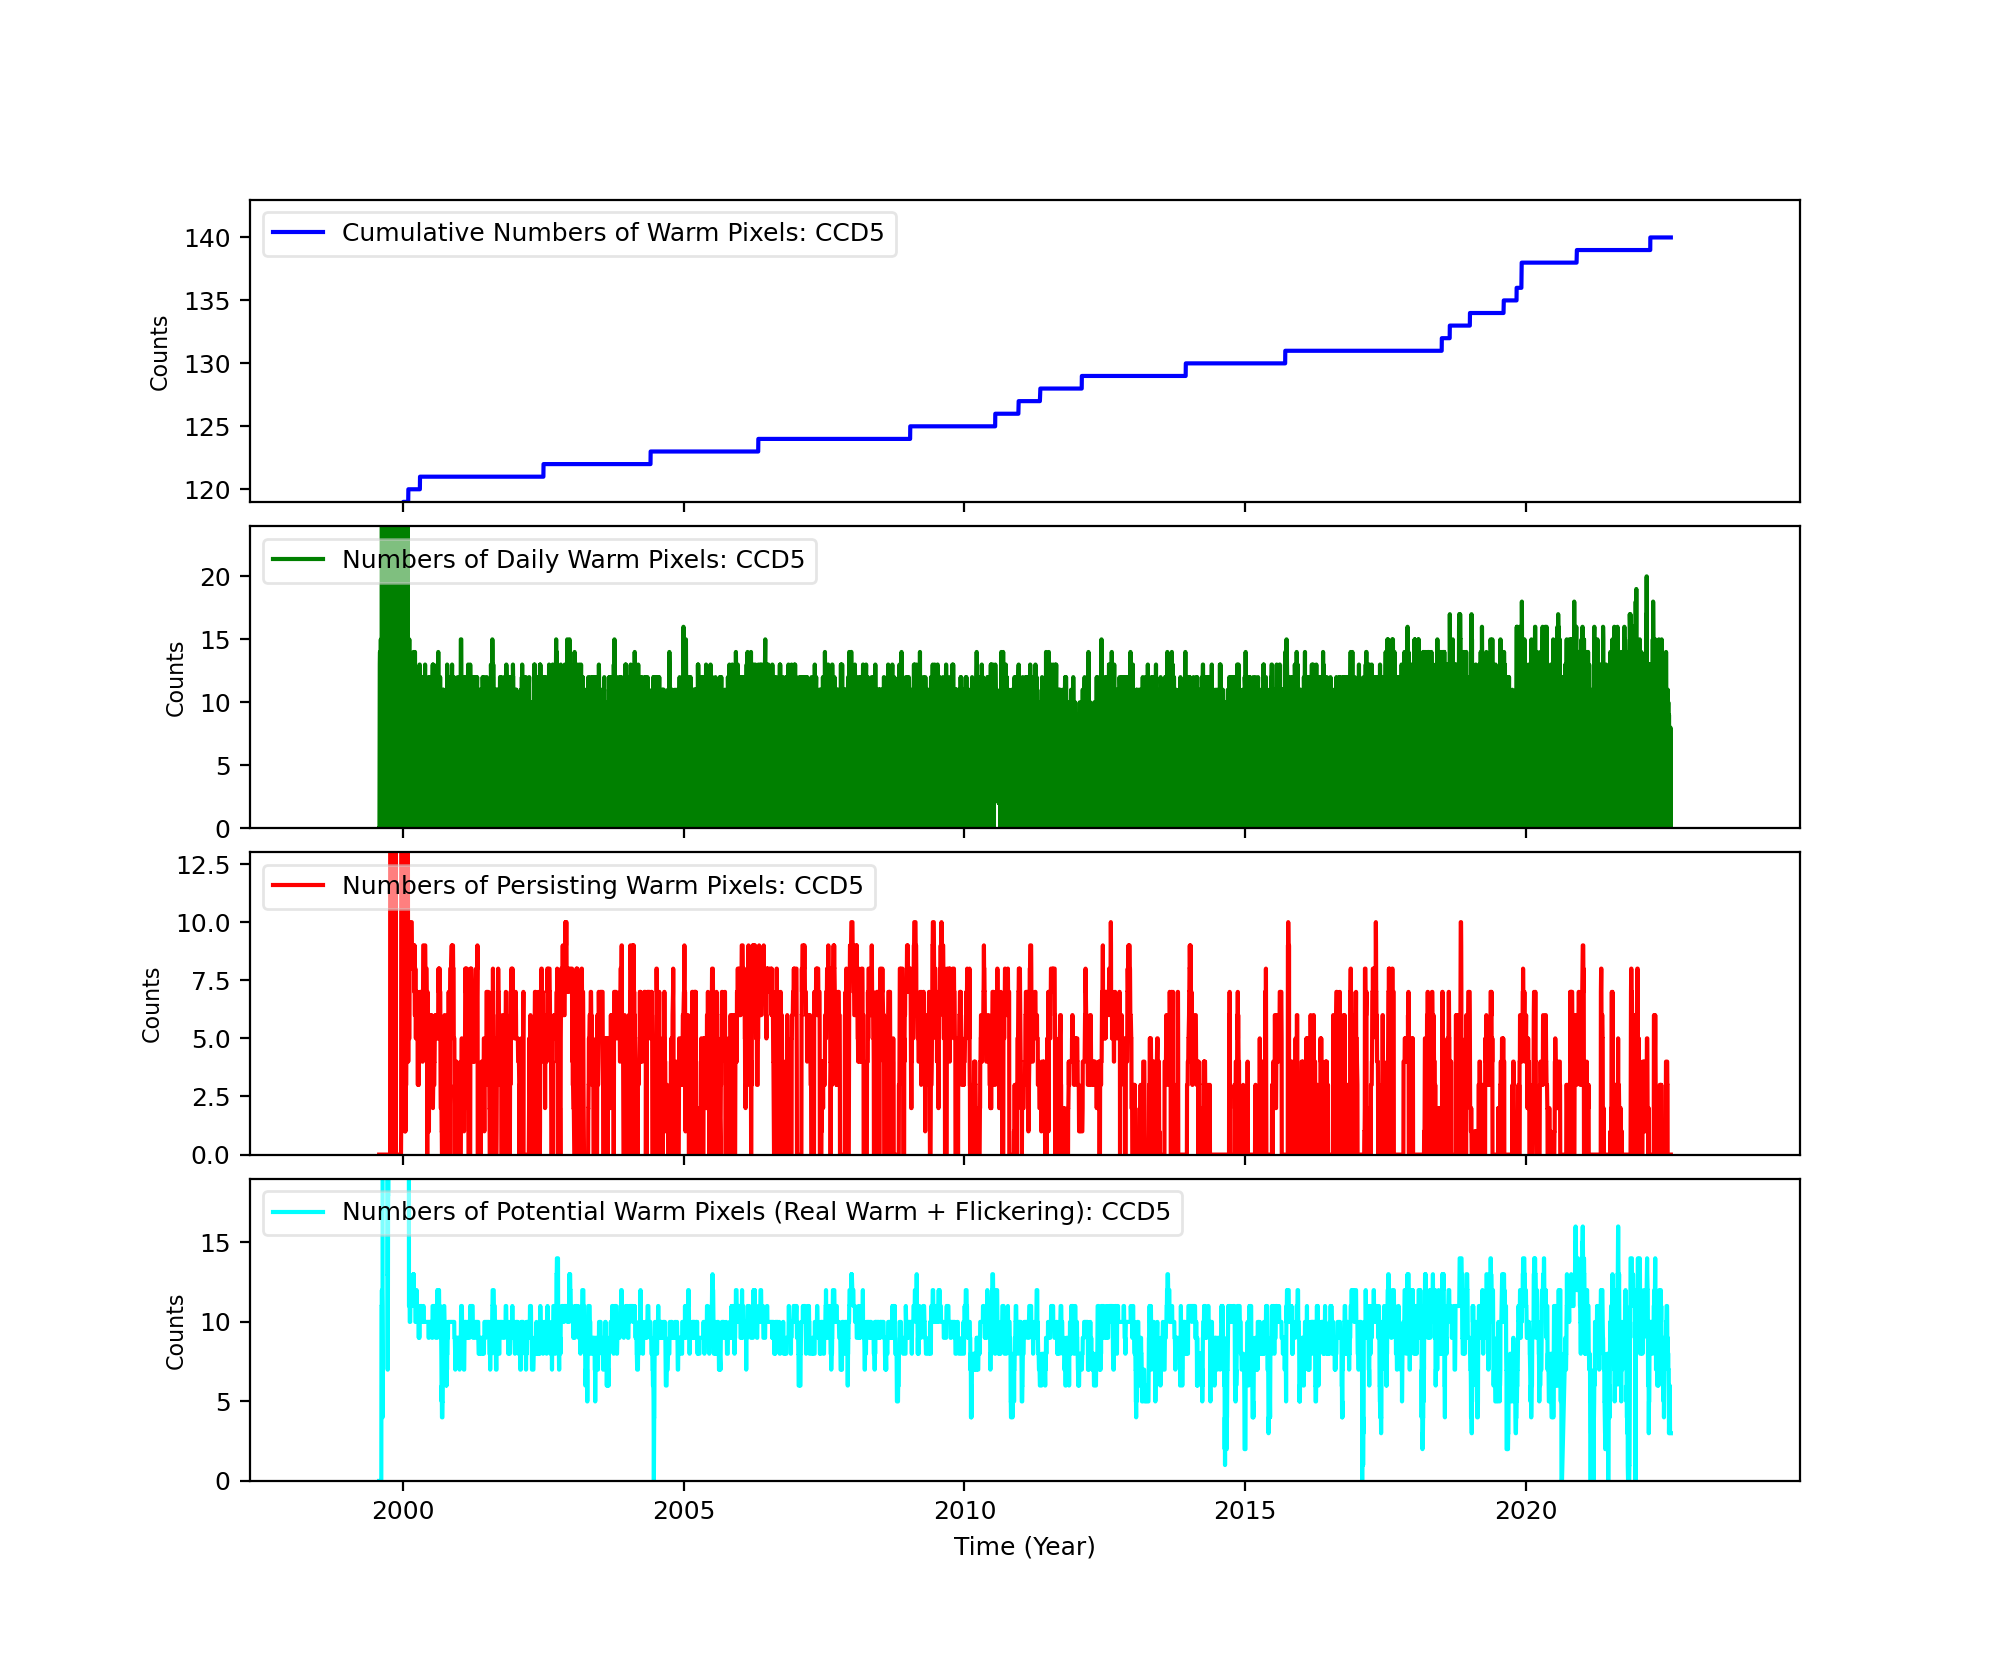
Bad Pixels
The plots below were generated with a new warm pixel finding script. Please see Acis Bad Pixel Page for details.
Front Side CCDs
Back Side CCD (CCD5)
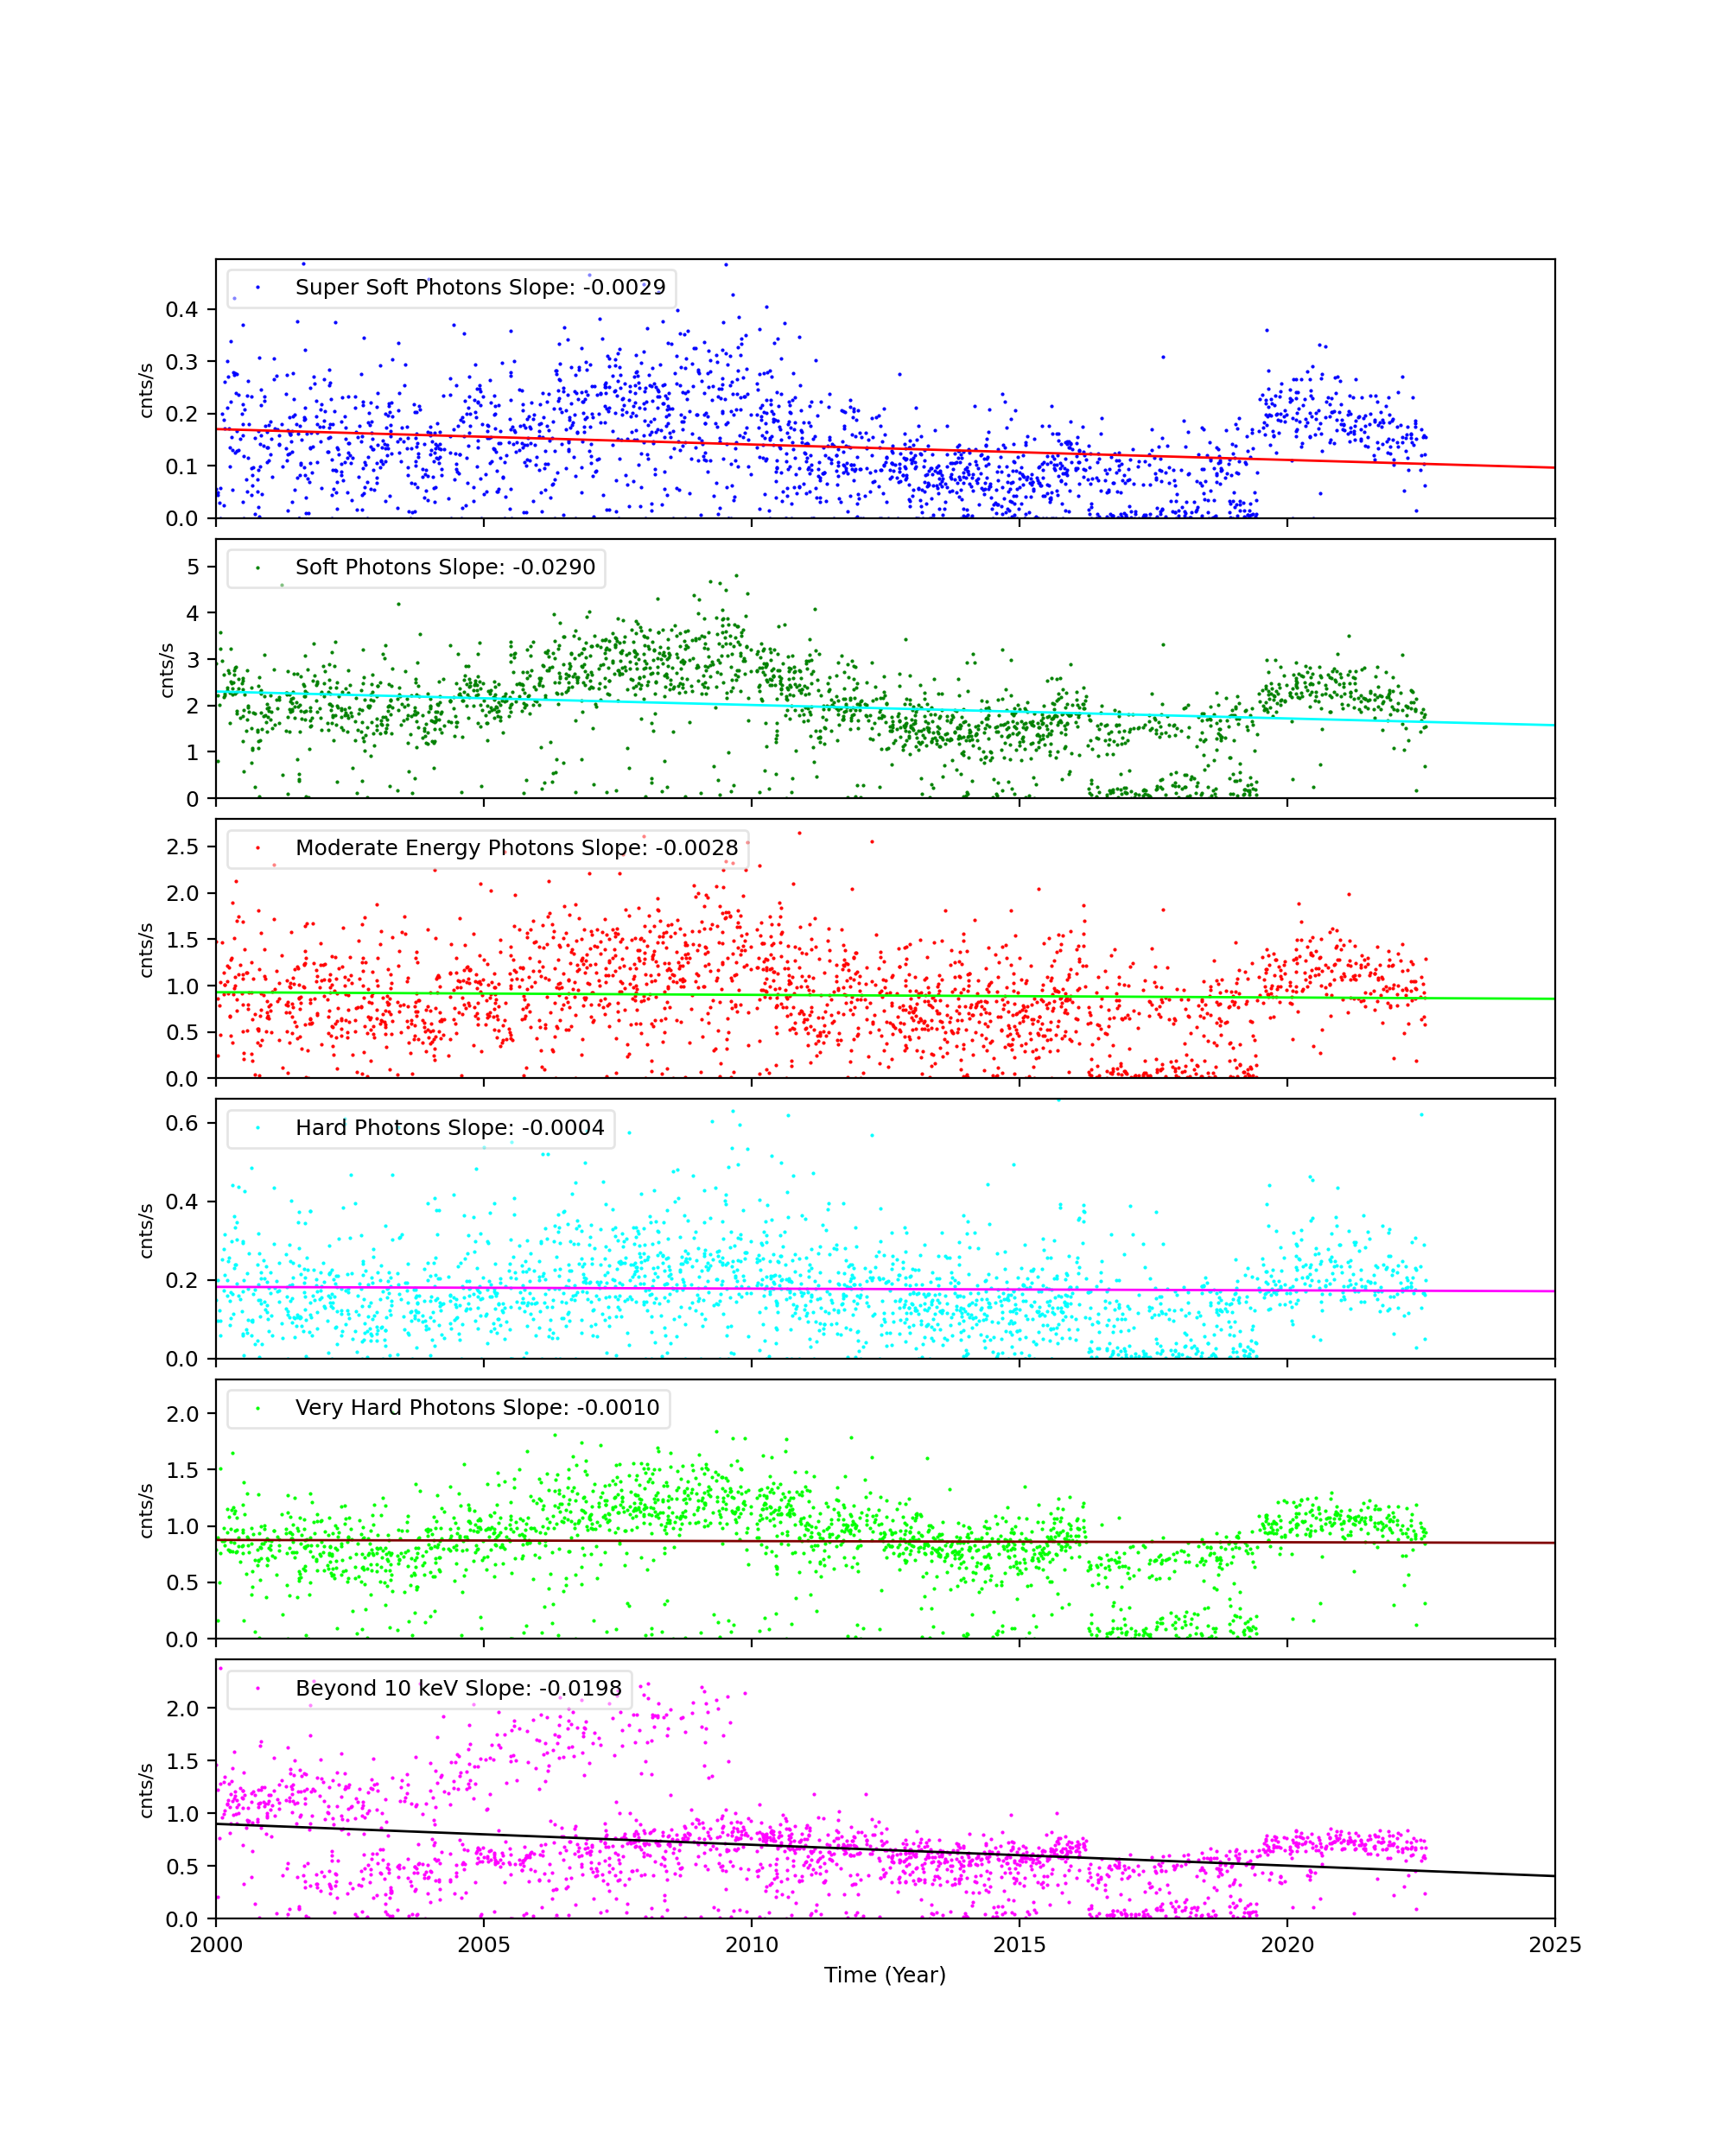
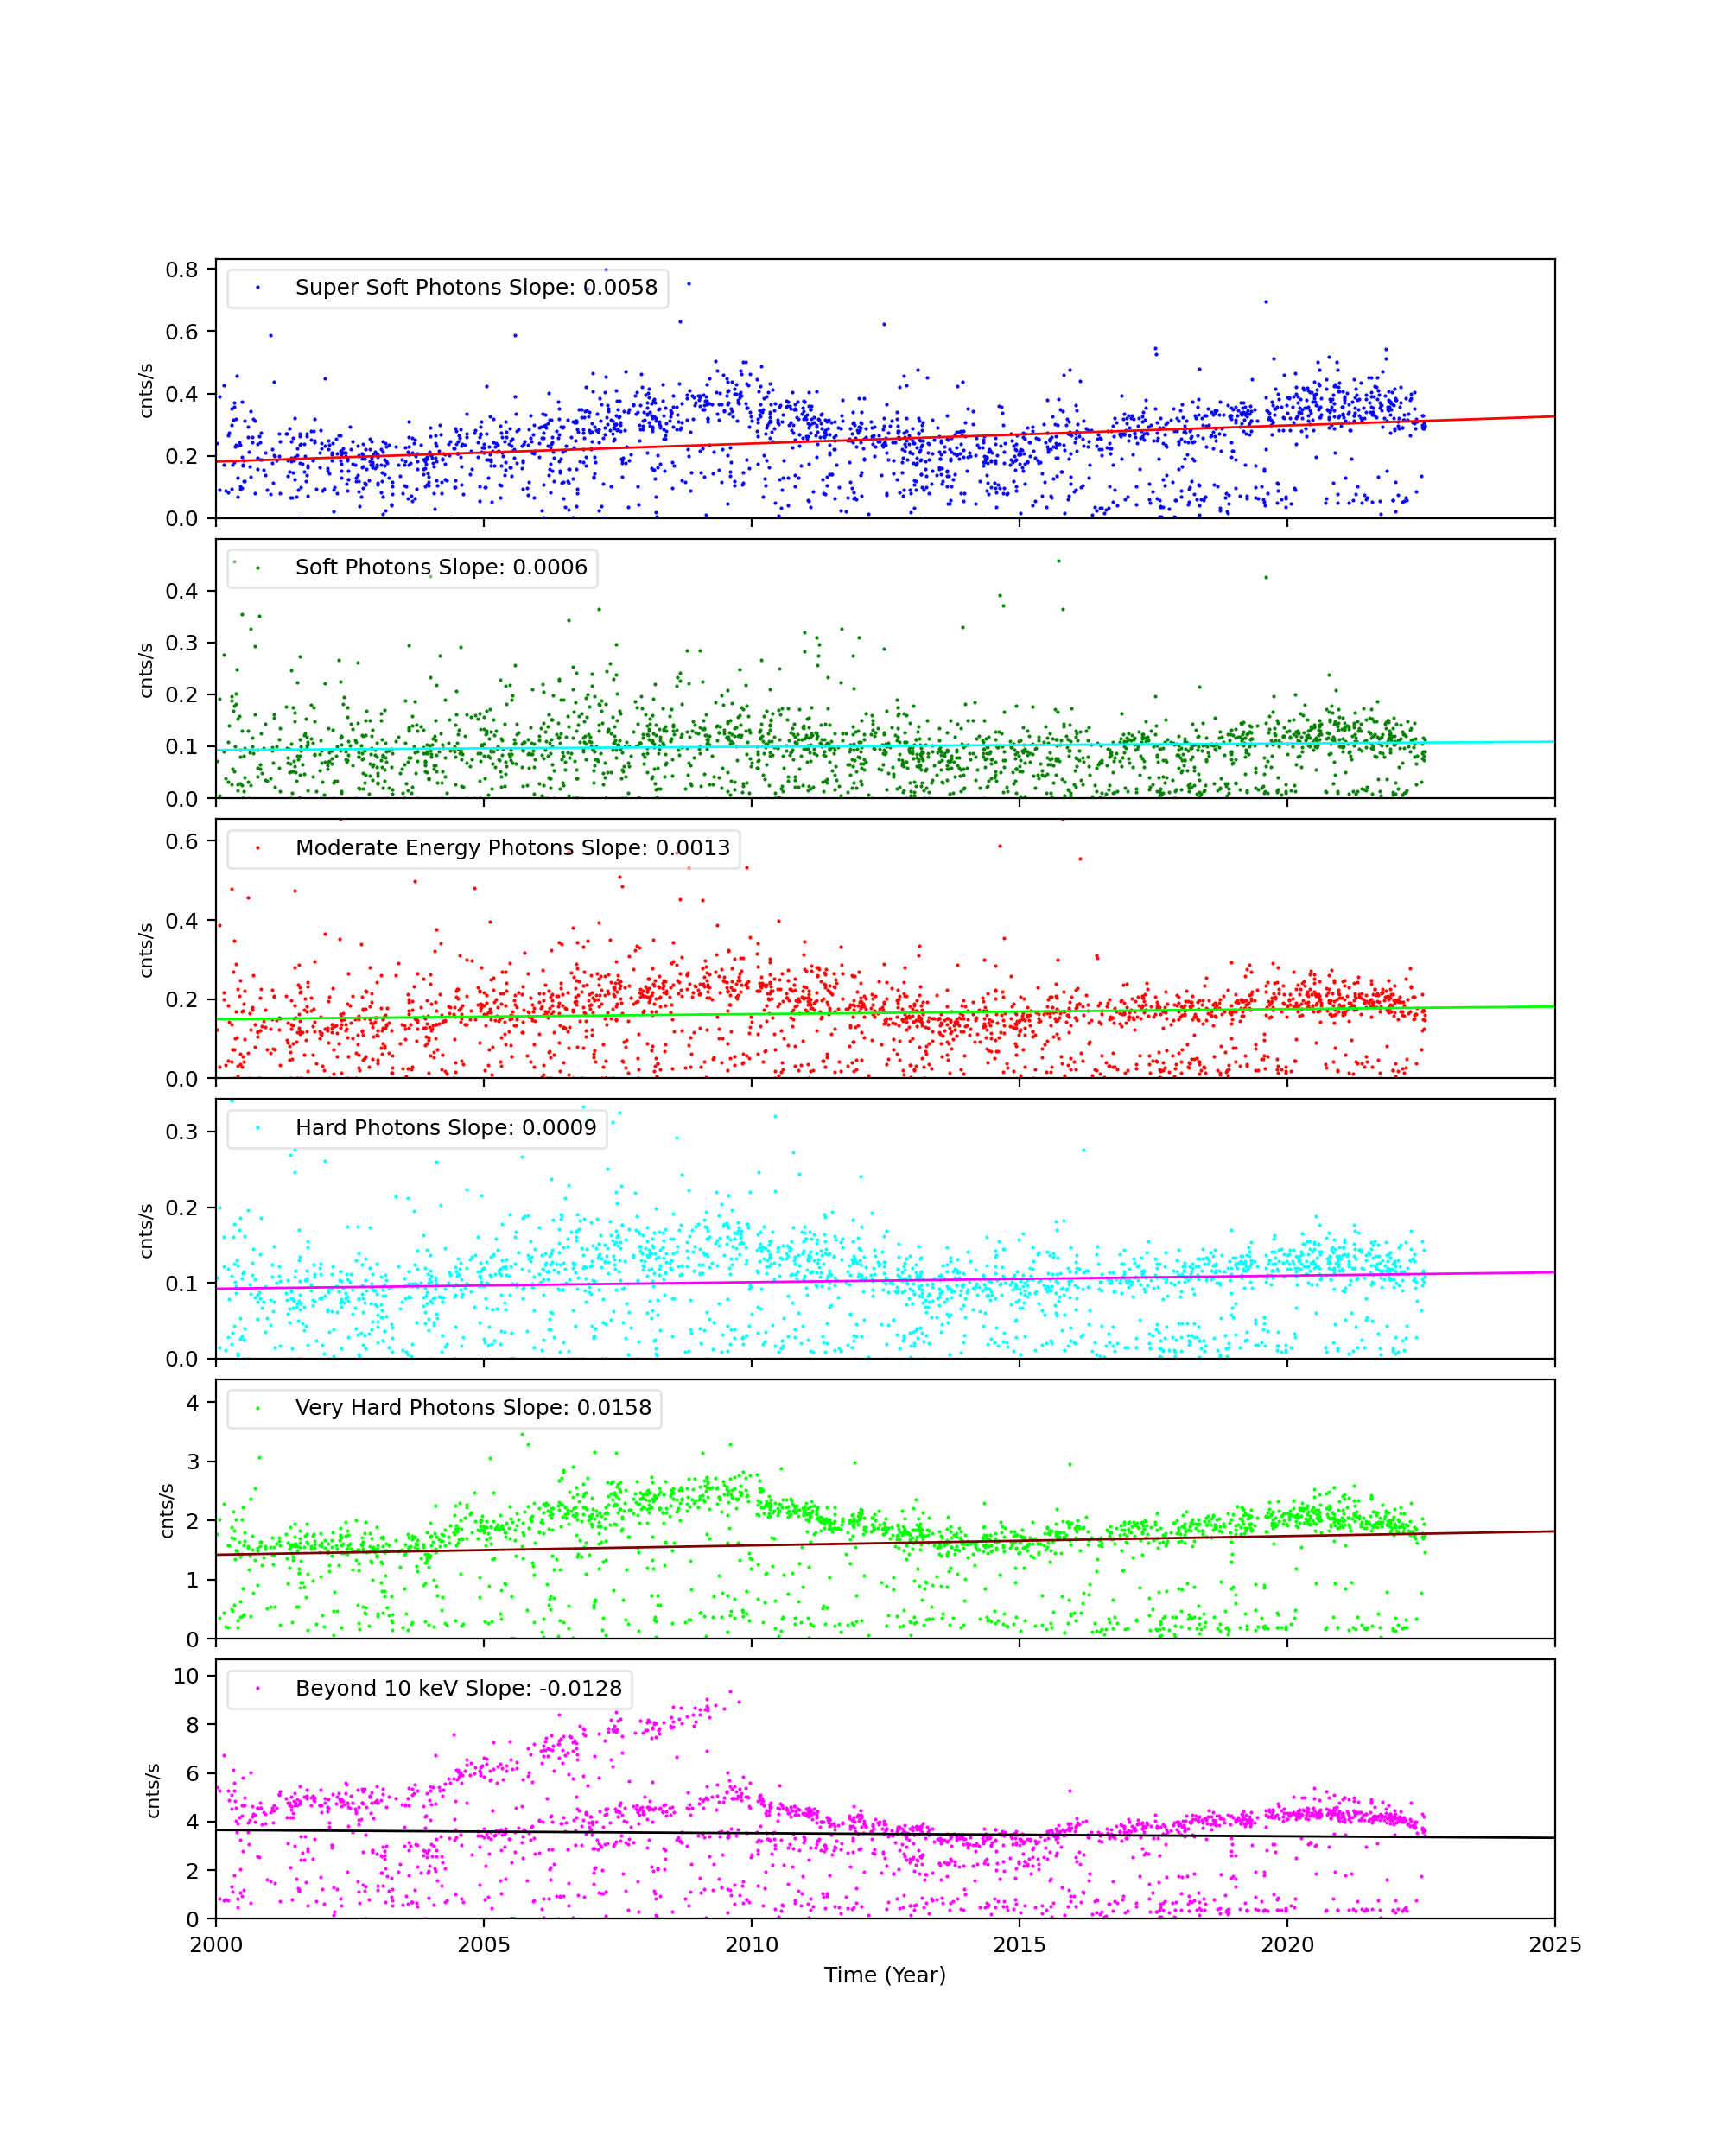
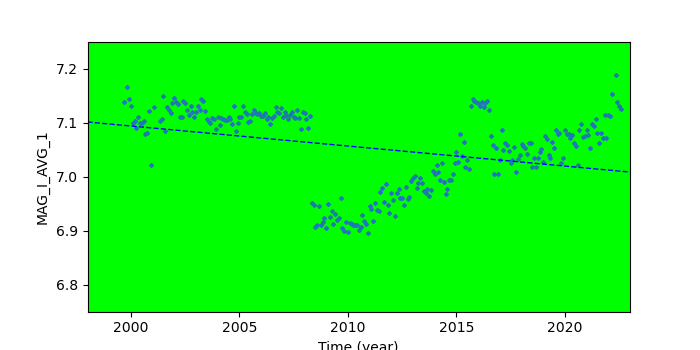
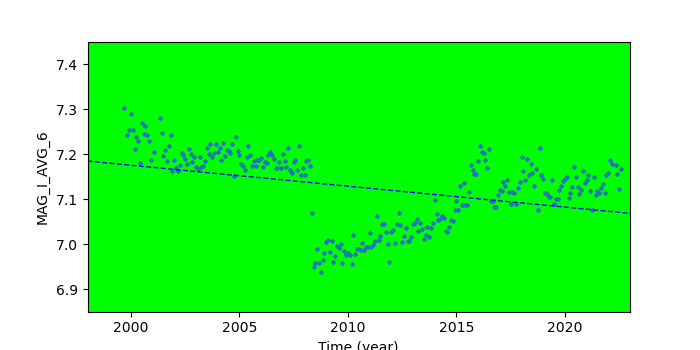
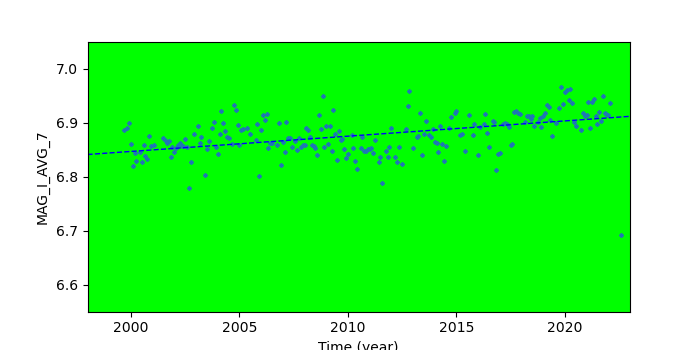
Science Instrument Background Rates
| Name | Low (keV) | High(KeV) | Description |
|---|---|---|---|
| SSoft | 0.00 | 0.50 | Super soft photons |
| Soft | 0.50 | 1.00 | Soft photons |
| Med | 1.00 | 3.00 | Moderate energy photons |
| Hard | 3.00 | 5.00 | Hard Photons |
| Harder | 5.00 | 10.00 | Very Hard photons |
| Hardest | 10.00 | Beyond 10 keV |
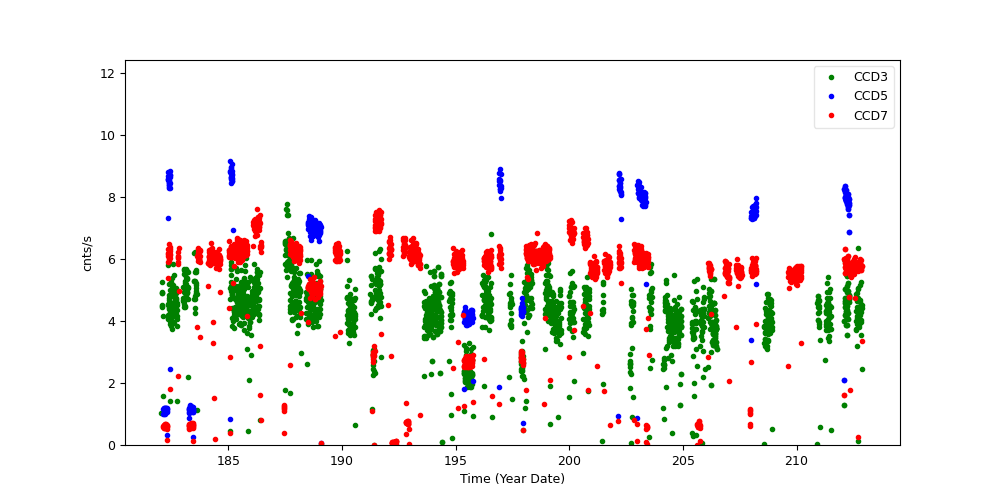
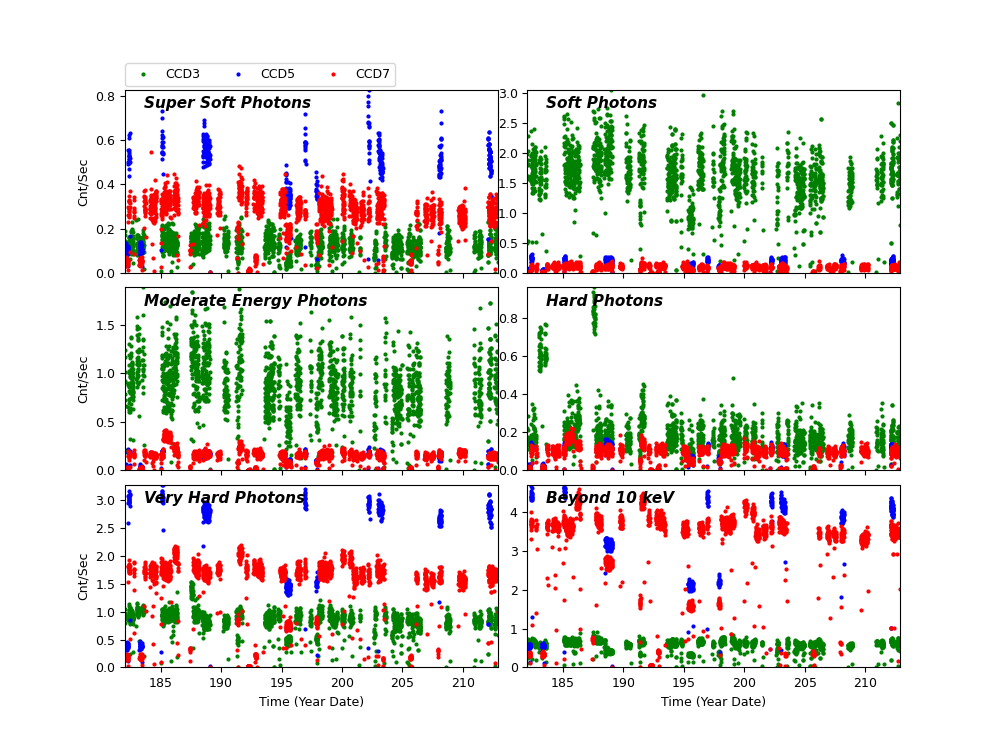
The following three plots show trends of SIB from year 2000. CCDs shown here are CCD3, CCD5, and CCD7. Fitted lines are linear fit after eliminating extreme outliers. For >10 keV plots, 2 lines are fit. One is with a 13 keV filter, and another without.
CCD 3
CCD 5
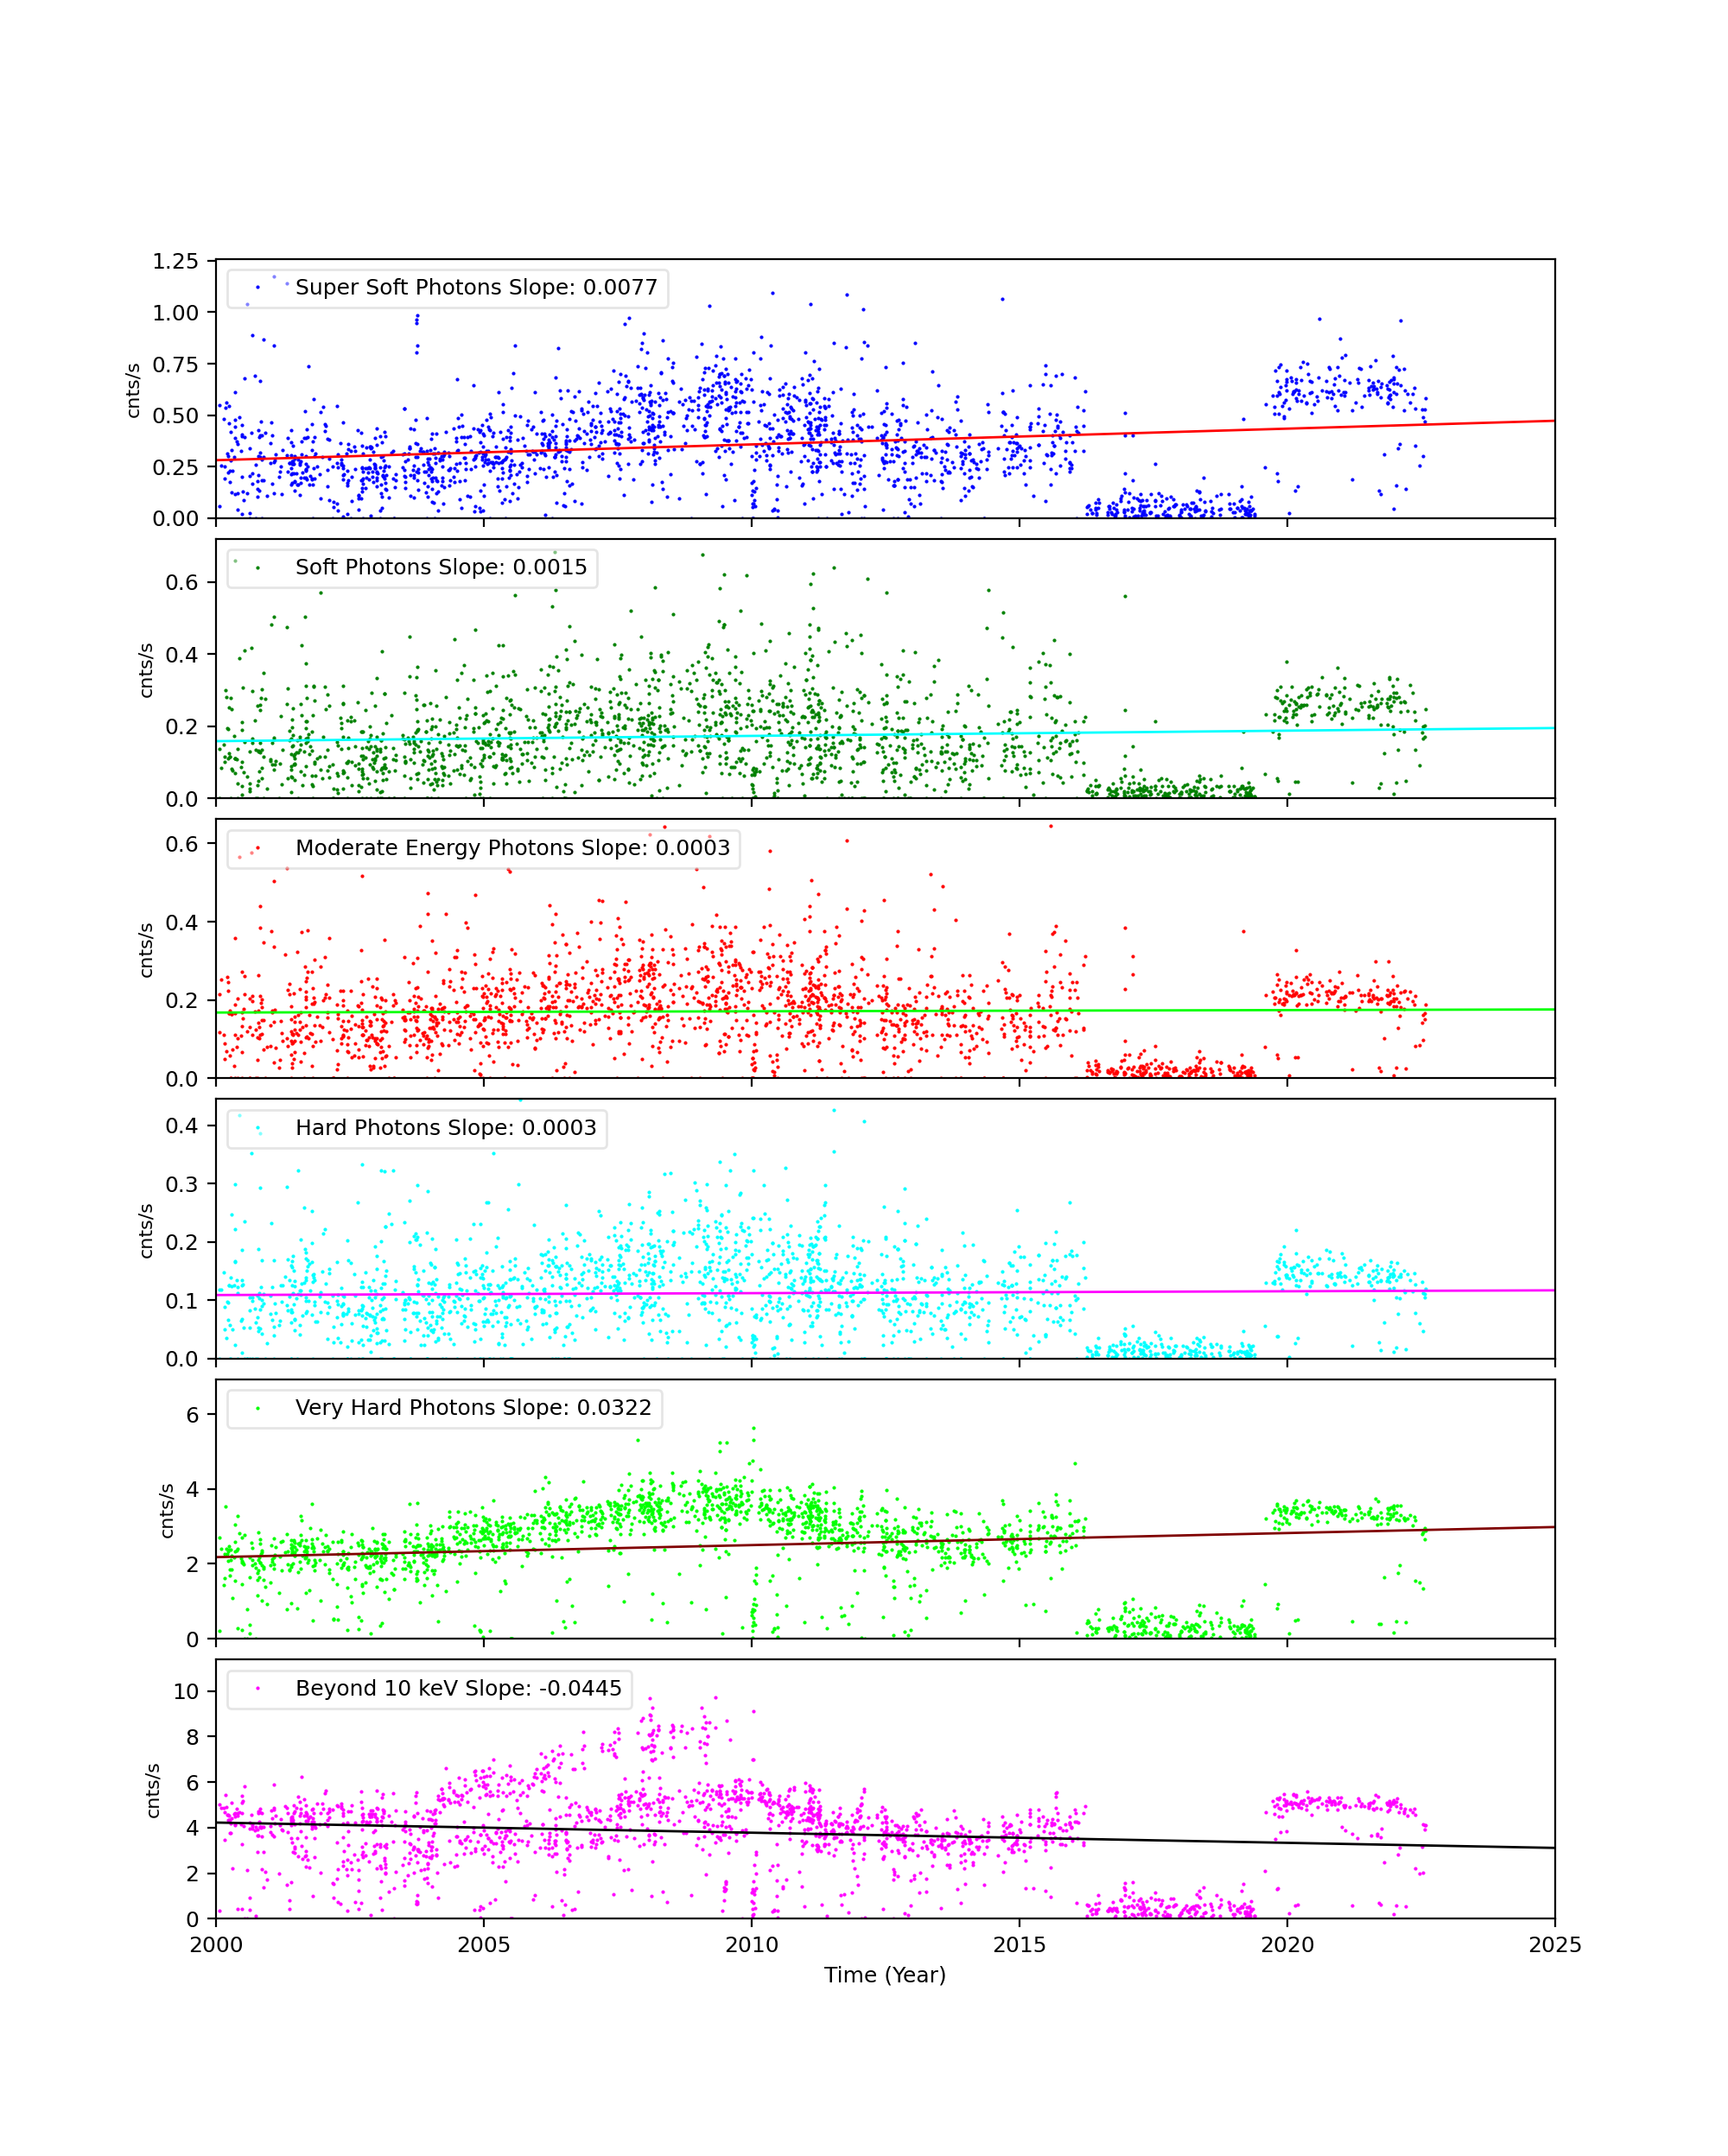
CCD 7
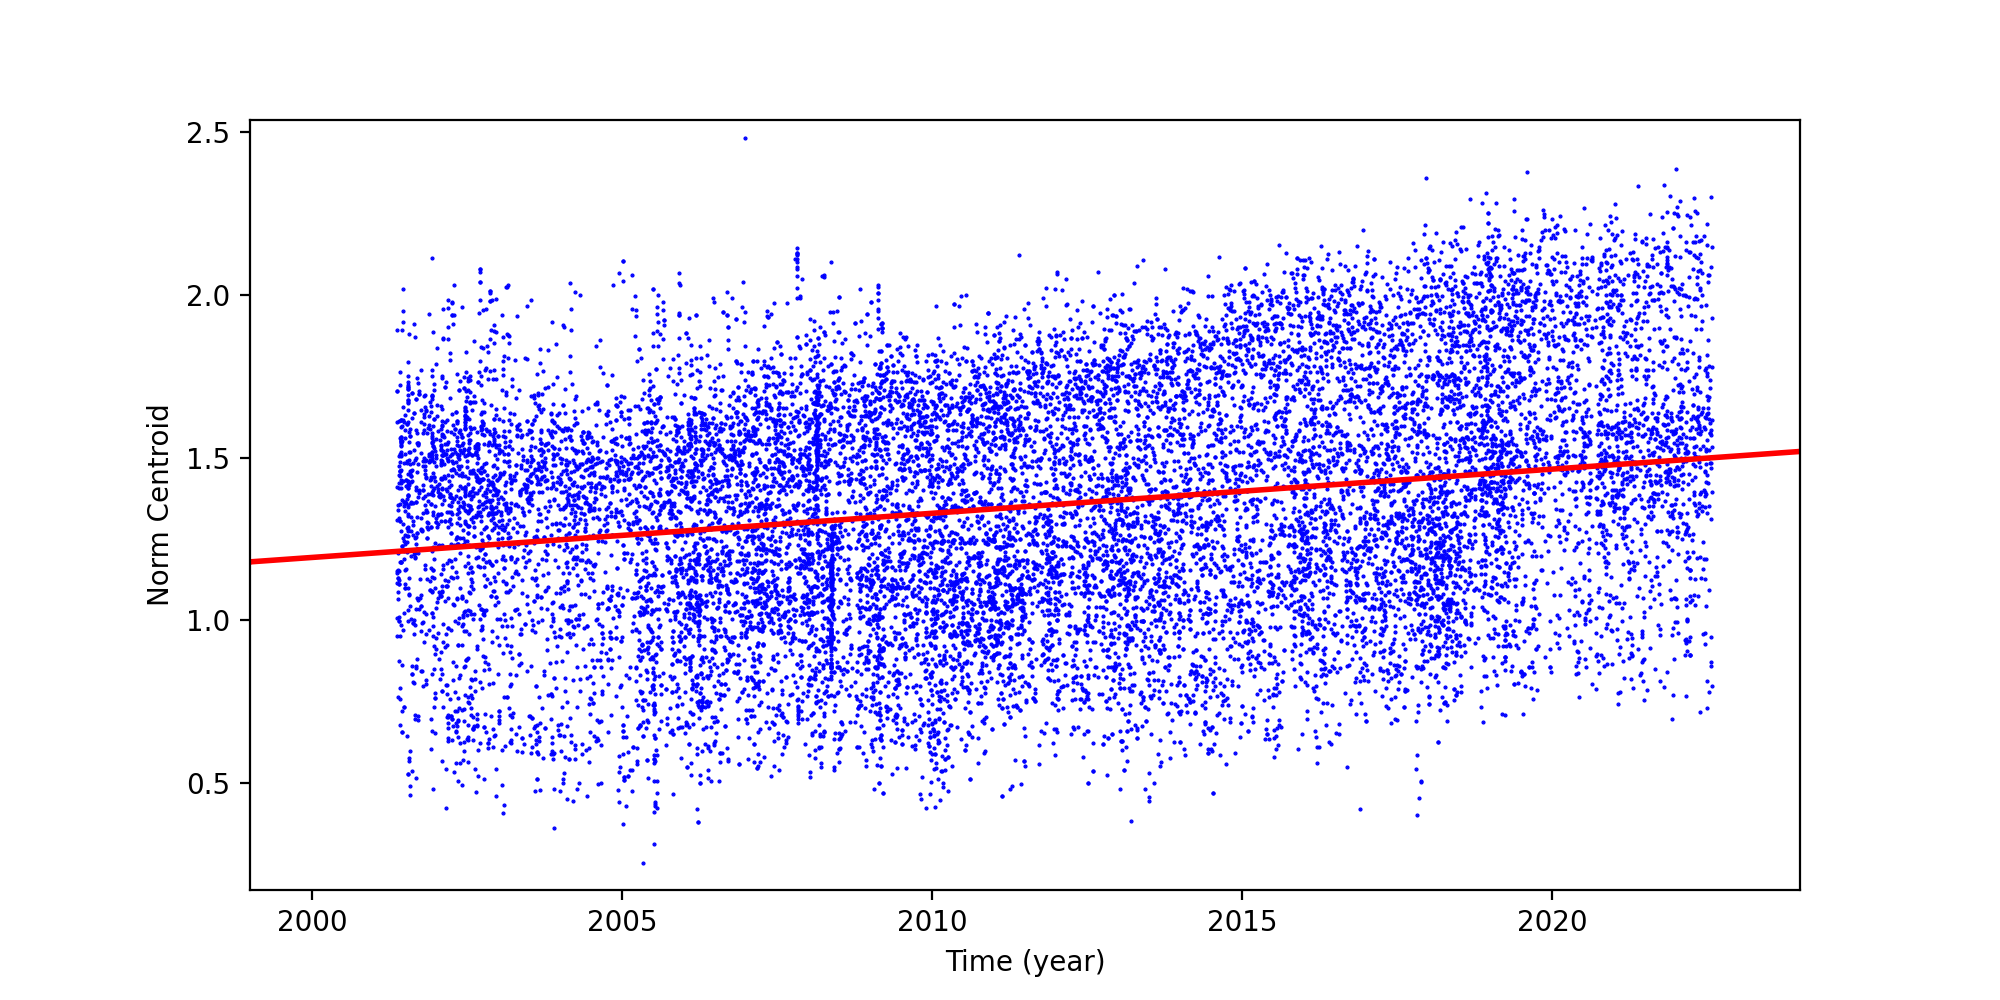
ACIS Corner Pixels
We plot the average corner pixel centroid slope and mean for ACIS observations. Separate plots are shown for FAINT MODE (3X3) and VFAINT MODE (5X5) observations. Metric is the centroid of a Gaussian fit to the histogram of corner pixel PHA values of detected events. Plus signs are FAINT observations, diamonds are VFAINT observations, and boxes are VFAINT observations with centroids computed using only the corner pixels of a 3X3 event island (referred to as AFAINT). We see a very small upward trend.
CCD: I3
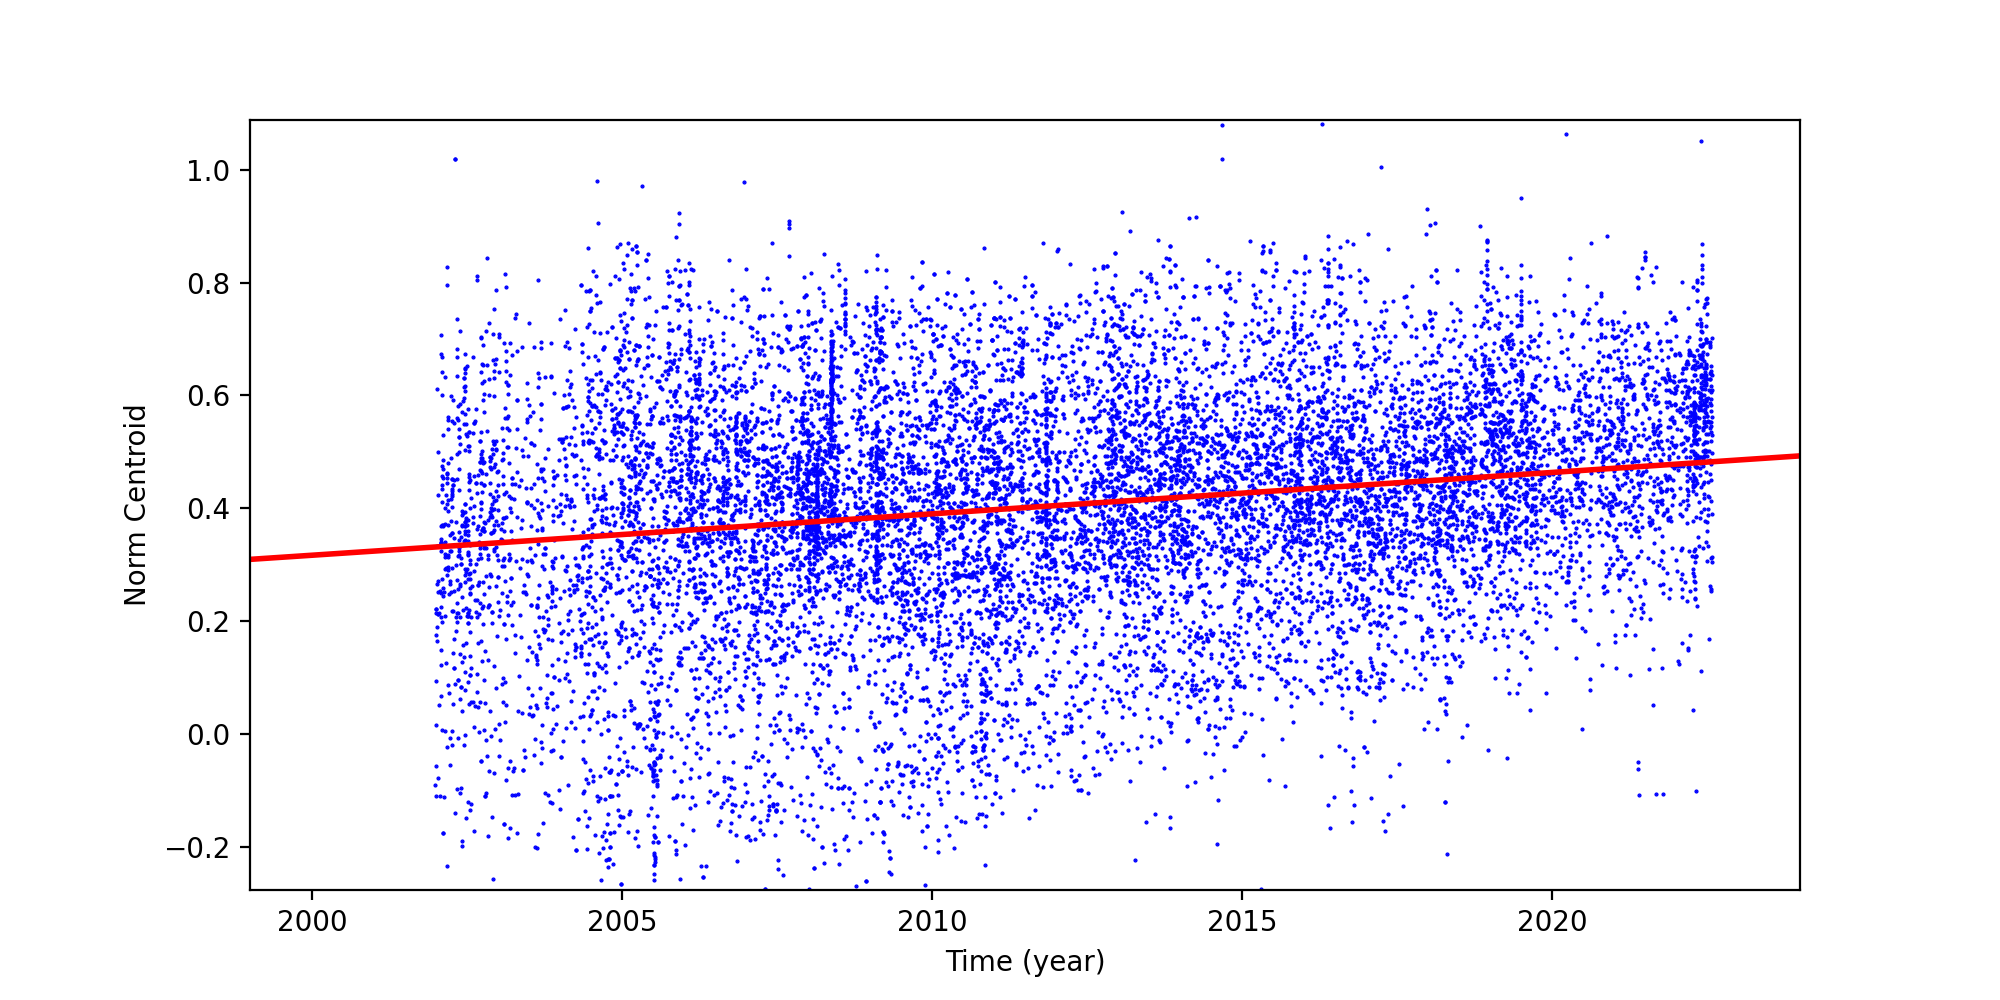
CCD: S3
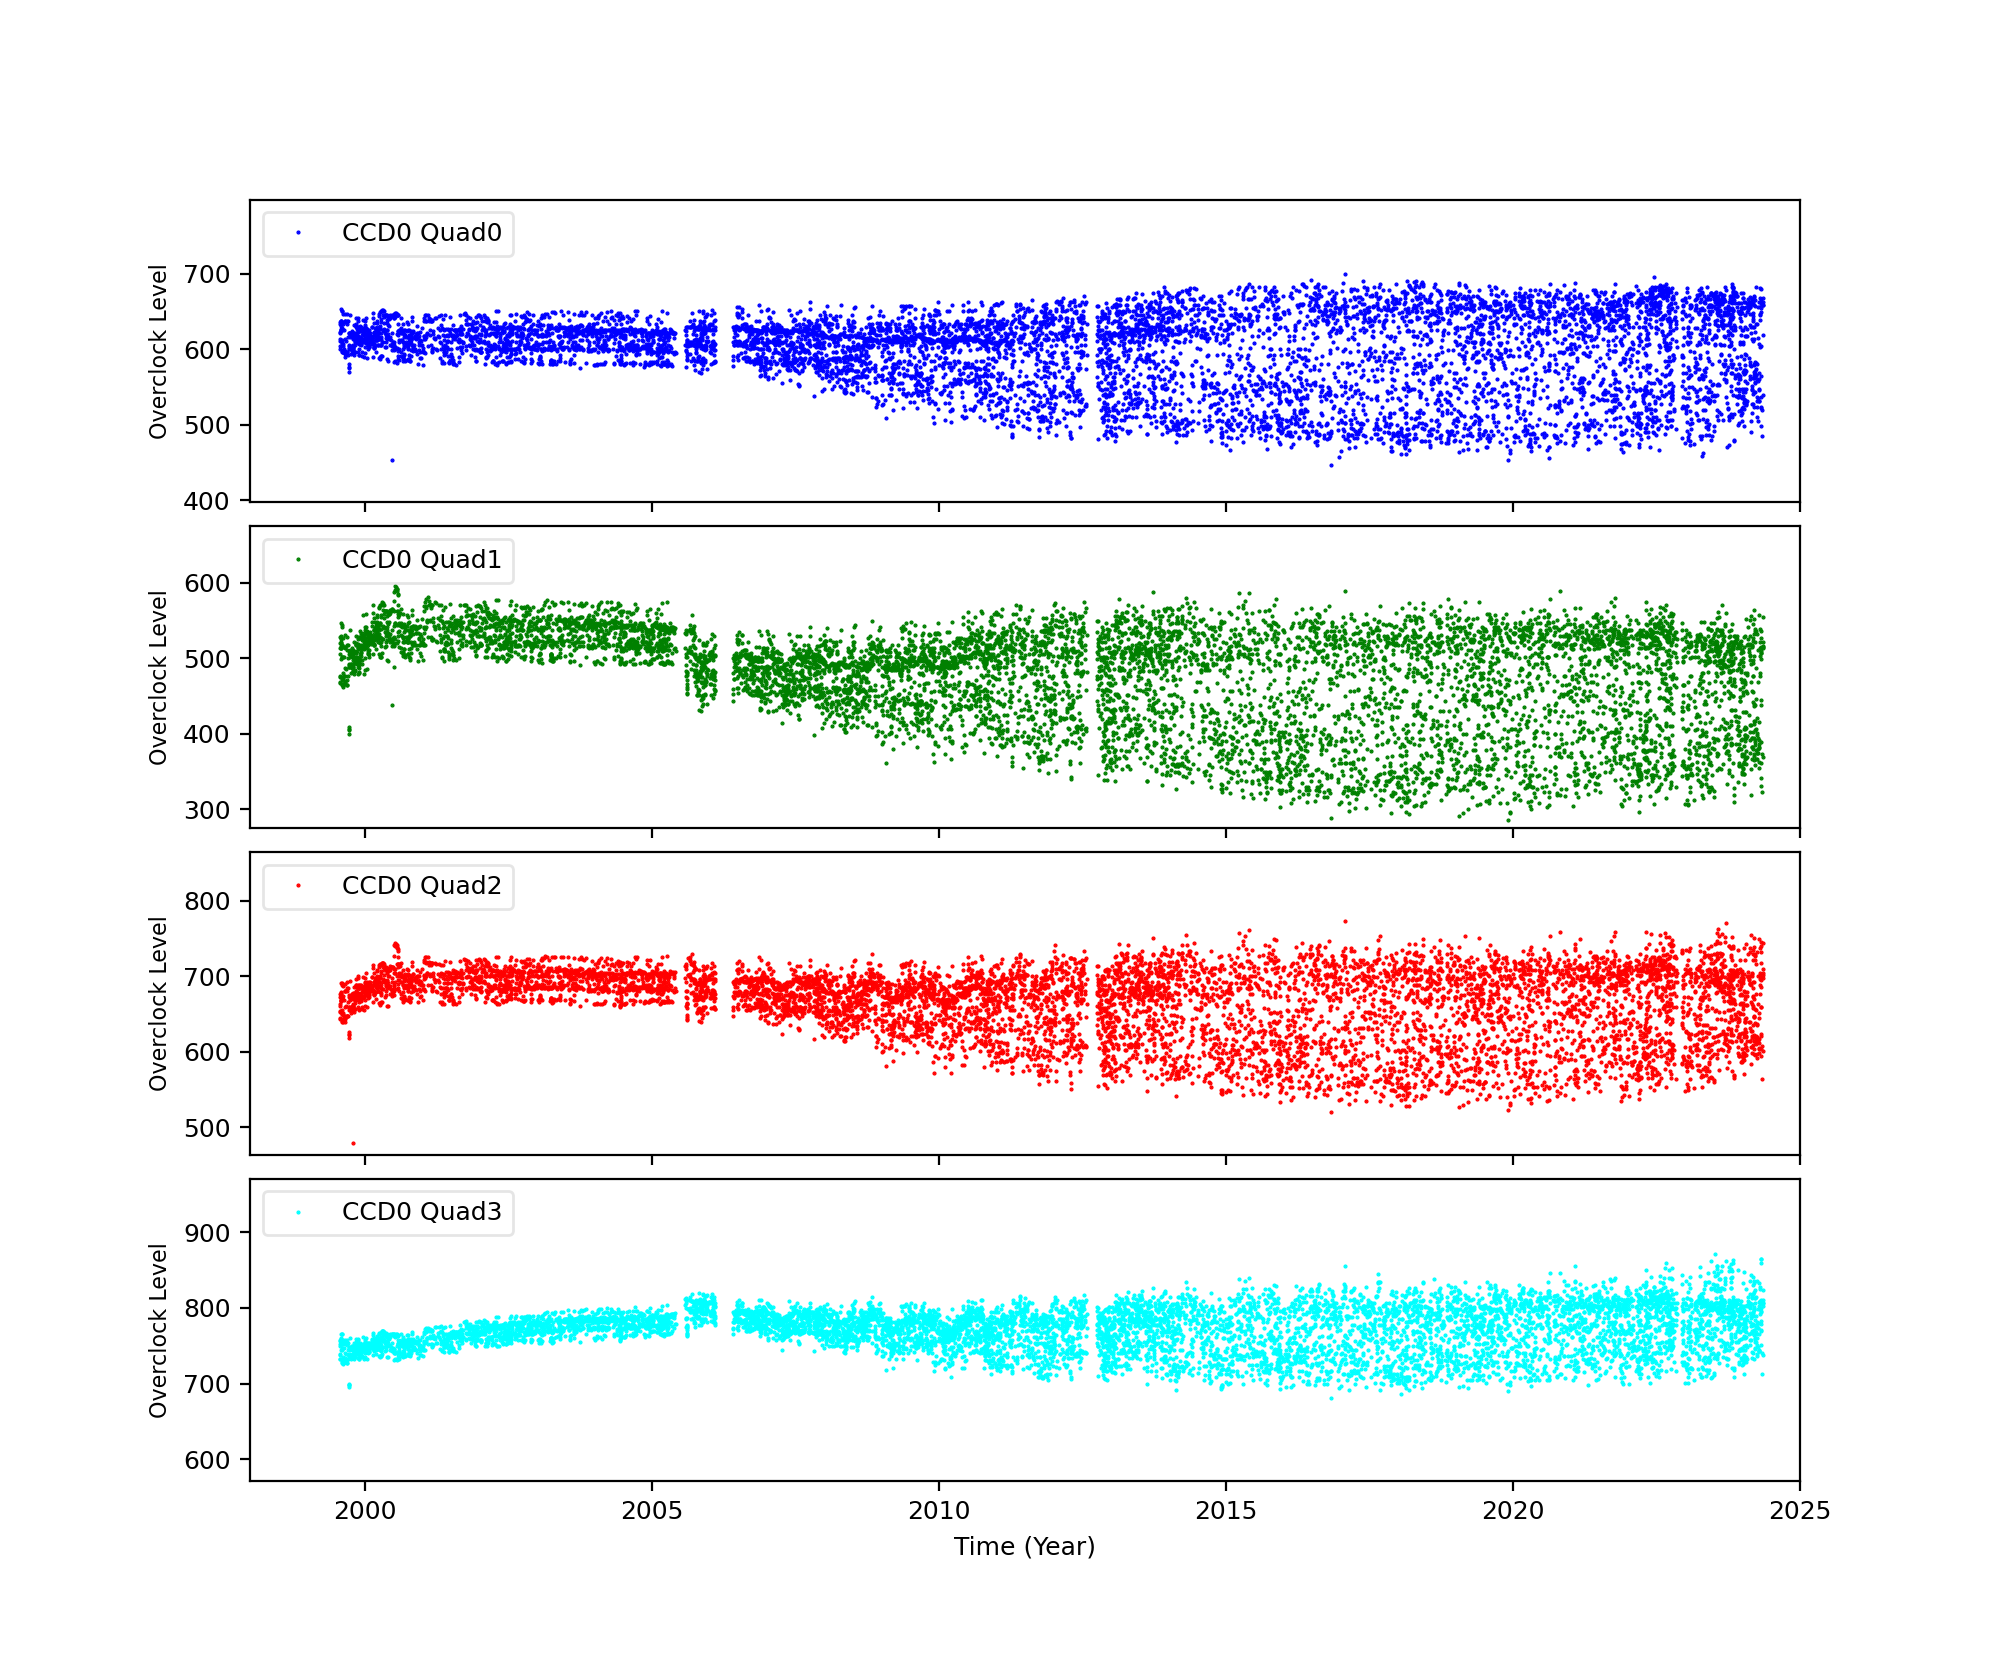
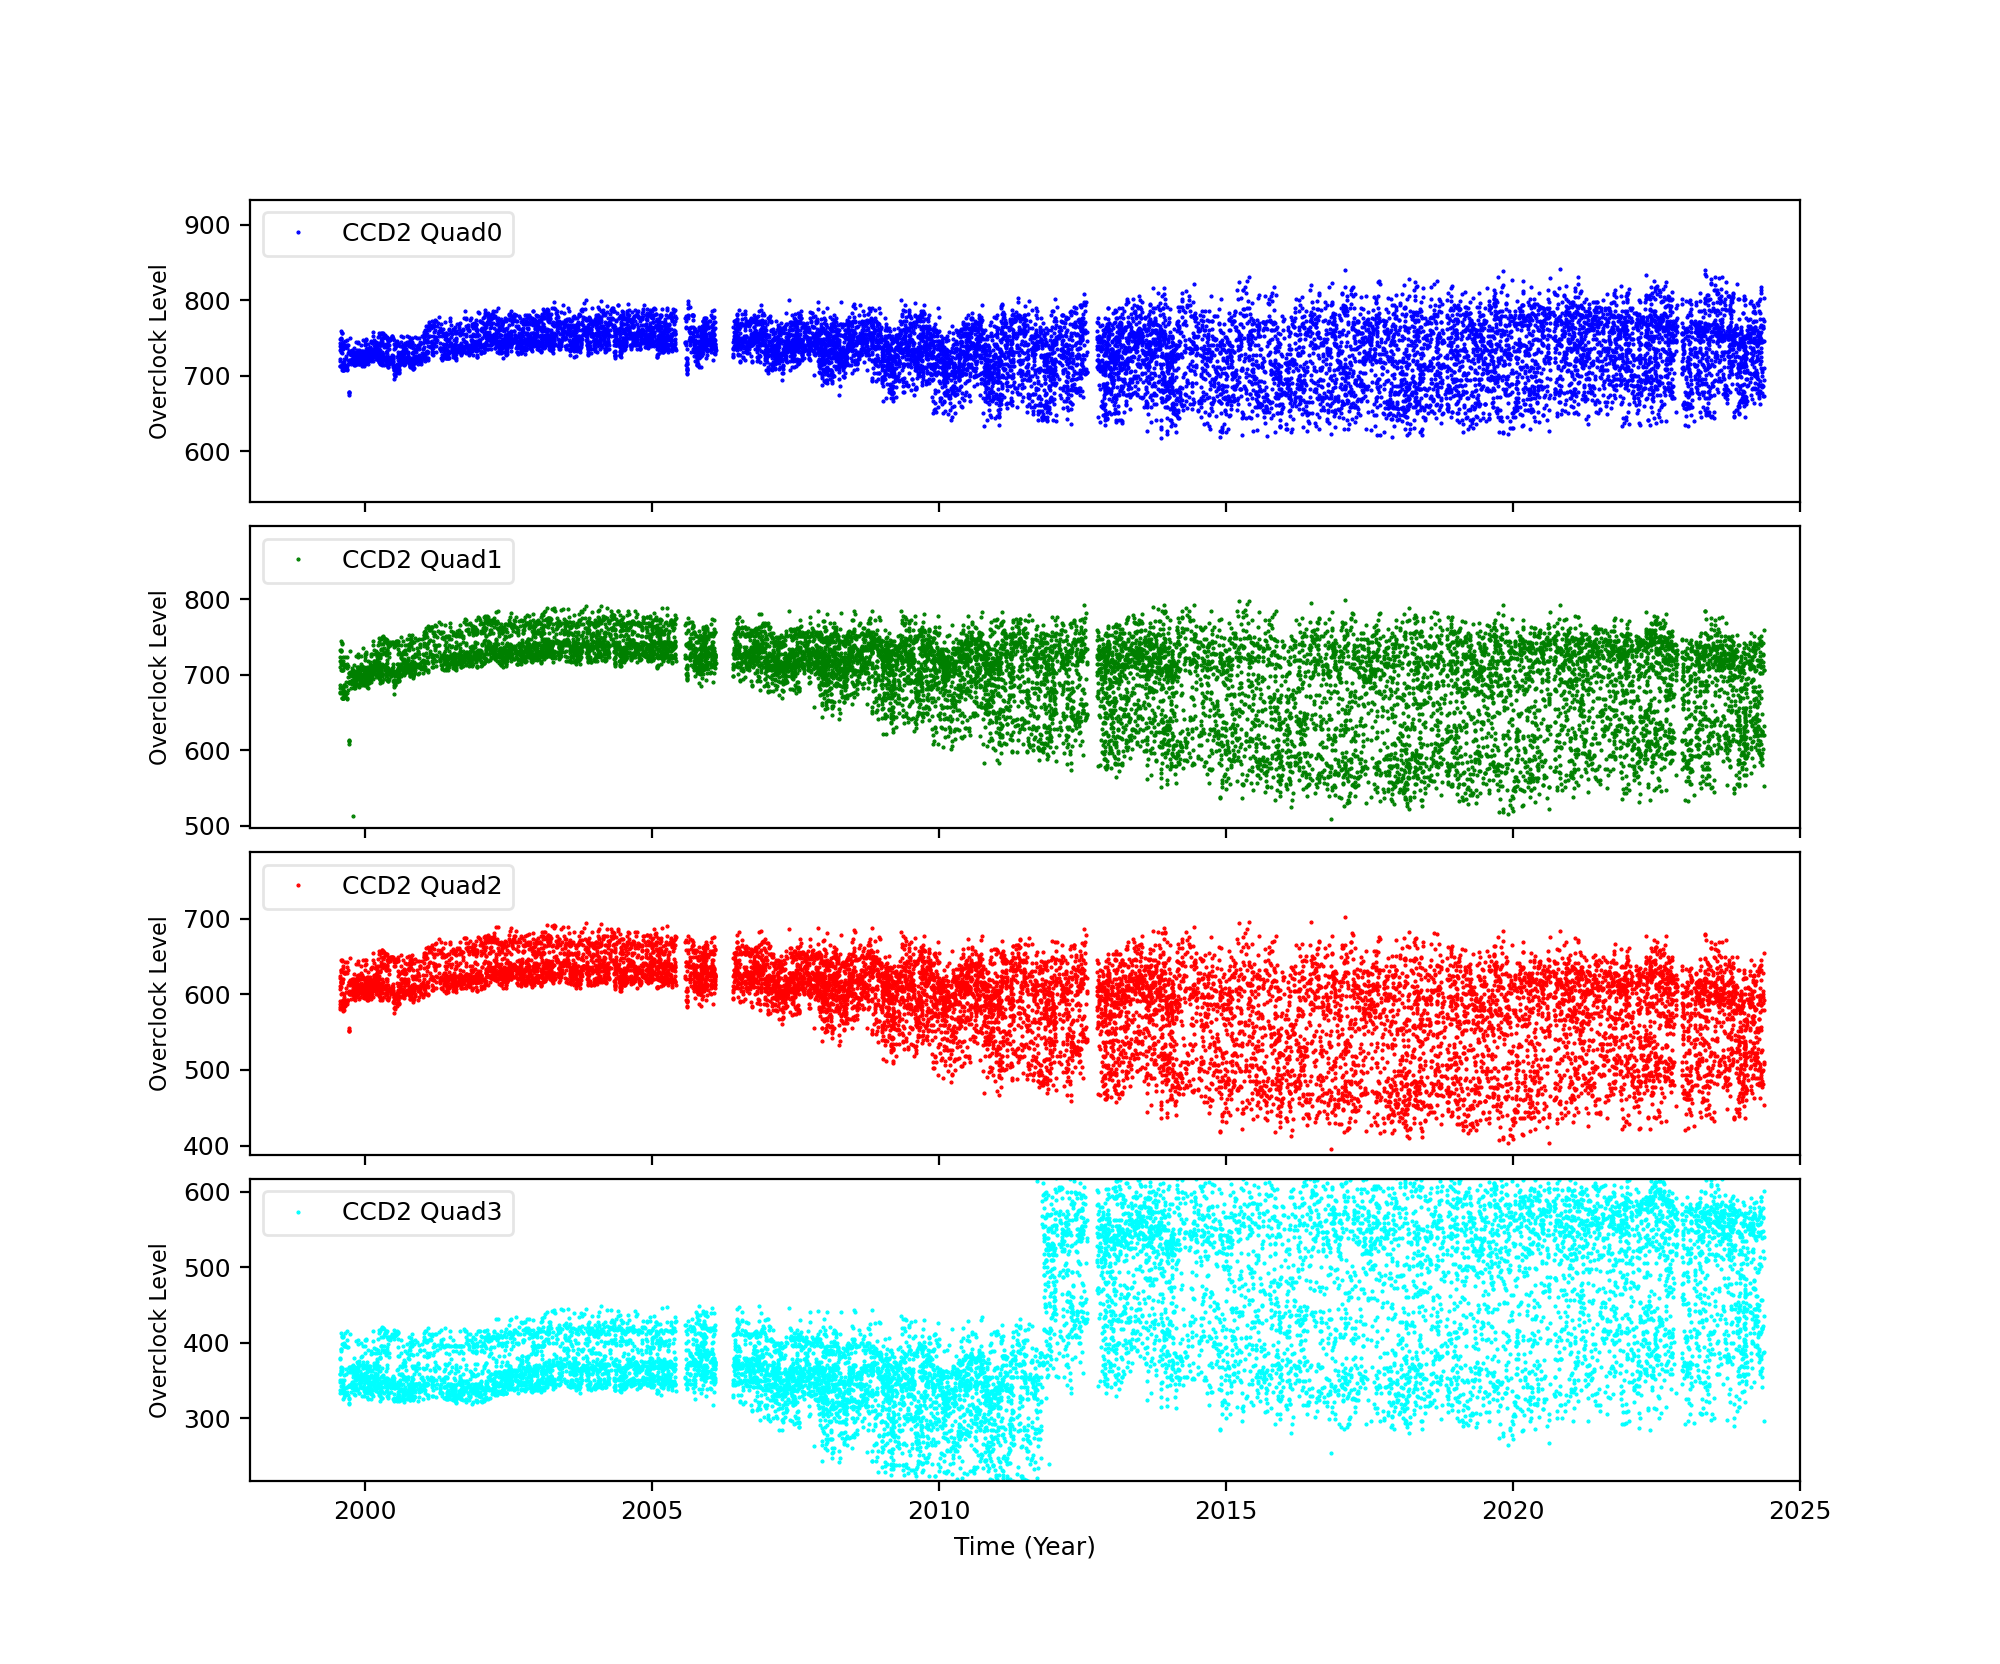
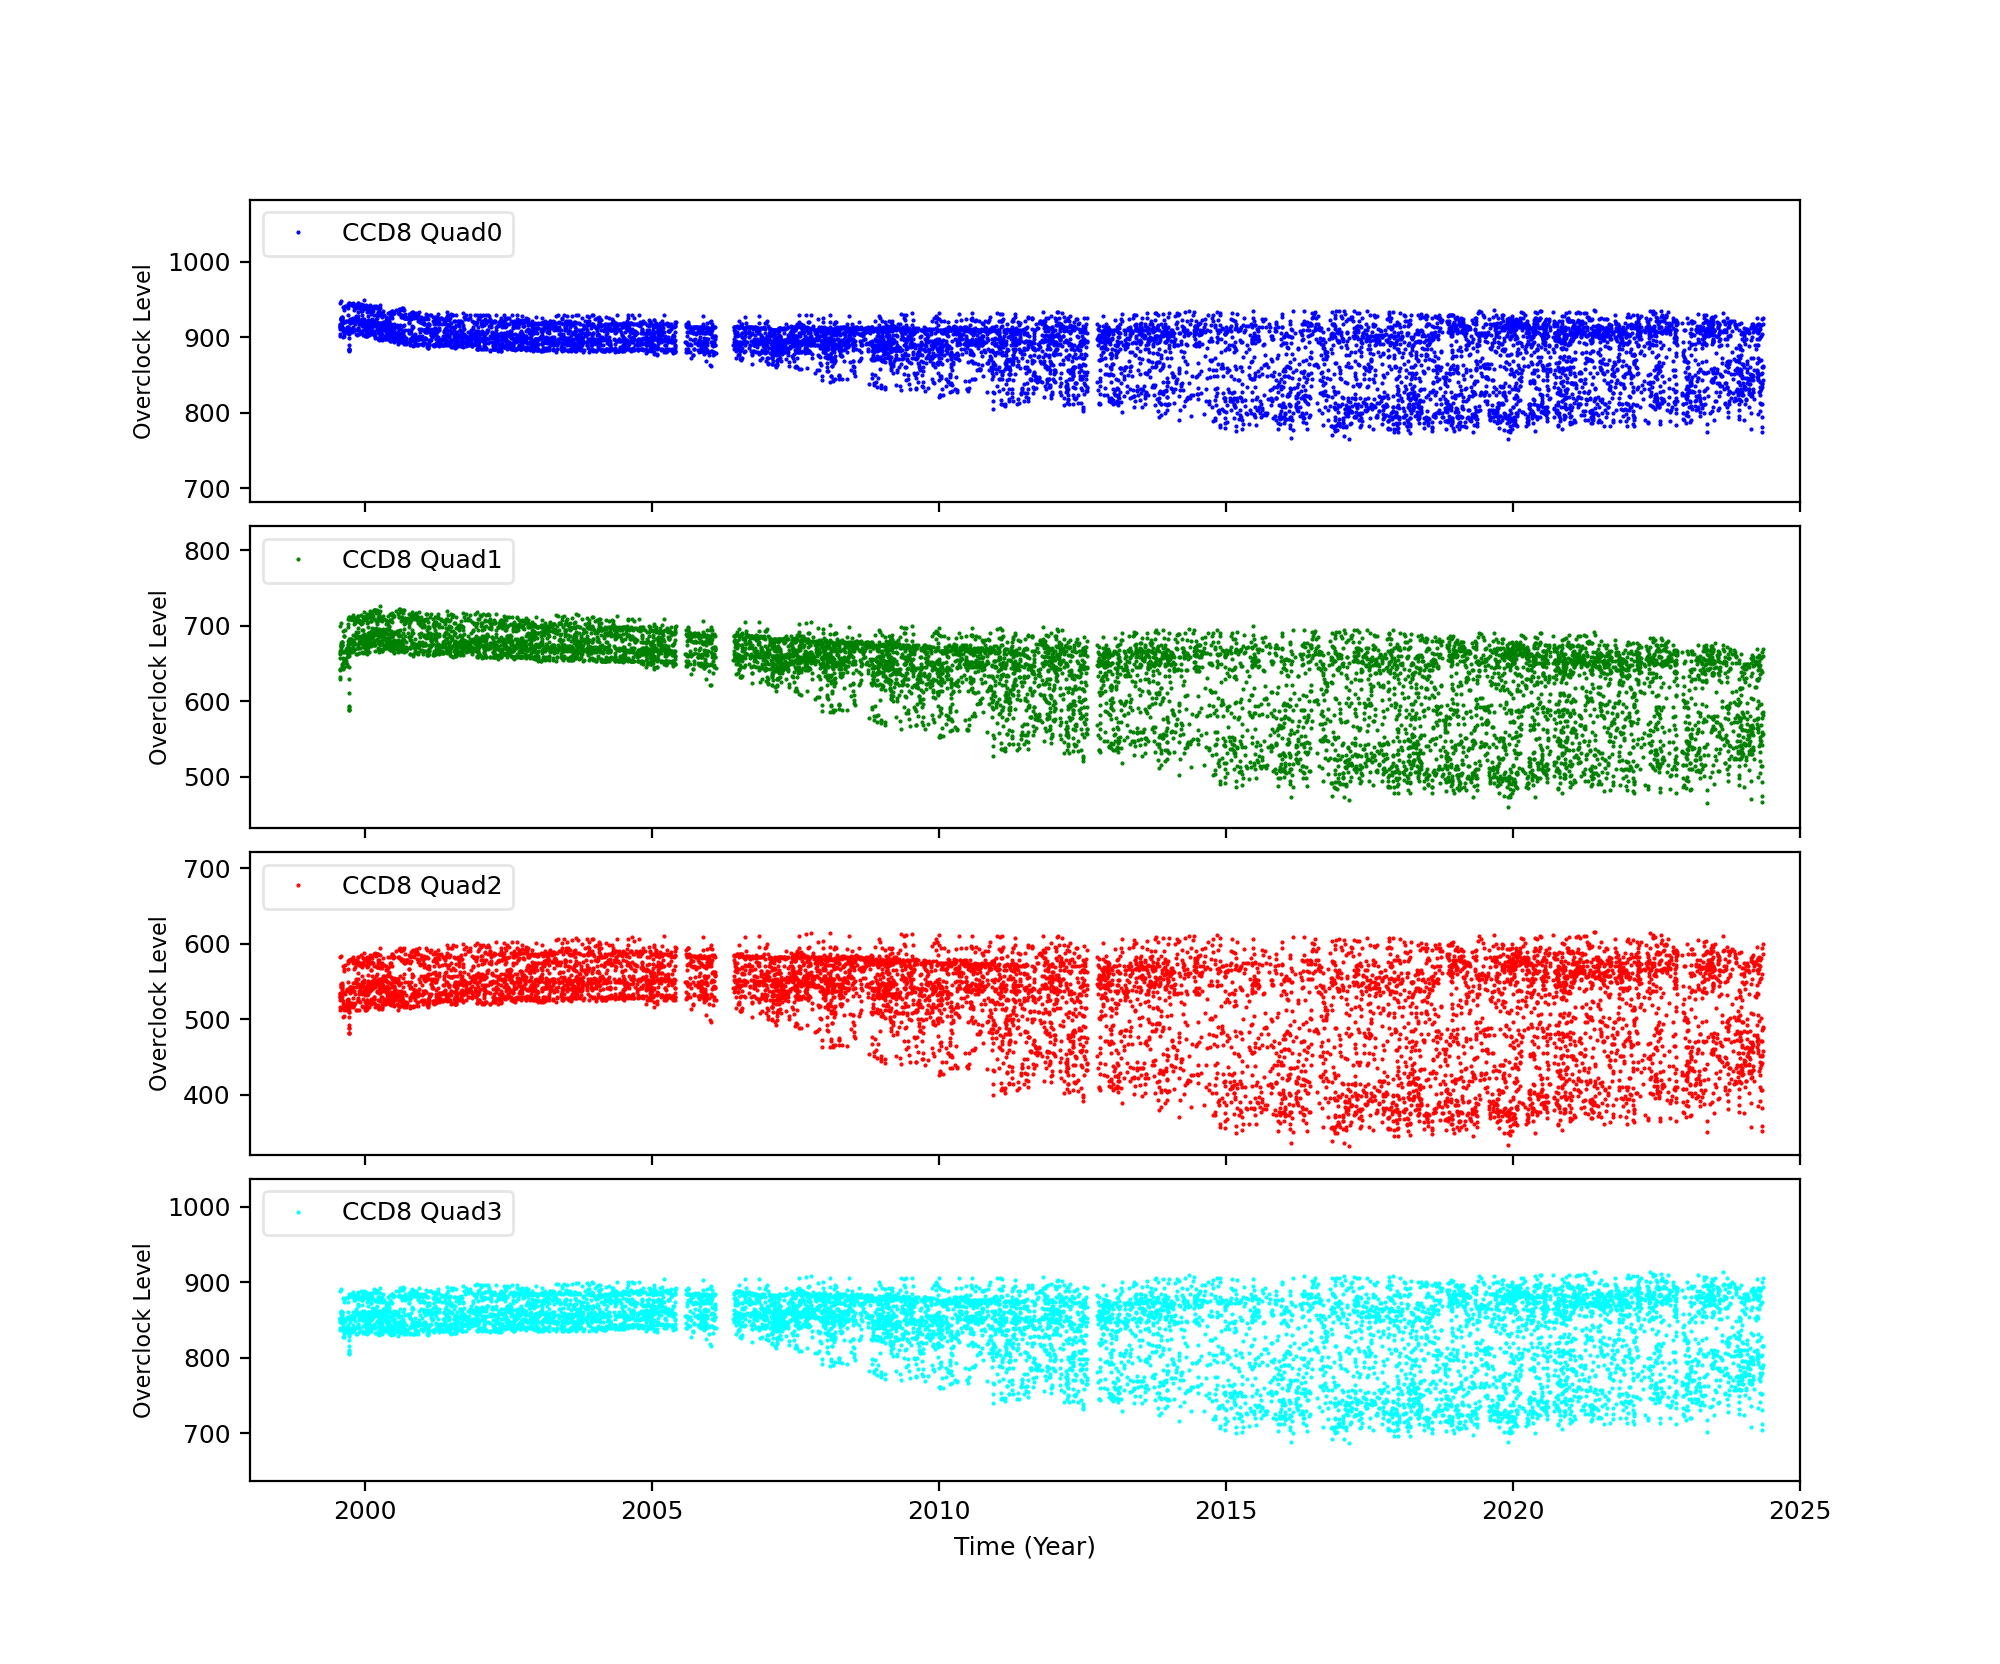
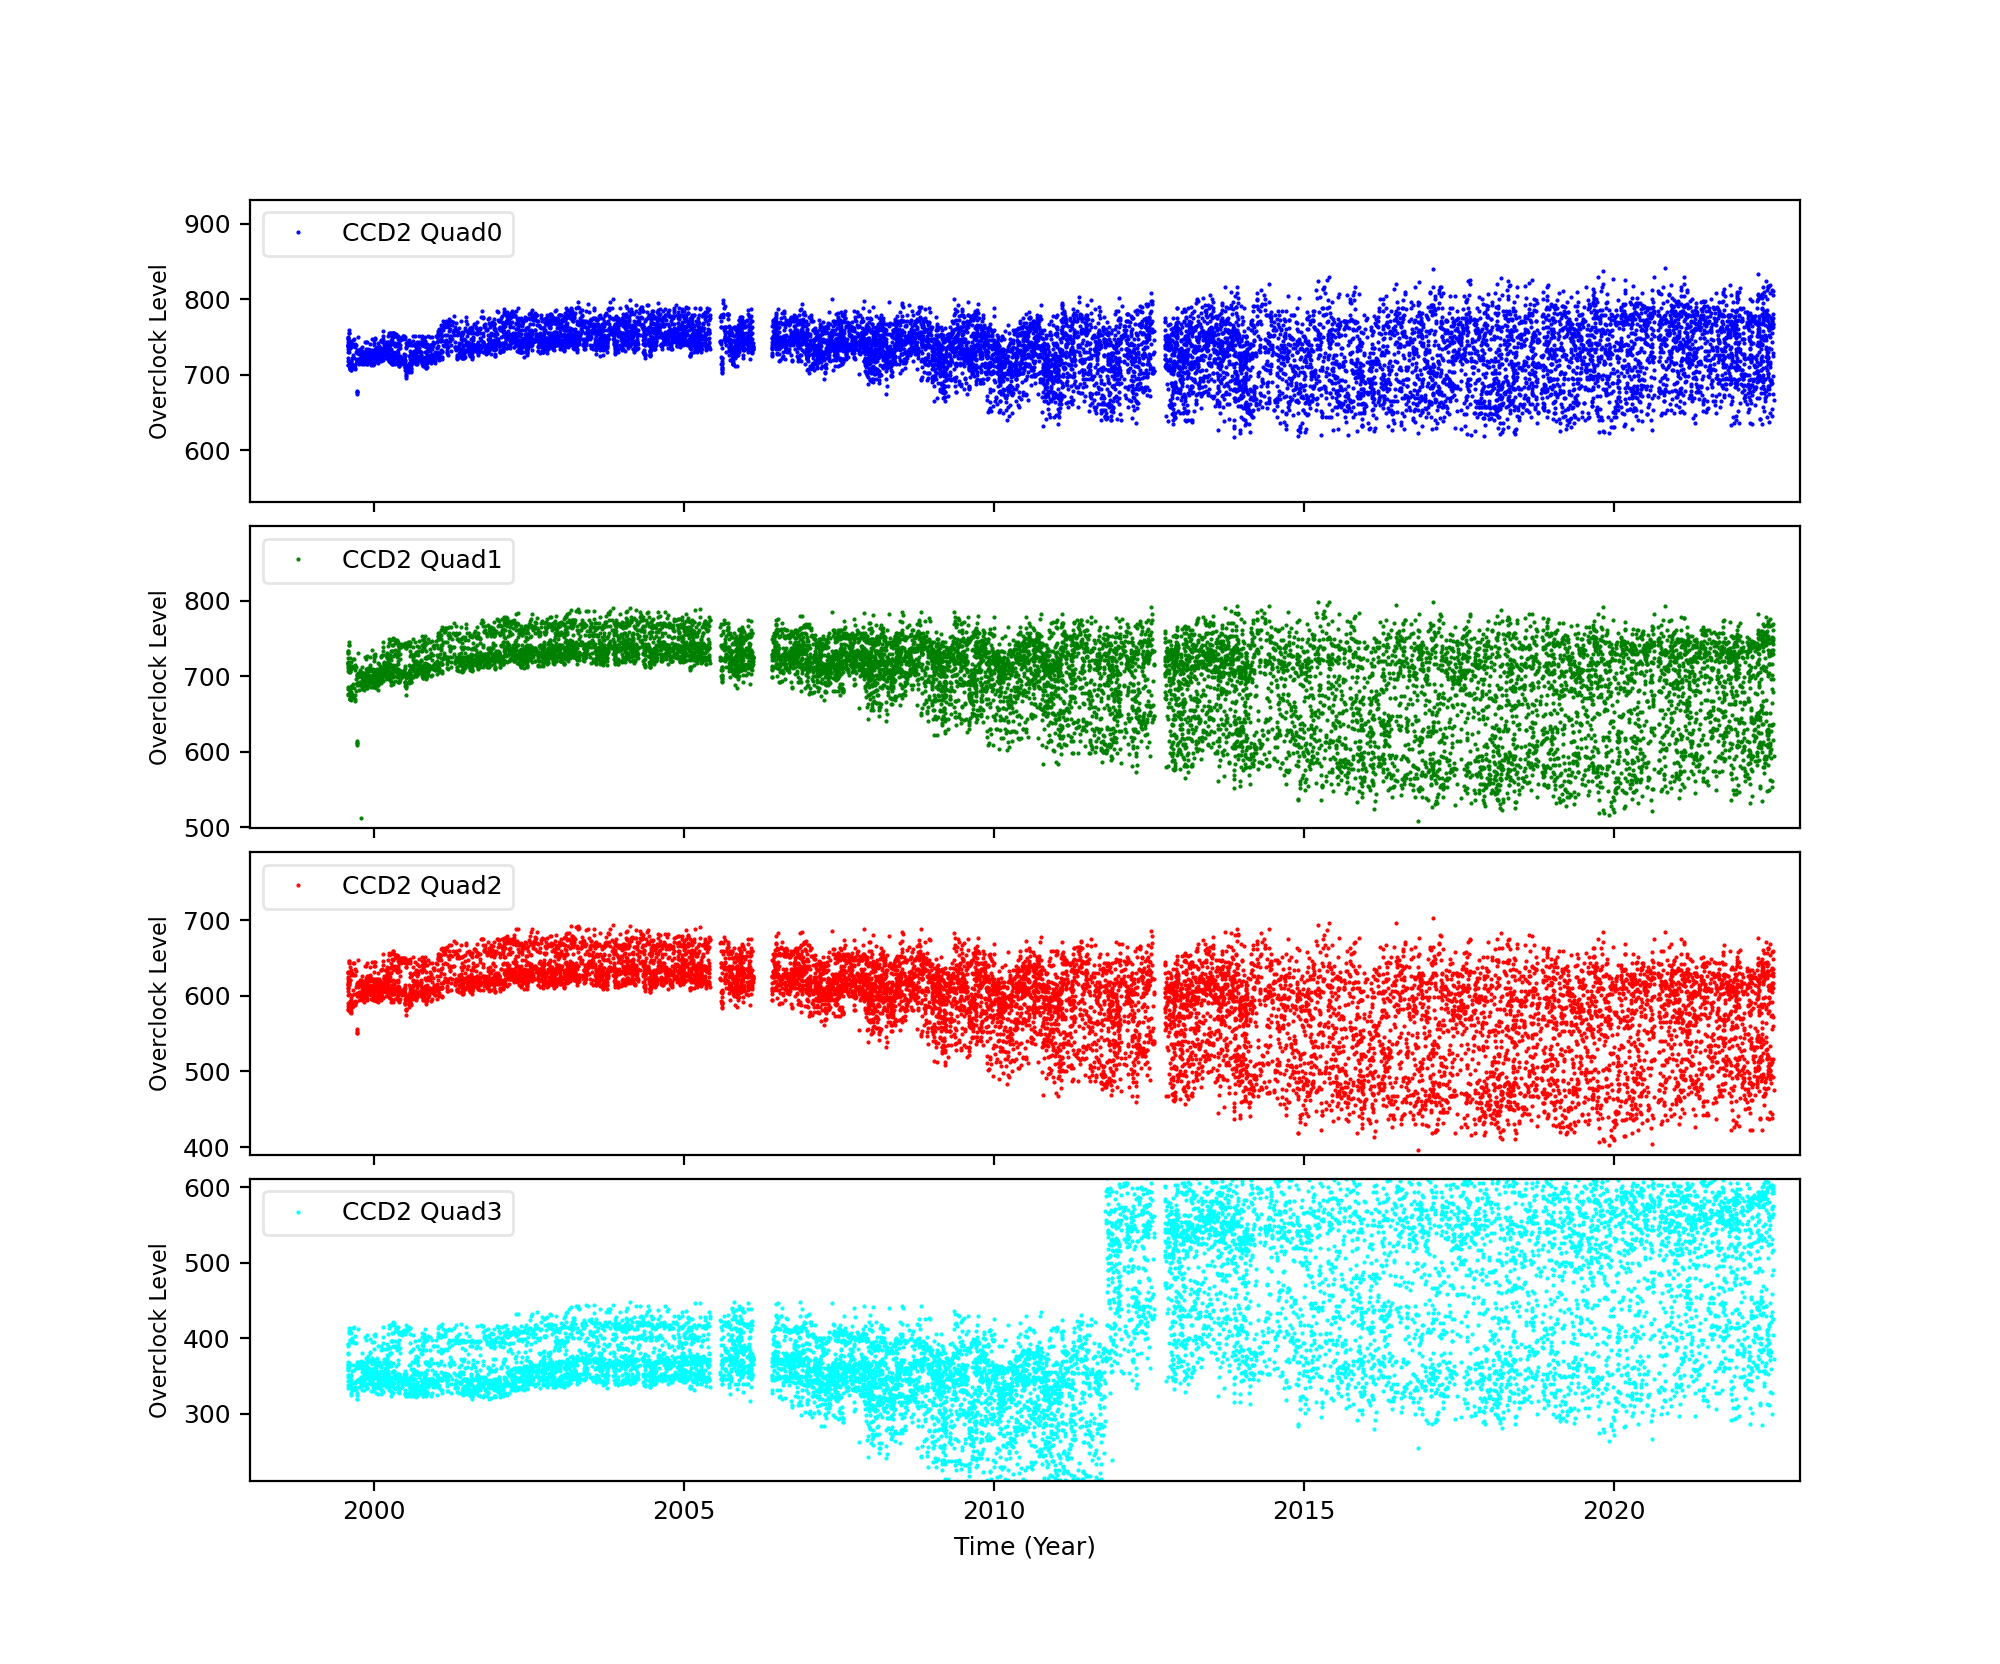
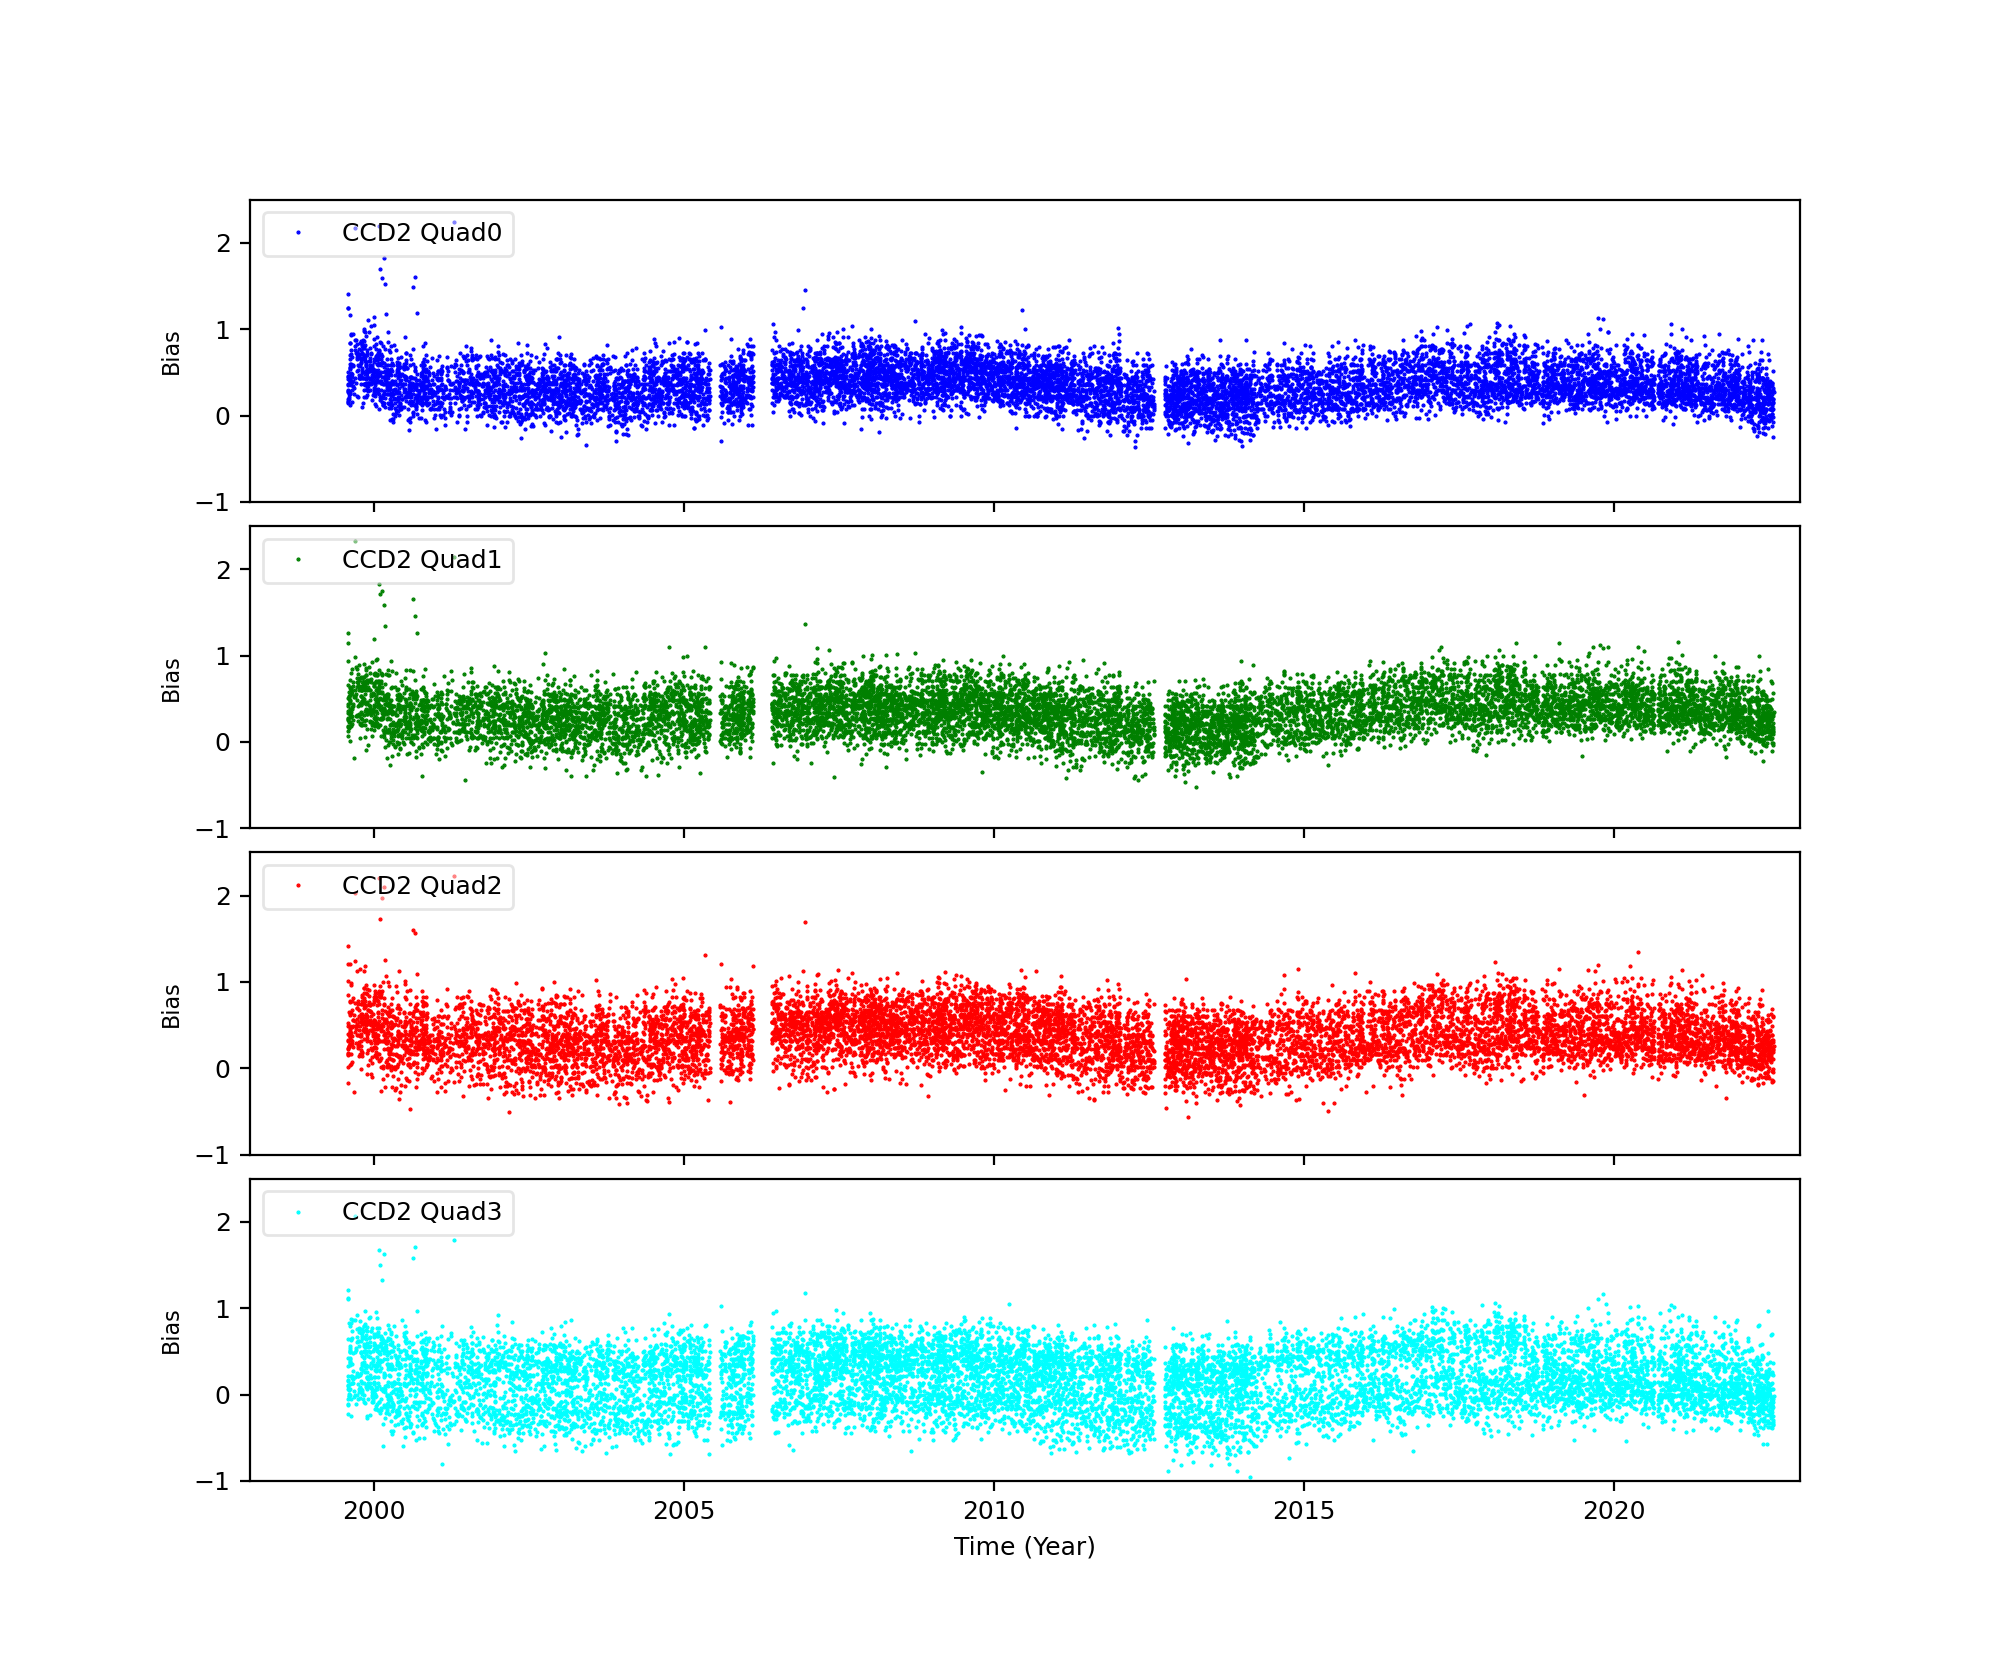
ACIS Bias Trends
The bias plus overclock level was calculated as follows:
- Get acisf*bias0.fits is obtained from a database or /dsops/ap/sdp/cache/*/acis/
- Data with timed mode exposure is selected.
- Fits files were divided into 4 quads, then an average of bias level for each quad is computed. No corrections for dead spots, columns etc were included.
An example of Overclock values as reported in FITS file header:
An example of mean bias minus overclock value:
HRC
DOSE of Central 4K Pore-Pairs
Please refer to Maximum Dose Trends for more details.
)
|
|---|
IMAGE                NPIX      MEAN    STDDEV      MIN       MAX
HRCI_07_2022.fits  16777216	0.025 	0.163 	0.000 	5.000
)
IMAGE                       NPIX      MEAN    STDDEV      MIN       MAX
HRCI_08_1999_07_2022.fits  16777216	na	na	na	na
No Data
)
IMAGE                       NPIX      MEAN    STDDEV      MIN       MAX
HRCS_08_1999_07_2022.fits  16777216	na	na	na	na
|
|
Max dose trend plots corrected for events that "pile-up"
in the center of the taps due to bad position information.
|
)
|
)
|
)
|
)
|
| Apr 2022 | Jan 2022 | Oct 2021 | Jul 2021 |
|---|
)
|
)
|
)
|
)
|
| Apr 2022 | Jan 2022 | Oct 2021 | Jul 2021 |
|---|
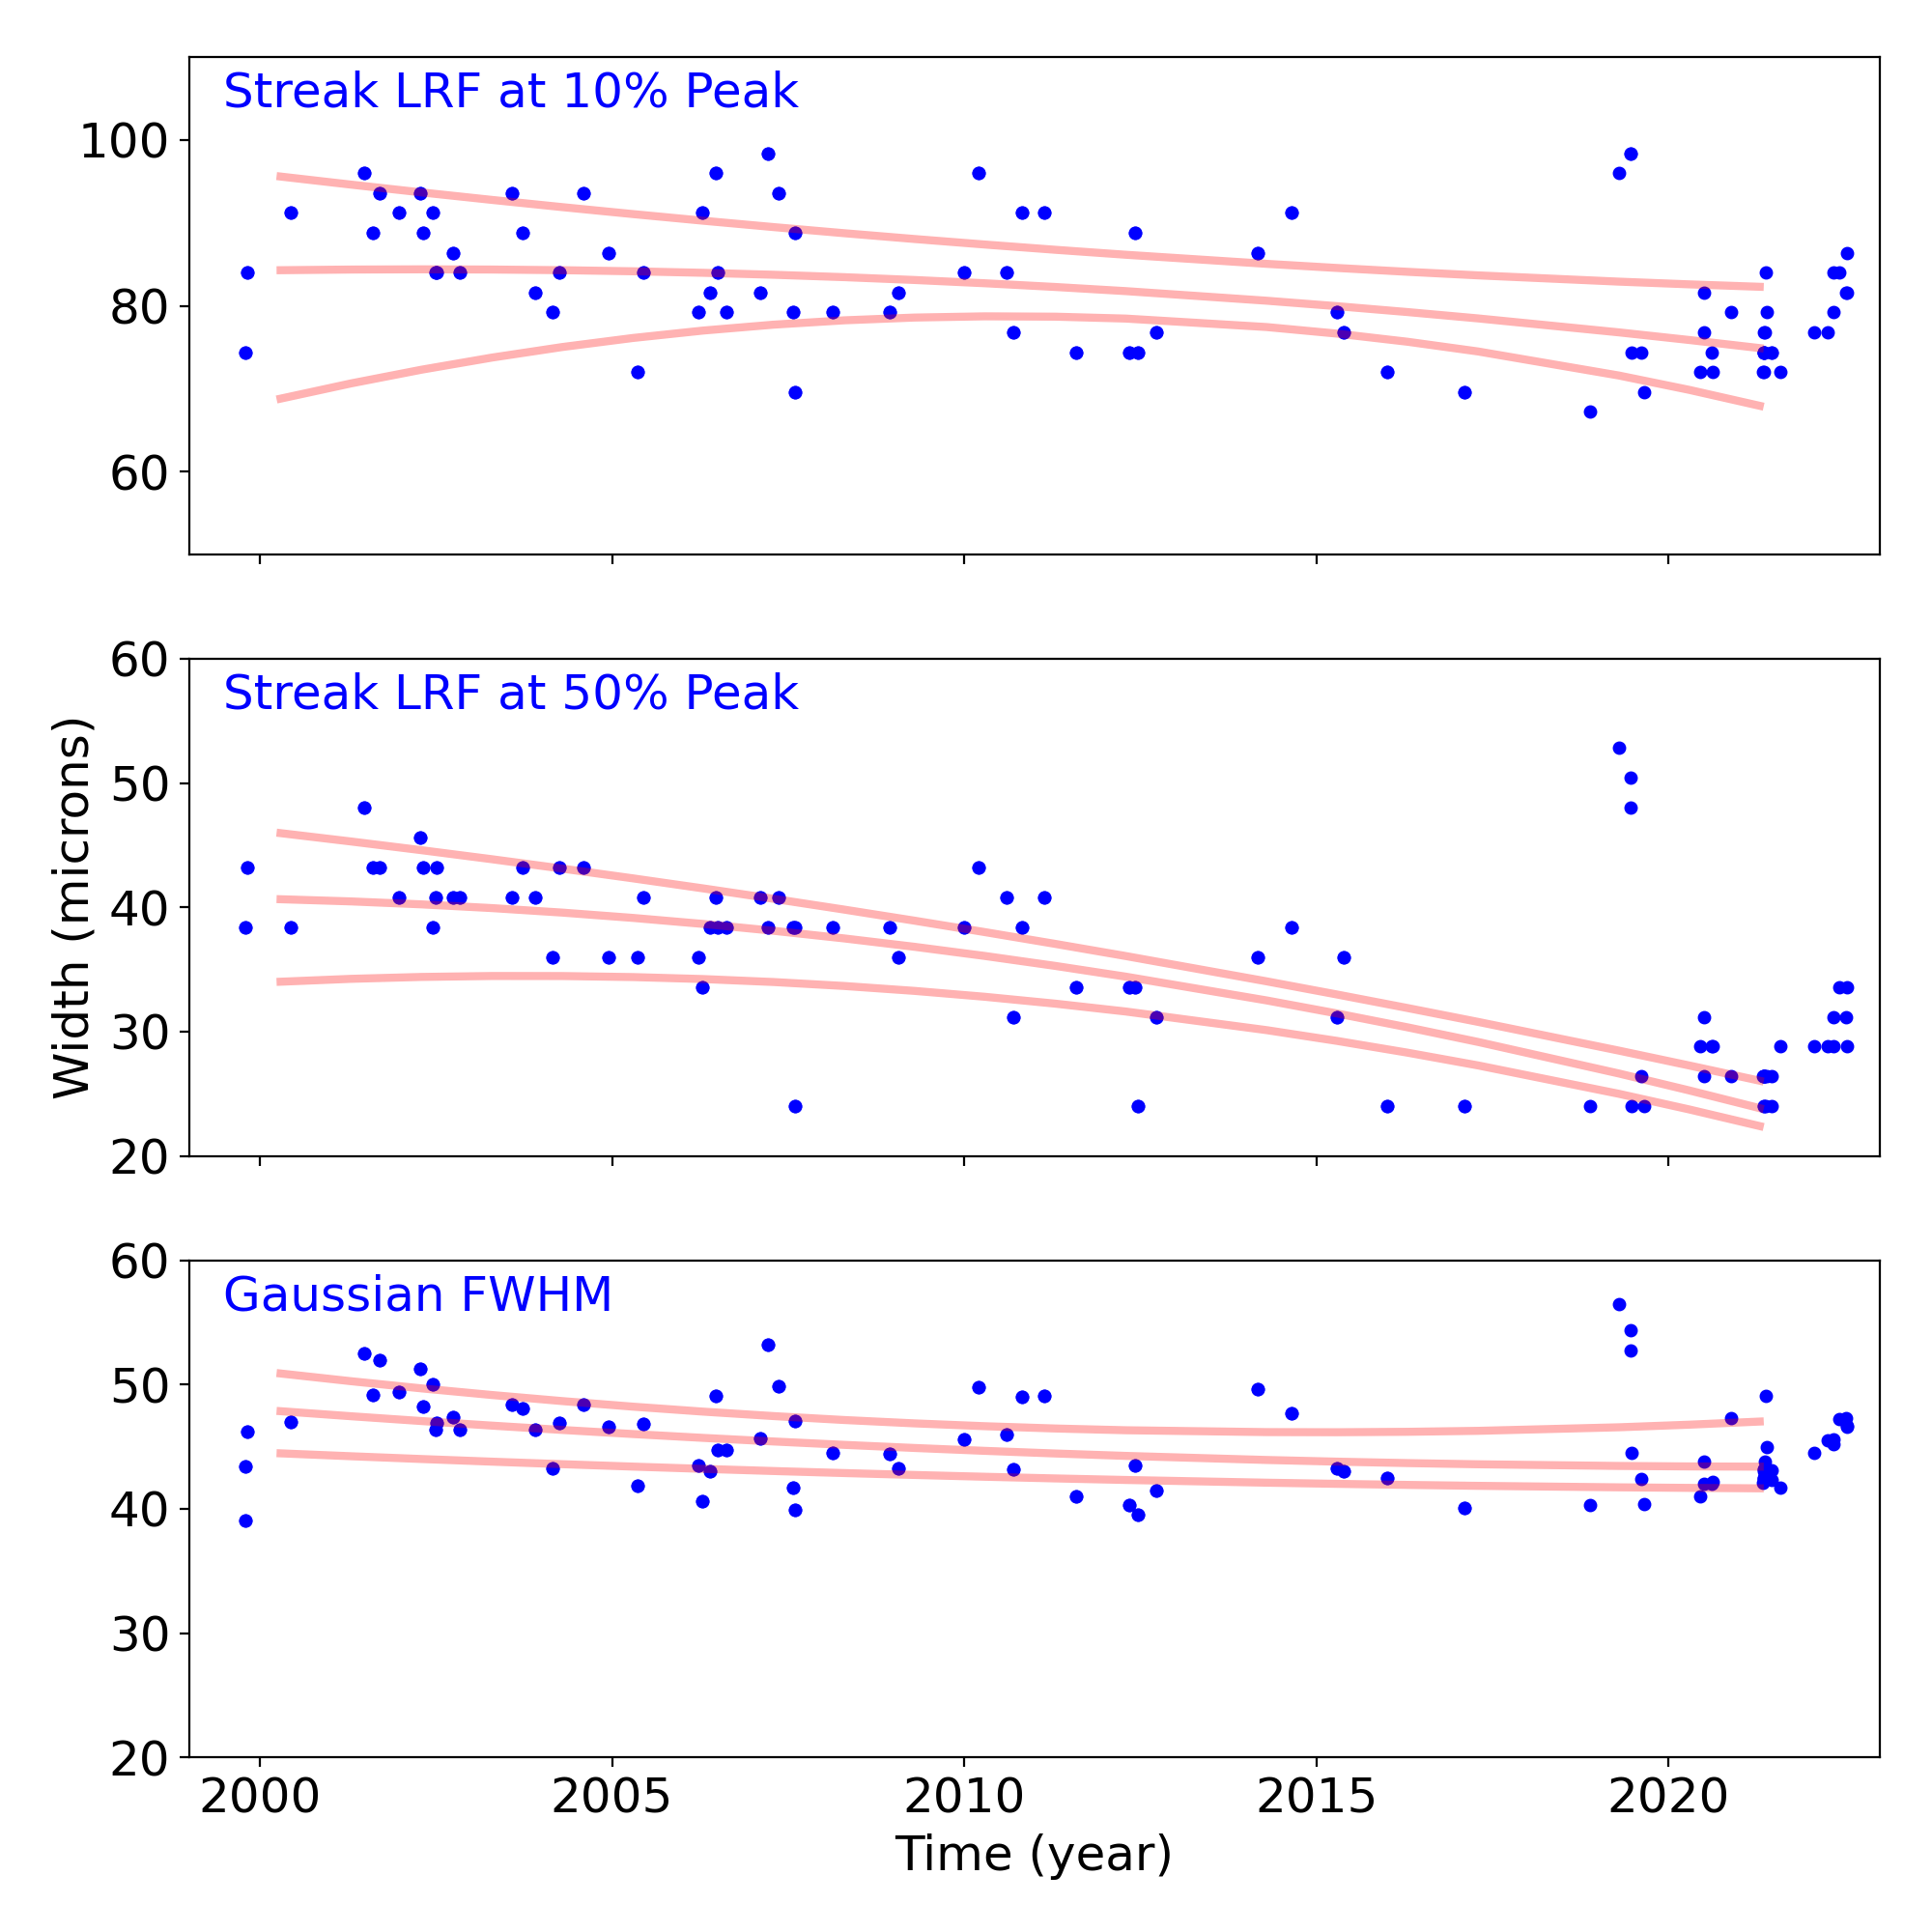
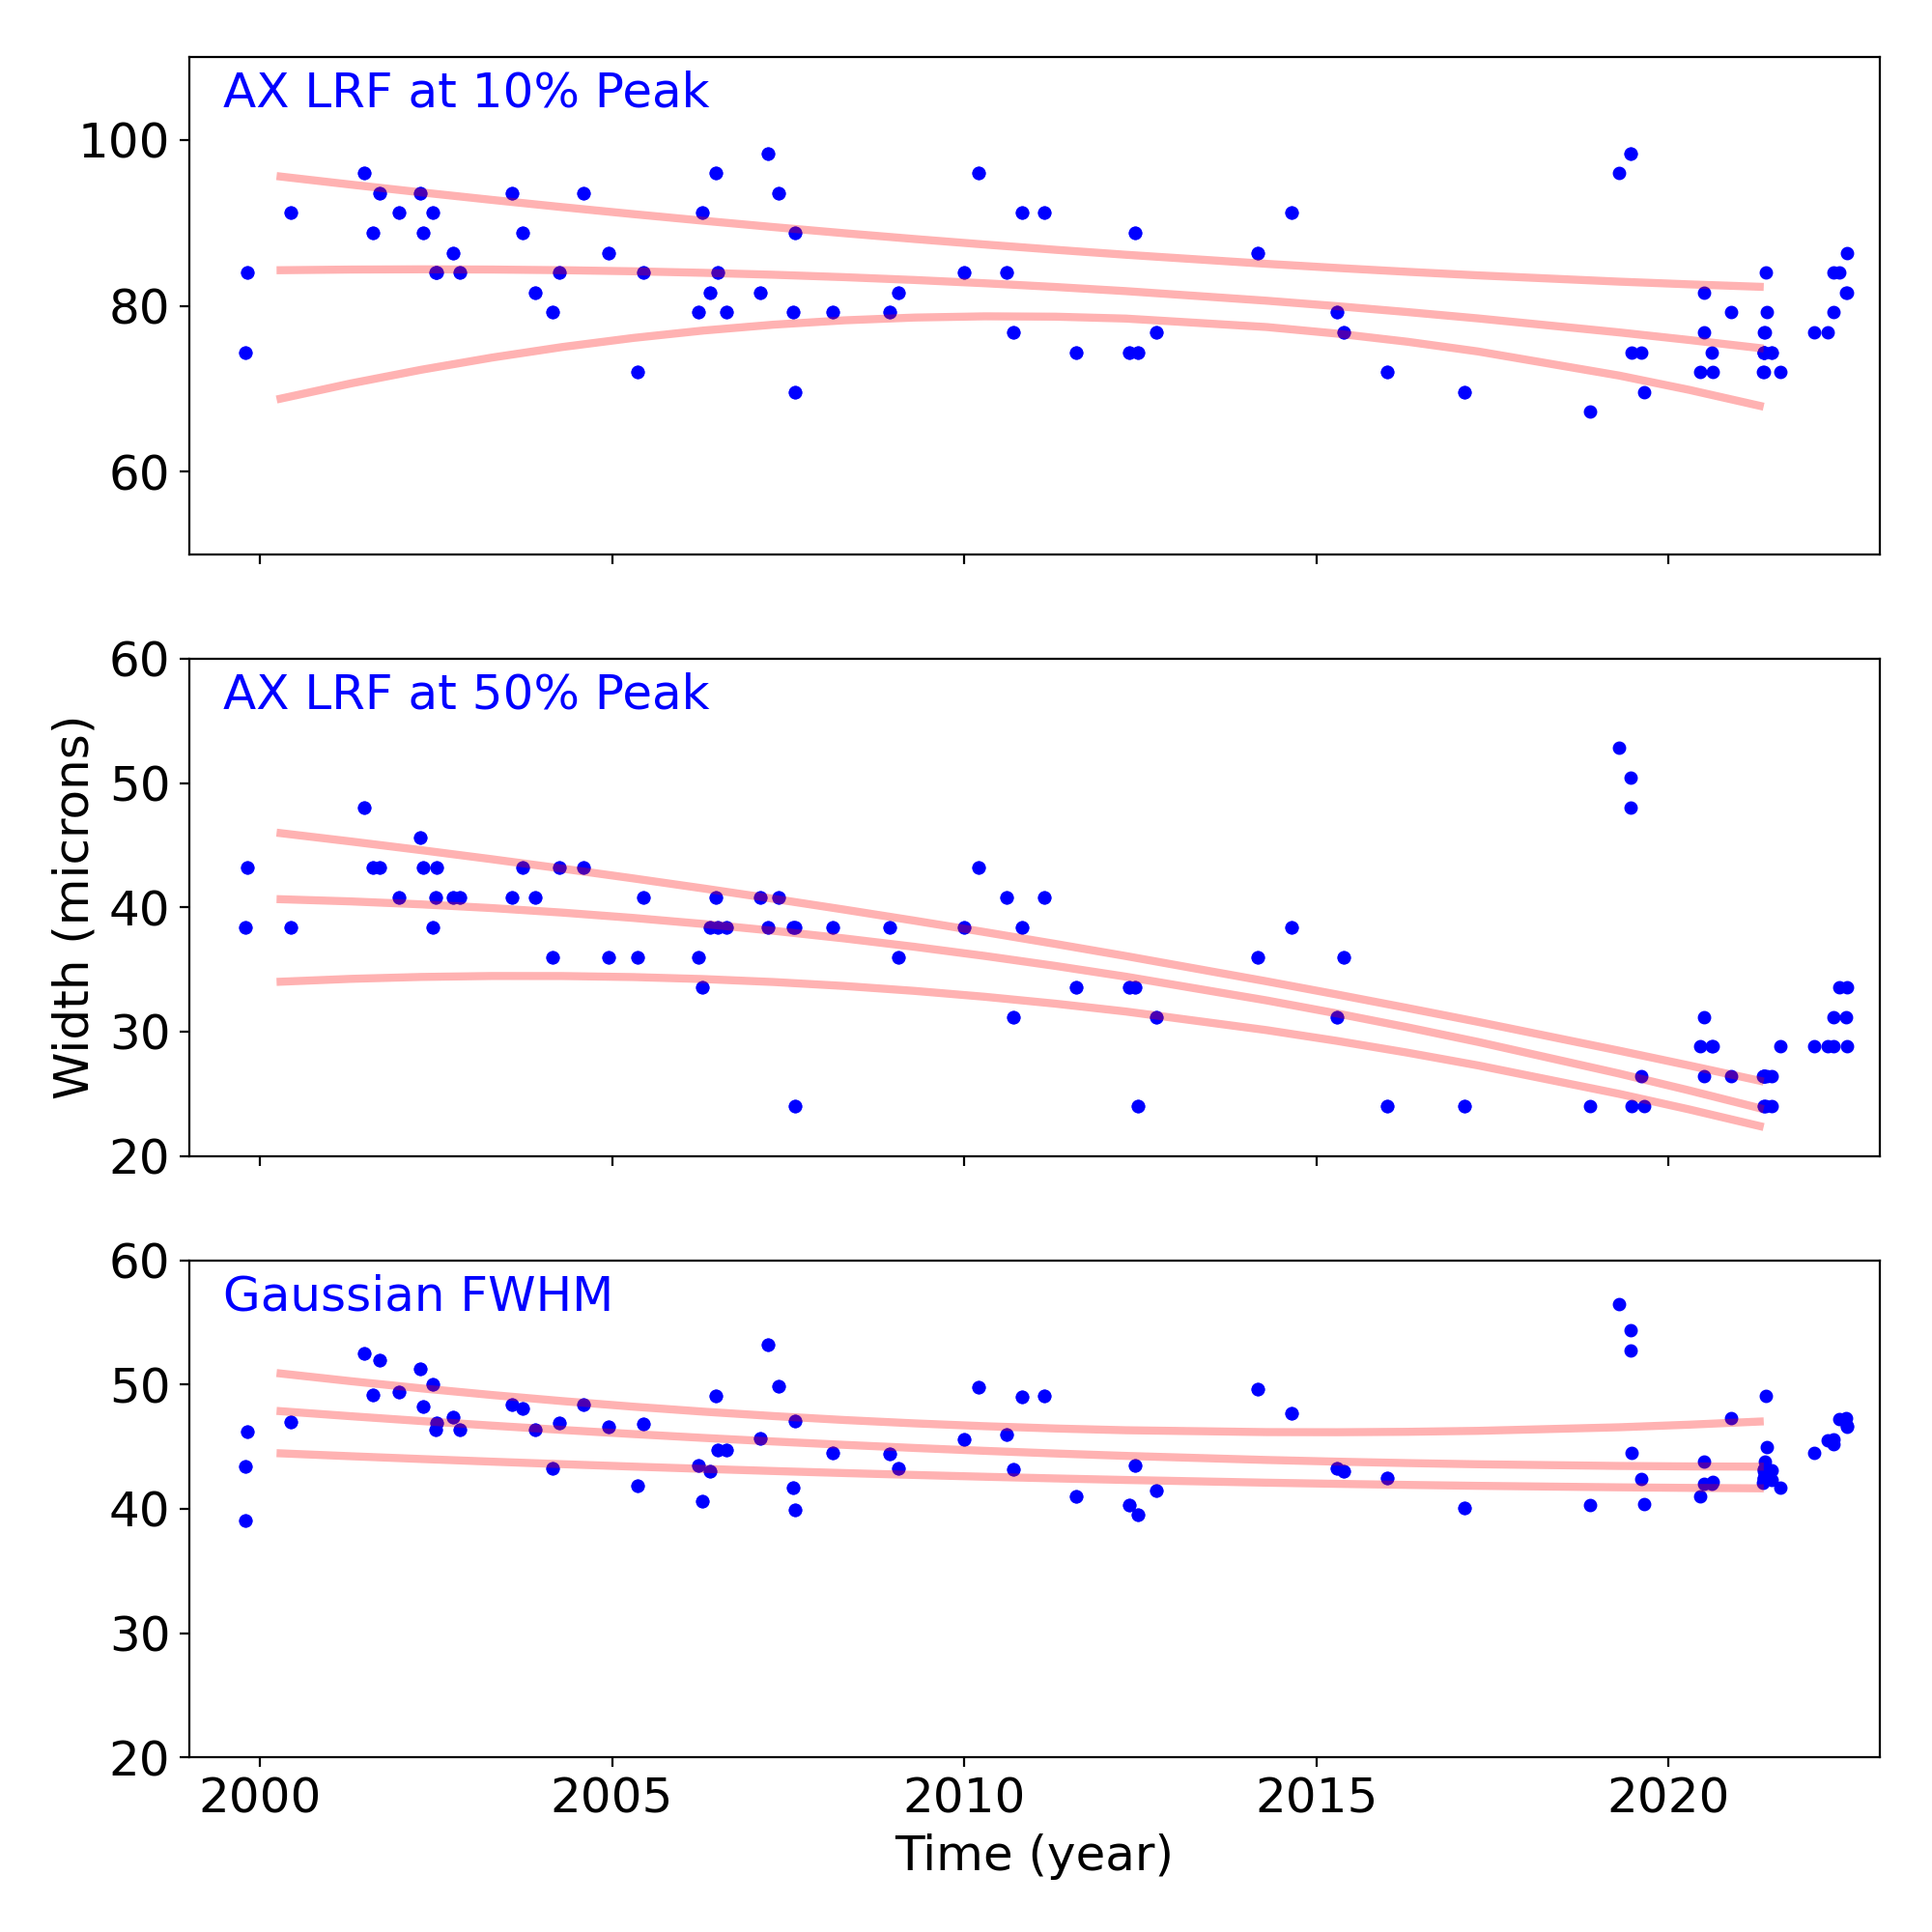
Gratings
Grating Trends/Focus
We plot the width of the zero order streak of ACIS/HETG observations and the width of the zero order image for HRC/LETG observations of point sources. No significant defocusing trend is seen at this time. See Gratings Trends pages.
PCAD
ACA Trending
| ACIS |
)
|
)
|
)
|
|
|---|---|---|---|---|
)
|
)
|
)
| ||
| HRCI |
)
|
)
|
)
|
)
|
| HRCI |
)
|
)
|
)
|
)
|
ACIS-1
ACIS-6
HRC-I-1
HRC-S-1
Gyro Bias Drift

Radiation History
Radiation Count Rates of Jul 2022
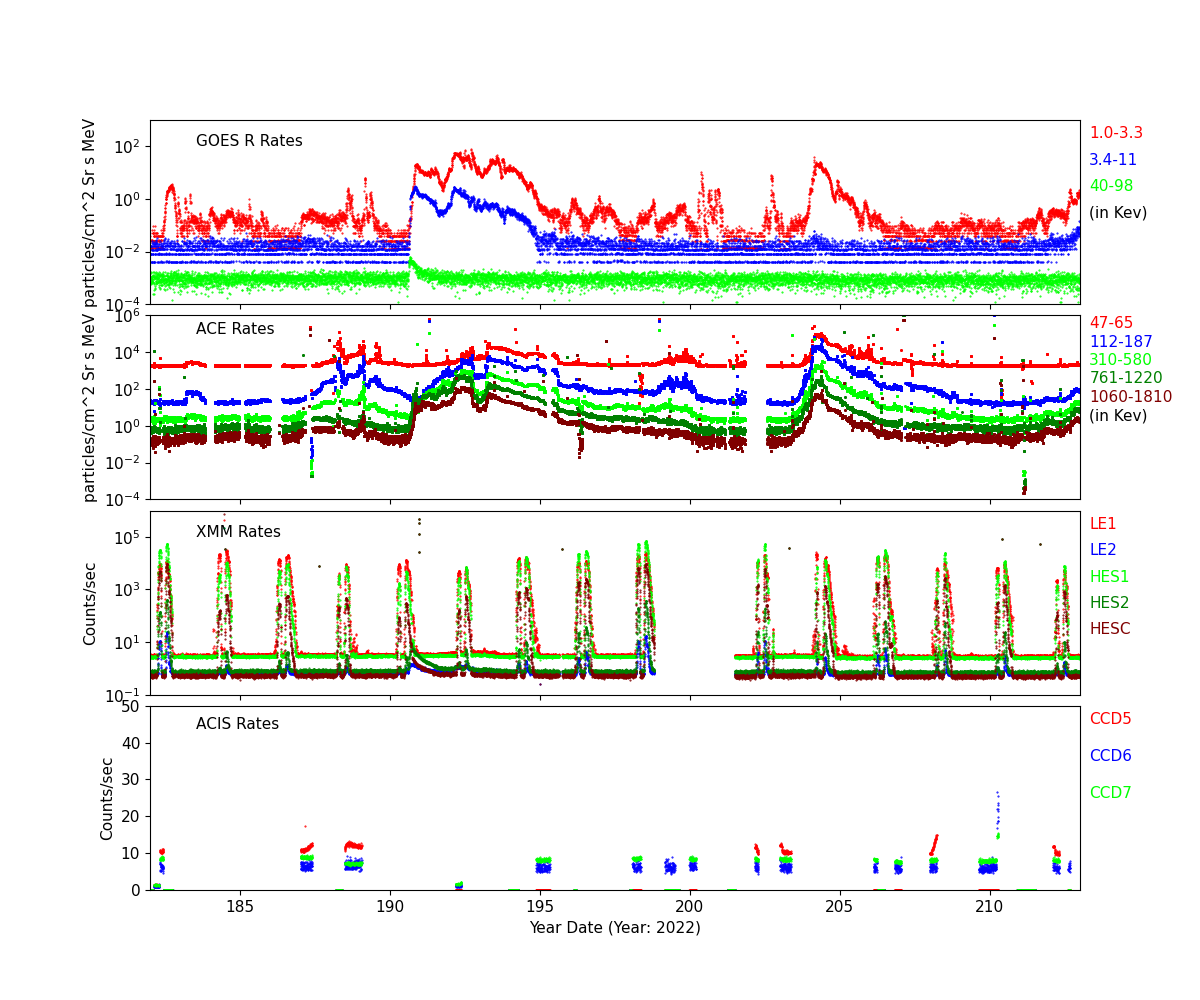
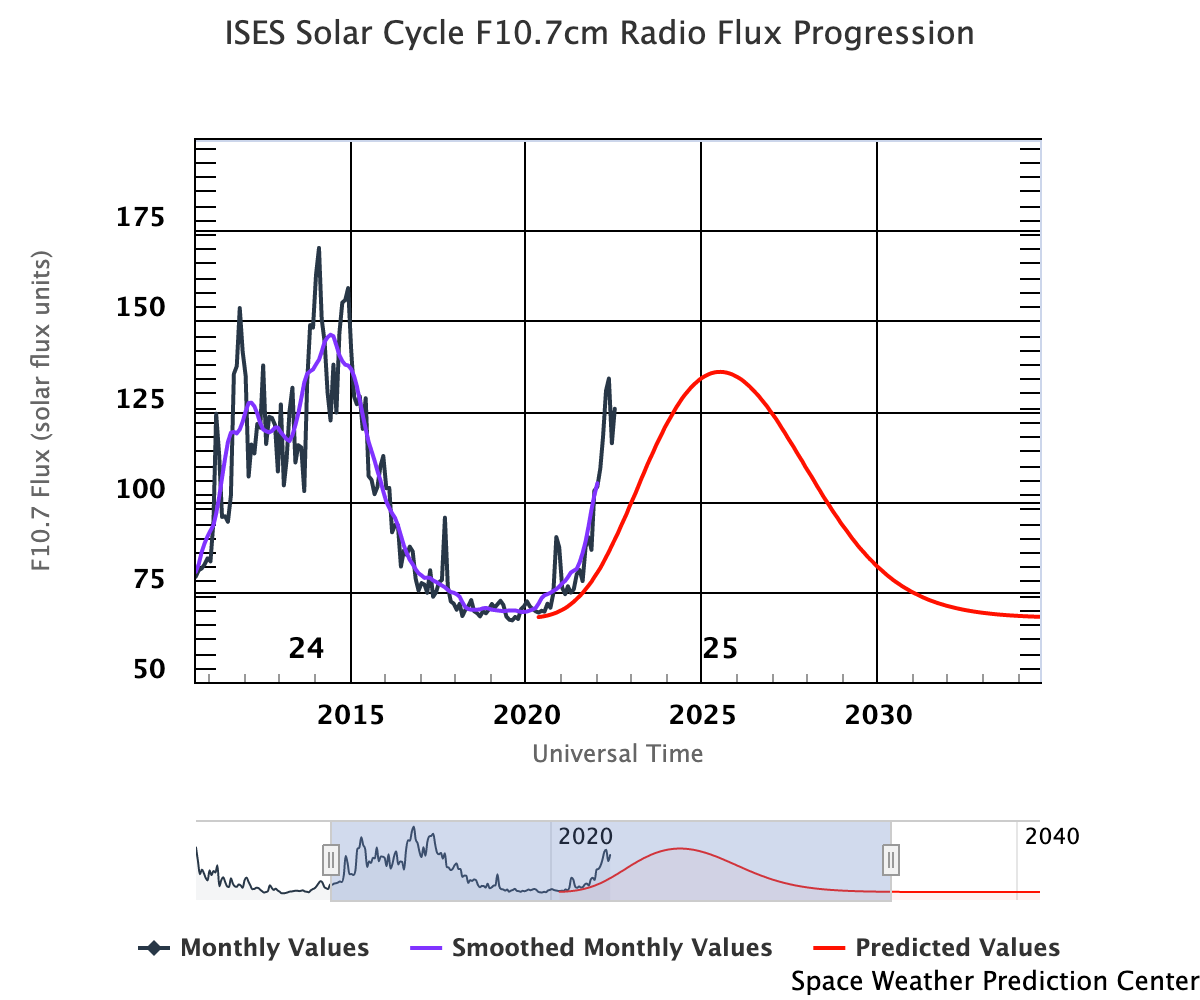
Sun Spot History (See:NOAA Page)
Trending
Quarterly Trends
- ACIS Temperature
| Previous Quarter | |||||||
| MSID | MEAN | RMS | DELTA/YR | DELTA/YR/YR | UNITS | DESCRIPTION | |
| 1cbat | 0.002 | 0.001 | (2.11+/-0.02)e2 | 1.13 +/- 0.59 | K | CAMERA BODY TEMP. A | |
|---|---|---|---|---|---|---|---|
| 1crat | -0.006 | 0.002 | (1.51+/-0.05)e2 | 1.07 +/- 1.05 | K | COLD RADIATOR TEMP. A | |
| 1crbt | -0.006 | 0.002 | (1.52+/-0.05)e2 | 0.87 +/- 1.04 | K | COLD RADIATOR TEMP. B | |
| 1dactbt | 0.007 | 0.002 | (2.61+/-0.04)e2 | -0.53 +/- 1.12 | K | DA COLLIMATOR TEMP. B | |
| 1deamzt | -0.007 | 0.003 | (2.90+/-0.07)e2 | -0.04 +/- 1.32 | K | DEA -Z PANEL TEMP | |
| 1dpamyt | 0.004 | 0.003 | (2.90+/-0.07)e2 | -0.51 +/- 1.31 | K | DPA -Y PANEL TEMP | |
| 1dpamzt | 0.002 | 0.003 | (2.93+/-0.07)e2 | -0.32 +/- 1.27 | K | DPA -Z PANEL TEMP | |
| 1oahat | 0.004 | 0.001 | (2.48+/-0.03)e2 | -0.13 +/- 0.82 | K | OPEN ACTUATOR HOUSING TEMP. A | |
| 1oahbt | 0.005 | 0.001 | (2.44+/-0.03)e2 | 0.03 +/- 0.73 | K | OPEN ACTUATOR HOUSING TEMP. B | |
| 1pdeaat | 0.012 | 0.003 | (3.02+/-0.06)e2 | -1.04 +/- 2.03 | K | PSMC DEA PS A TEMP | |
| 1pdeabt | 0.008 | 0.003 | (2.94+/-0.06)e2 | -0.79 +/- 1.95 | K | PSMC DEA PS B TEMP | |
| 1wrat | -0.001 | 0.001 | (1.94+/-0.03)e2 | 0.64 +/- 0.57 | K | WARM RADIATOR TEMP. A | |
| 1wrbt | -0.002 | 0.001 | (1.93+/-0.03)e2 | 0.85 +/- 0.58 | K | WARM RADIATOR TEMP. B | |
- ACIS Electronics Side B
| Previous Quarter | |||||||
| MSID | MEAN | RMS | DELTA/YR | DELTA/YR/YR | UNITS | DESCRIPTION | |
| 1dahbcu | 0.000e+00 | 0.000e+00 | (0.00+/-0.00)e0 | (0.00+/-0.00)e0 | AMP | DA HEATER CURRENT B | |
|---|---|---|---|---|---|---|---|
| 1dahbvo | 0.000e+00 | 0.000e+00 | (0.00+/-0.00)e0 | (0.00+/-0.00)e0 | V | DA HEATER VOLTAGE B | |
| 1dahhbvo | 0.000e+00 | 0.000e+00 | (0.00+/-0.00)e0 | (0.00+/-0.00)e0 | V | DA HOUSING HEATER INPUT | |
| 1de28bvo | 0.002 | 7.762e-05 | 27.71 +/- 0.21 | -0.04 +/- 0.03 | V | DEA +28V INPUT B | |
| 1deicbcu | 0.000e+00 | 0.000e+00 | (0.00+/-0.00)e0 | (0.00+/-0.00)e0 | AMP | DEA INPUT CURRENT B | |
| 1den0bvo | -3.554e-05 | 7.948e-06 | -0.15 +/- 0.02 | 0.00 +/- 0.00 | V | DEA -6V VOLTAGE B | |
| 1den1bvo | -9.589e-05 | 2.145e-05 | -0.32 +/- 0.05 | 0.01 +/- 0.01 | V | DEA -15V VOLTAGE B | |
| 1dep0bvo | 4.154e-05 | 8.769e-06 | 0.05 +/- 0.02 | -0.00 +/- 0.01 | V | DEA +6V VOLTAGE B | |
| 1dep1bvo | 9.903e-05 | 2.154e-05 | 0.13 +/- 0.05 | -0.01 +/- 0.01 | V | DEA +15V ANALOG B | |
| 1dep2bvo | 1.597e-04 | 3.368e-05 | 0.20 +/- 0.08 | -0.01 +/- 0.02 | V | DEA +24V ANALOG B | |
| 1dep3bvo | 1.915e-04 | 4.039e-05 | 0.25 +/- 0.10 | -0.02 +/- 0.02 | V | DEA +28V ANALOG B | |
| 1dp28bvo | 0.002 | 7.528e-05 | 27.73 +/- 0.20 | -0.03 +/- 0.03 | V | DPA +28V INPUT B | |
| 1dpicbcu | 6.020e-04 | 1.518e-04 | 0.85 +/- 0.36 | -0.05 +/- 0.08 | AMP | DPA INPUT CURRENT B | |
| 1dpp0bvo | 9.764e-05 | 2.138e-05 | 5.21 +/- 0.05 | -0.01 +/- 0.01 | V | DPA +5V ANALOG B | |
- EPHIN Temperature and Voltage
| Previous Quarter | |||||||
| MSID | MEAN | RMS | DELTA/YR | DELTA/YR/YR | UNITS | DESCRIPTION | |
| 5eiot | 0.011 | 0.010 | (3.28+/-0.23)e2 | 2.42 +/- 4.39 | K | EIO TEMP | |
|---|---|---|---|---|---|---|---|
| 5ephint | -0.022 | 0.004 | (3.35+/-0.09)e2 | 1.77 +/- 2.79 | K | EPHIN TEMP | |
| teio | 0.012 | 0.010 | (3.27+/-0.22)e2 | 1.51 +/- 4.26 | K | EPHIN ELECTRONICS HOUSING TEMP | |
| tephin | -0.019 | 0.004 | (3.35+/-0.09)e2 | 1.03 +/- 2.77 | K | EPHIN SENSOR HOUSING TEMP | |
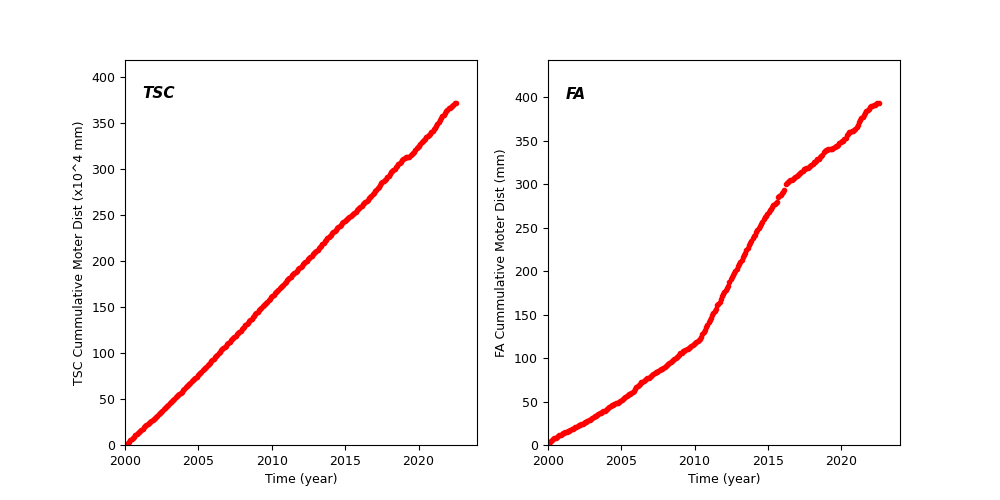
Spacecraft Motions
TSC and FA Cummulative Moter Distance
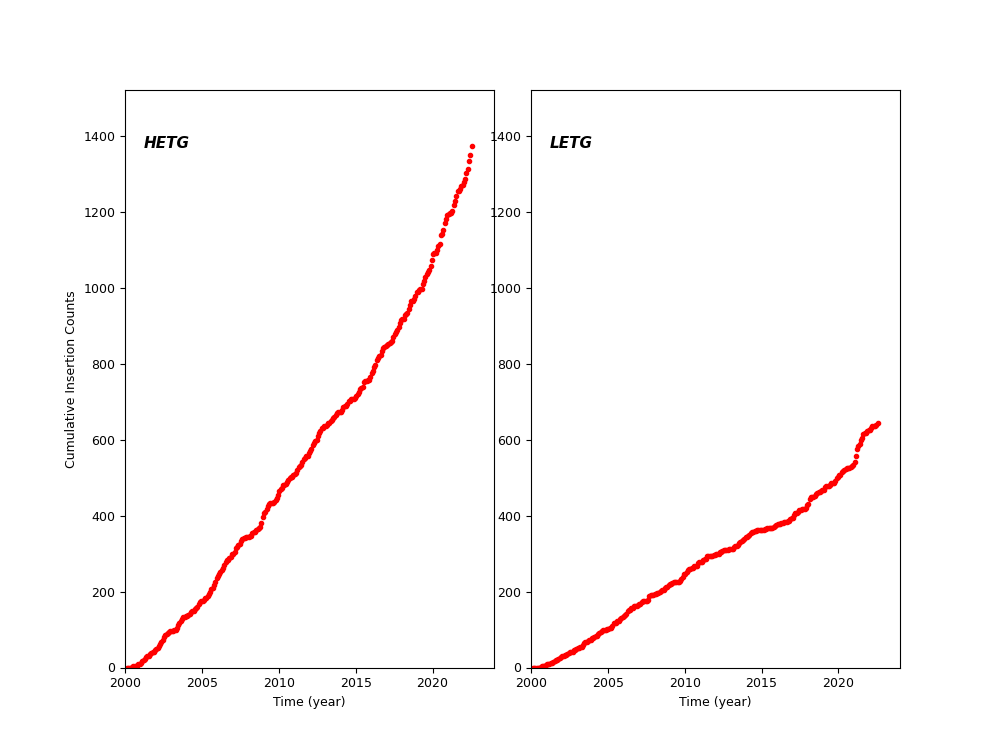
HETG and LETG Cummulative Insertion Counts
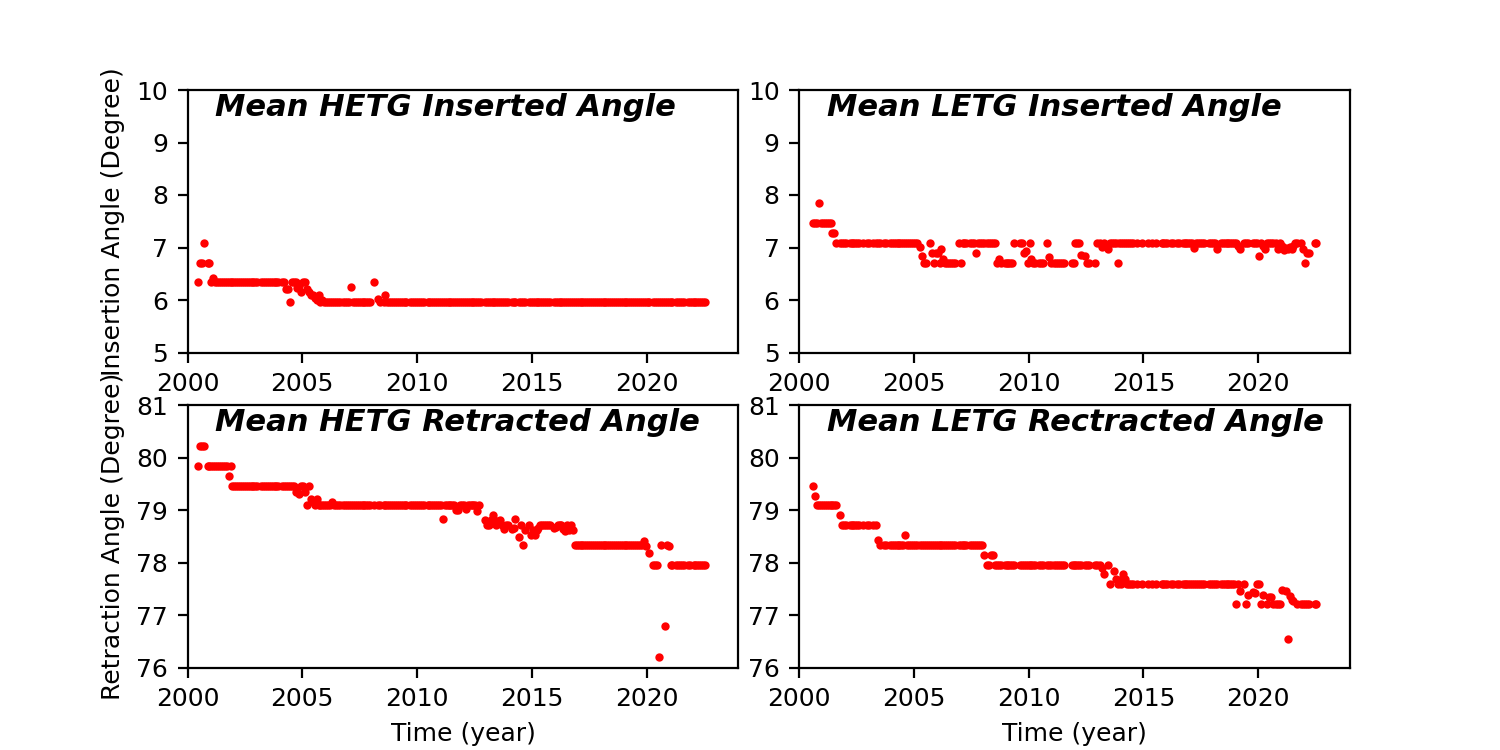
HETG/LETG Insertion/Retraction Angle
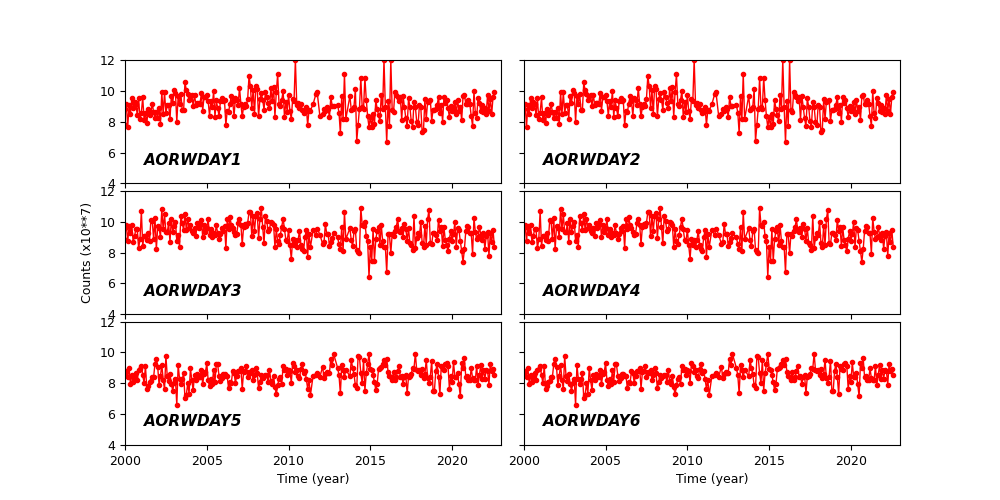
Reaction Wheel Rotations