ACIS
ACIS DOSE Registered-Photon-Map
The steps we took to compute the dose map are;
- Level 1 Event files for a specified month are obtained from archive.
- Image data including I2, I3, S2, S3 CCDs are extracted from all event files.
- All the extracted image data were merged to create a month long exposure map for the month.
- The exposure map is opened with ds9, and check a distribution of count rates against energy. From this, estimate the upper threshold value. Any events beyond this upper threshold are assumed erroneous events such as bad pixels.
- Using this upper threshold, the data is filtered, and create a cleaned exposure map for the month.
- The exposure map from each month from the Sep 1999 is added up to create a cumulative exposure map for each month.
- Using fimgstatistic, we compute count rate statistics for each CCDs.
- For observations with high data drop rates (e.g., Crab nebula, Cas A), we corrected the observations by adding events.
Please check more detail plots at Telemetered Photon Dose Trend page.
)
)
)
Statistics:
# IMAGE     NPIX     MEAN        RMS        MIN     MAX
ACIS_aug22 6004901       6.605         11.454           0.0     6521


I2 node 0  262654	8.546741	3.734568	0.0	 69.0
I2 node 1  262654	8.870795	4.576211	0.0	1247.0
I2 node 2  262654	8.653544	3.696167	0.0	121.0
I2 node 3  262654	8.869090	16.088162	0.0	5376.0

I3 node 0  262654	9.509031	4.045981	0.0	118.0
I3 node 1  262654	8.812190	3.741033	0.0	139.0
I3 node 2  262654	8.709688	3.580085	0.0	 78.0
I3 node 3  262654	9.046298	9.290971	0.0	4349.0

S2 node 0  262654	5.922710	14.193343	0.0	4139.0
S2 node 1  262654	6.128451	3.539983	0.0	225.0
S2 node 2  262654	6.939790	25.372770	0.0	6521.0
S2 node 3  262654	6.699926	10.730267	0.0	4657.0

S3 node 0  262654	10.468765	8.082608	0.0	156.0
S3 node 1  262654	11.920437	8.449919	0.0	177.0
S3 node 2  262654	12.036585	7.864490	0.0	1488.0
S3 node 3  262654	9.957699	4.365316	0.0	 66.0
)
)
)
Statistics:
 IMAGE     NPIX      MEAN        RMS           MIN      MAX
ACIS_total   6004901       2587.363         3313.771           0.0   142267


I2 node 0  262654	2244.701046	452.234500	478.0	13746.0
I2 node 1  262654	2361.754170	646.632887	497.0	136530.0
I2 node 2  262654	2390.512625	505.913373	517.0	14421.0
I2 node 3  262654	2396.484698	618.761997	485.0	28890.0

I3 node 0  262654	2574.962309	633.588022	482.0	13898.0
I3 node 1  262654	2655.862318	1738.793930	510.0	55863.0
I3 node 2  262654	2369.420441	445.175241	480.0	14134.0
I3 node 3  262654	2354.661158	476.717671	447.0	34953.0

S2 node 0  262654	3013.593961	489.239274	1634.0	22390.0
S2 node 1  262654	3194.657839	726.323633	1821.0	17259.0
S2 node 2  262654	3534.454856	728.718153	2236.0	30397.0
S2 node 3  262654	3496.967292	584.126704	1972.0	73247.0

S3 node 0  262654	5361.549330	2933.817119	2353.0	54169.0
S3 node 1  262654	6564.784267	2365.137390	0.0	47483.0
S3 node 2  262654	5295.079607	1342.313176	2435.0	27276.0
S3 node 3  262654	4148.068375	759.309900	2501.0	26484.0
)
|
)
|
)
|
)
|
| May 2022 | Feb 2022 | Nov 2021 | Aug 2021 |
|---|
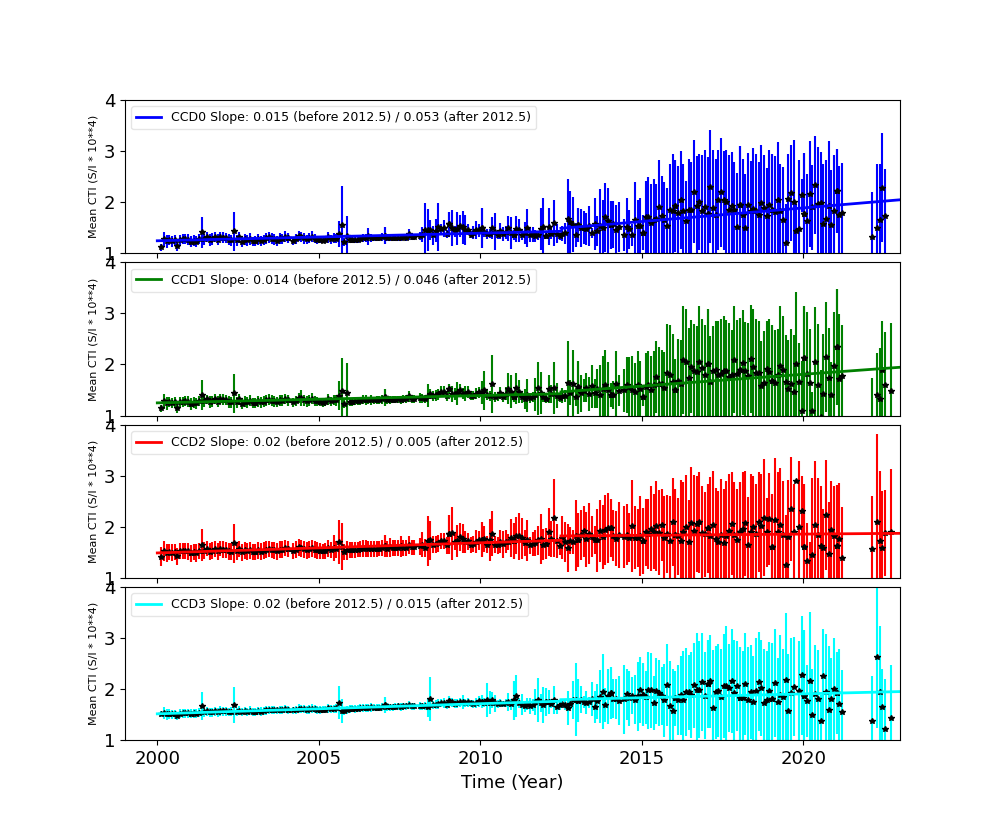
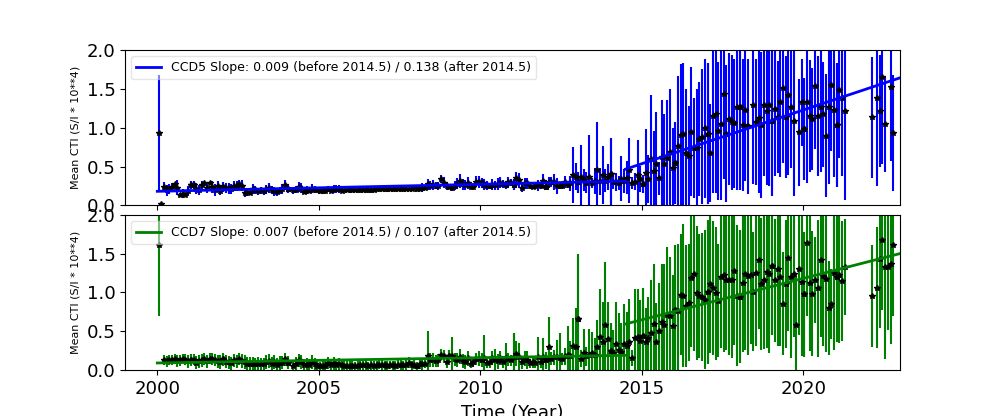
The Mean Detrended CTI
We report CTIs with a refined data definition. CTIs were computed for the temperature dependency corrected data. Please see CTI page for detailed explanation. CTI's are computed for Mn K alpha, and defined as slope/intercept x10^4 of row # vs ADU. Data file: here
Imaging CCDs
Spectral CCDs
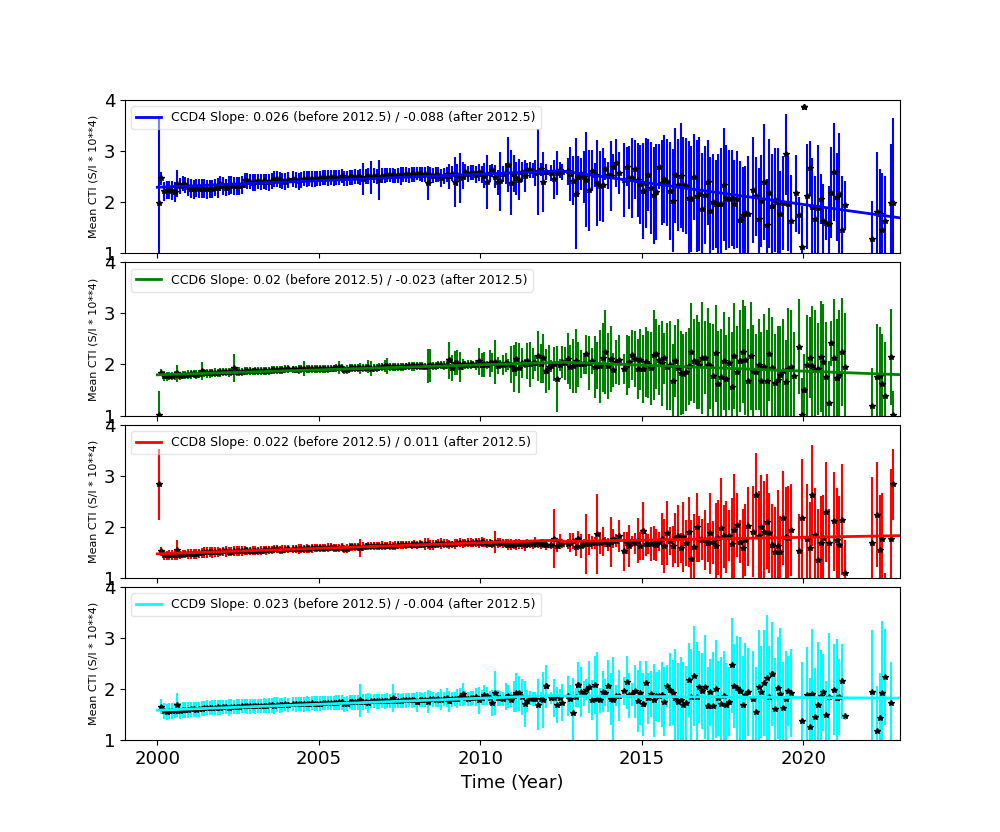
Backside CCDs
Focal Plane Temperature
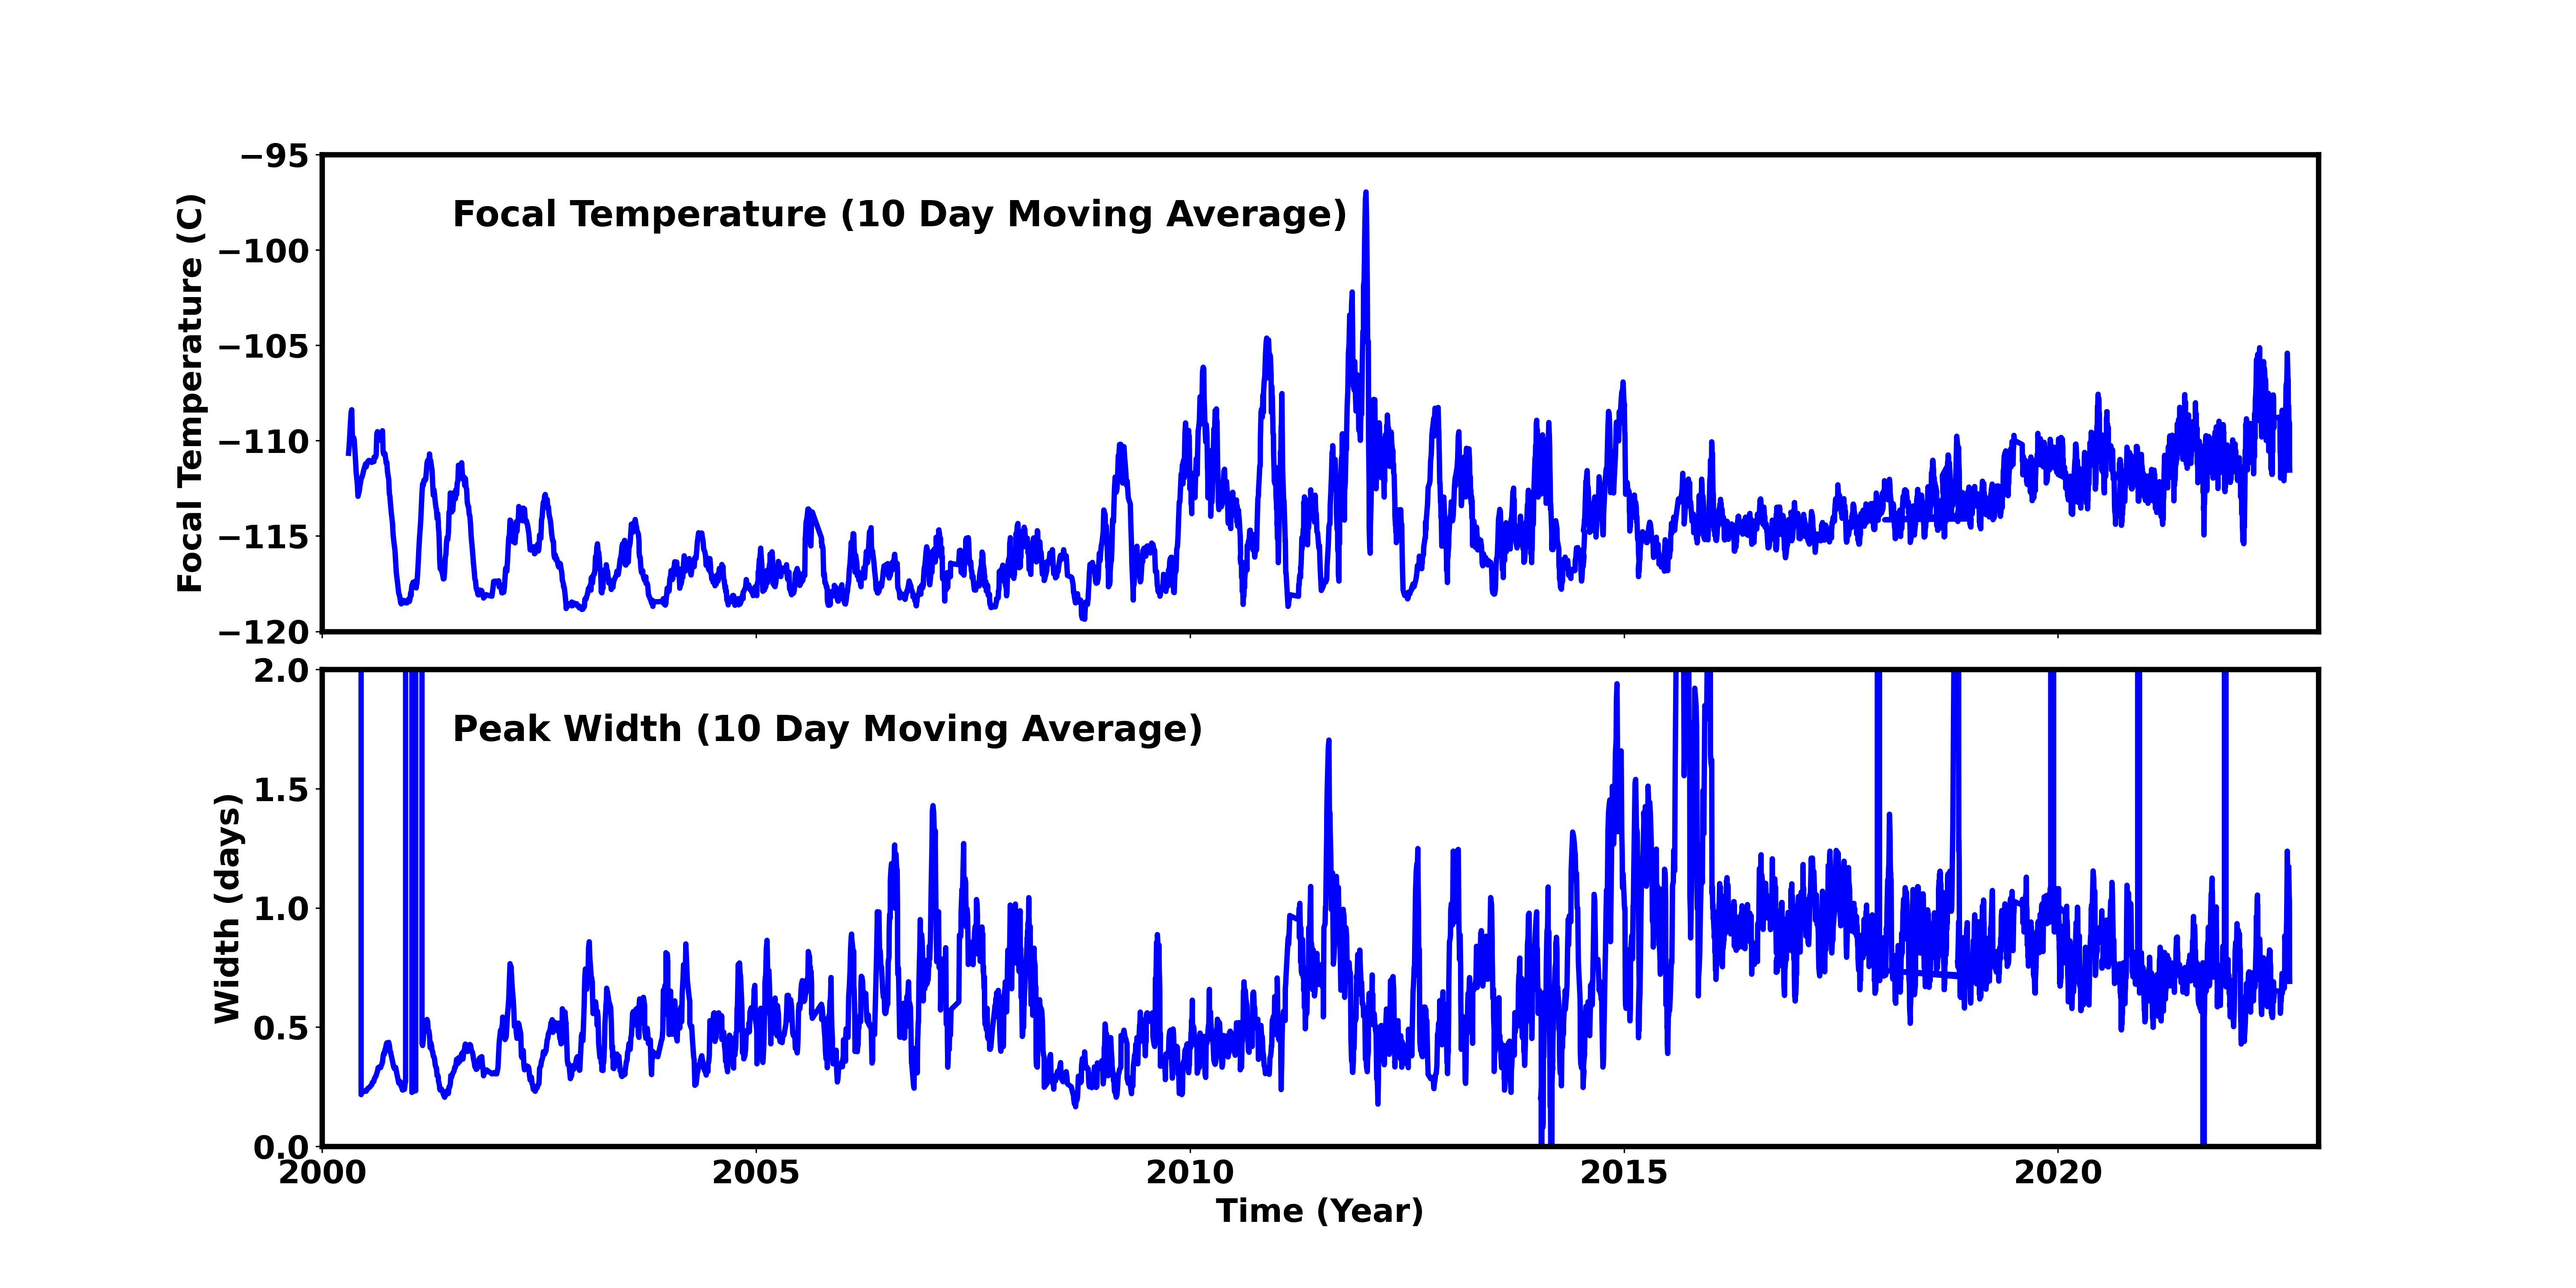
Aug 2022 Focal Temperature
| The Mean (max) FPT: | |
|---|---|
| -109.74 | +/- 5.95 C |
| Mean Width: | |
| 0.85 | +/- 0.63 days |
Averaged Focal Plane Temperature
We are using 10 period moving averages to show trends of peak temperatures and peak widths. Note, the gaps in the width plot are due to missing/corrupted data.
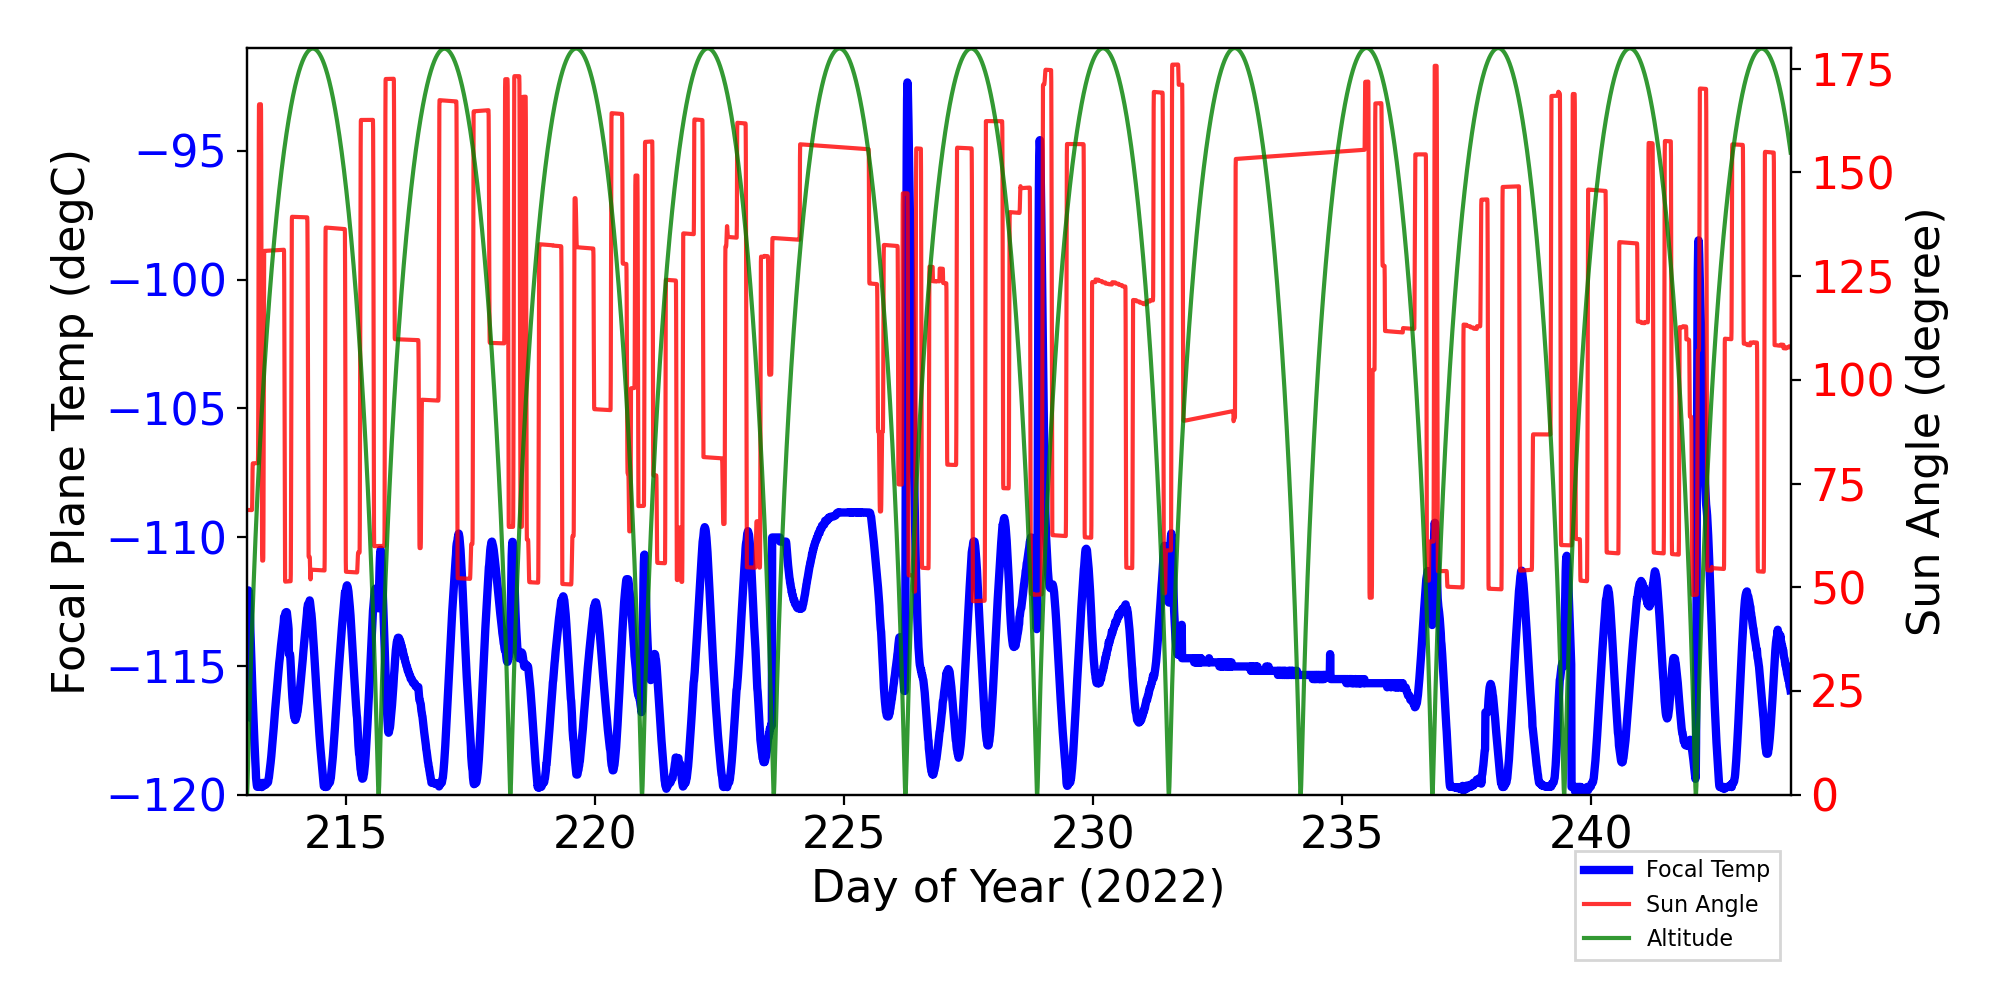
Focal Plane Temperature, Sun Angle and Altitude
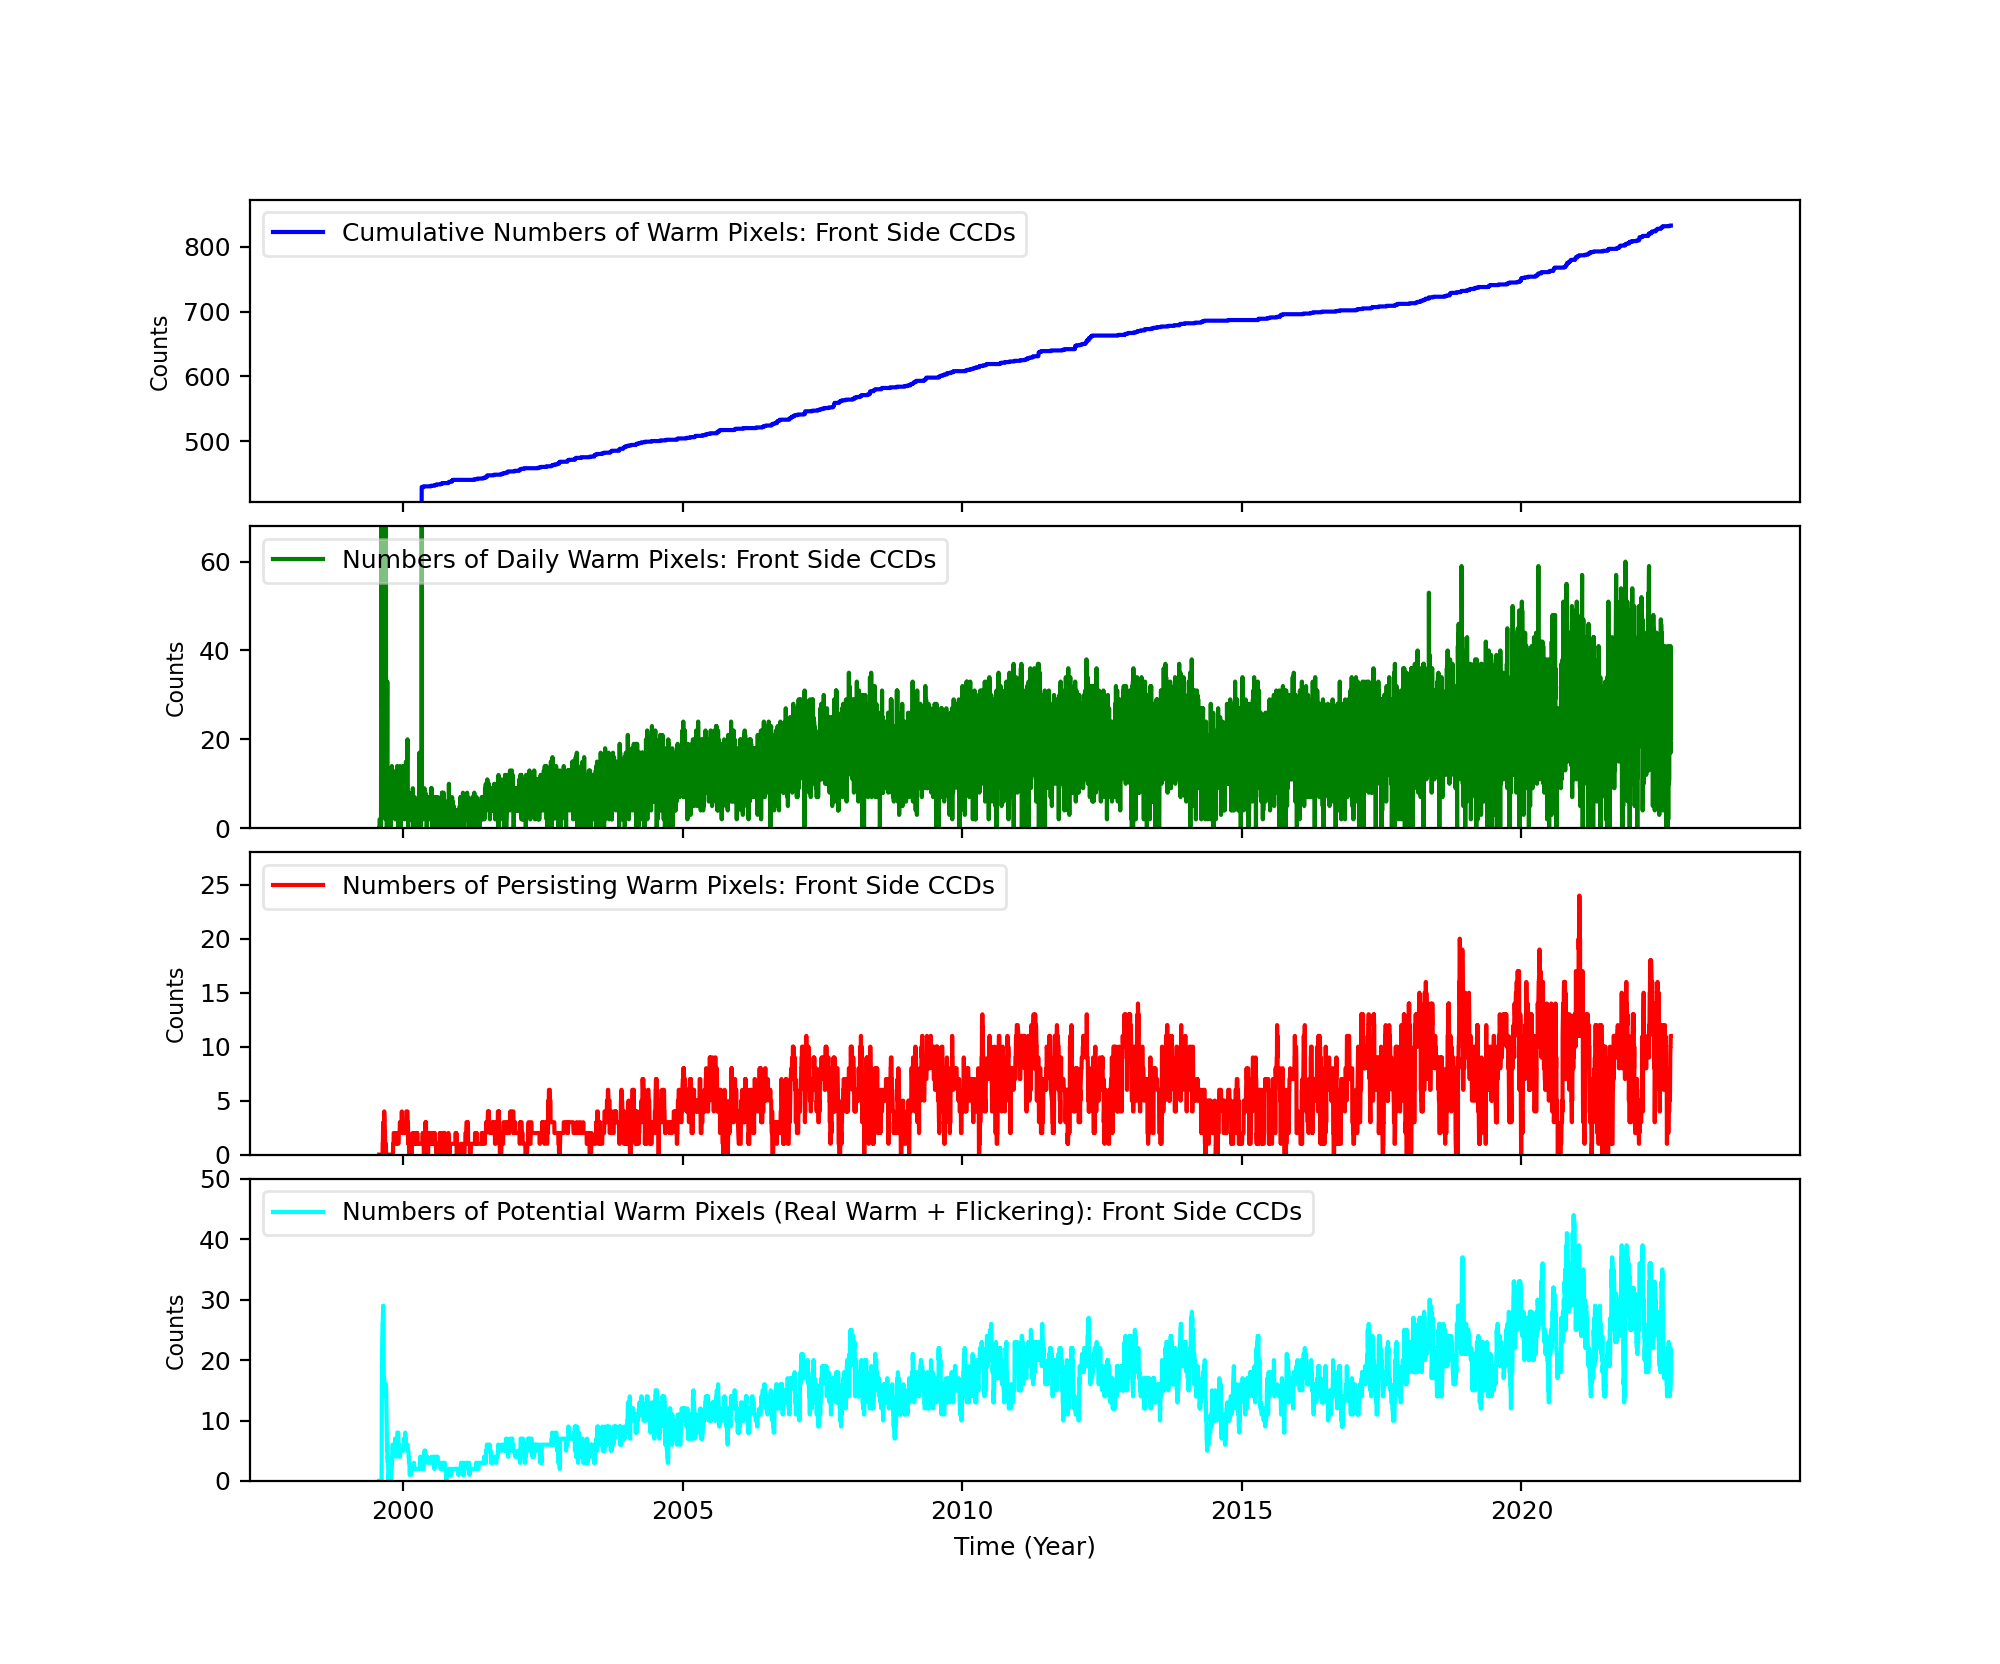
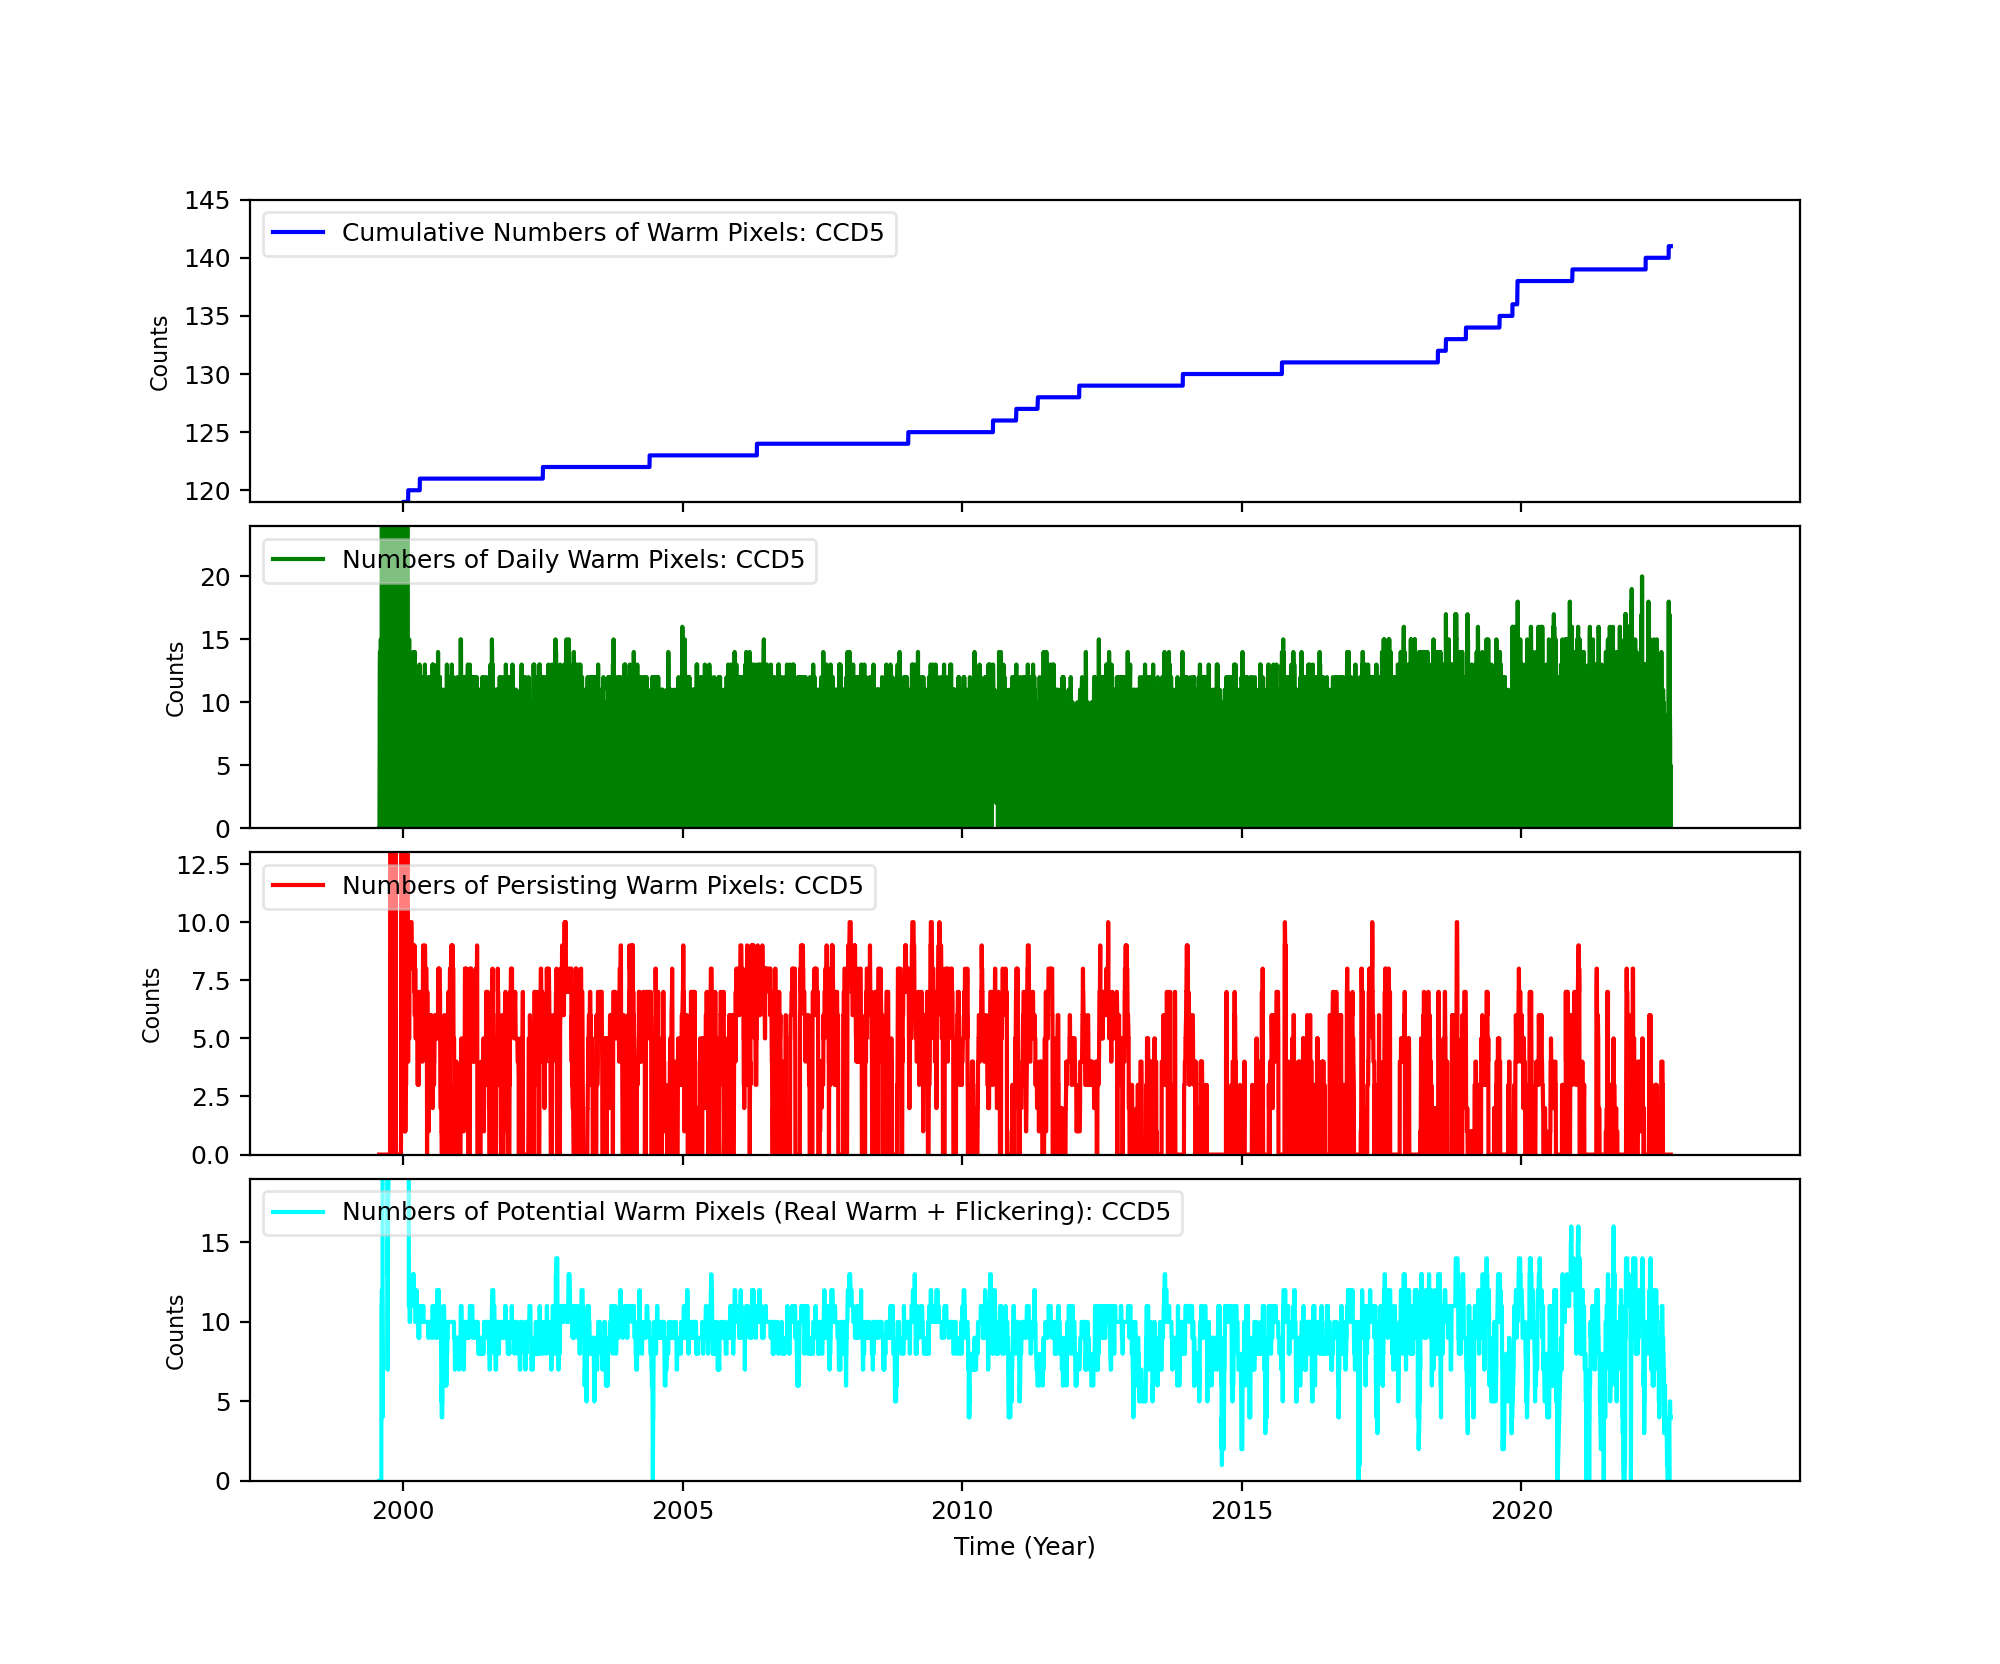
Bad Pixels
The plots below were generated with a new warm pixel finding script. Please see Acis Bad Pixel Page for details.
Front Side CCDs
Back Side CCD (CCD5)
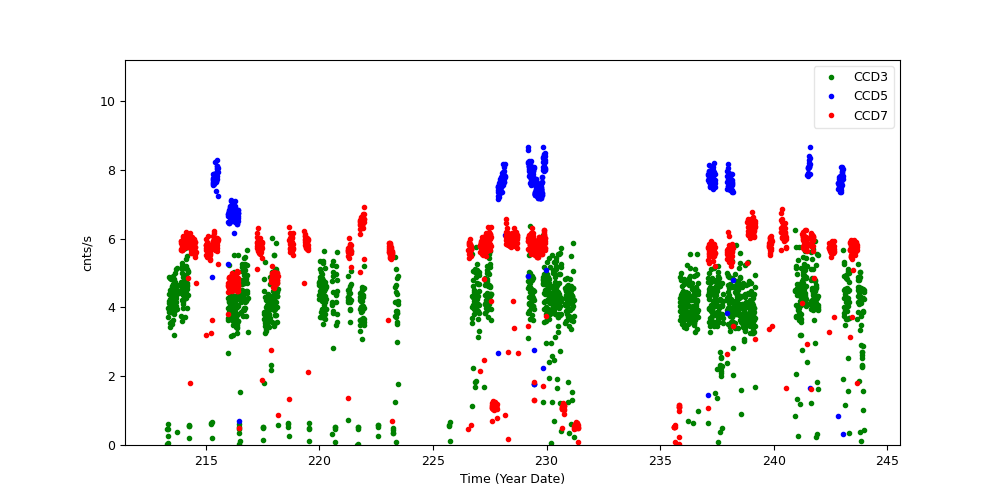
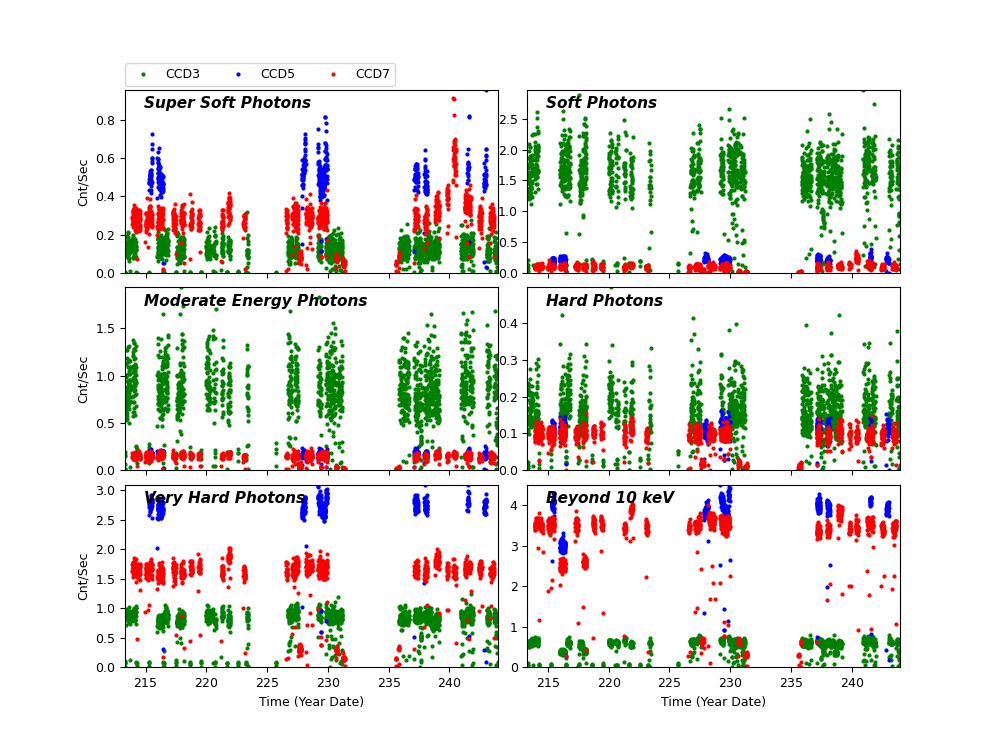
Science Instrument Background Rates
| Name | Low (keV) | High(KeV) | Description |
|---|---|---|---|
| SSoft | 0.00 | 0.50 | Super soft photons |
| Soft | 0.50 | 1.00 | Soft photons |
| Med | 1.00 | 3.00 | Moderate energy photons |
| Hard | 3.00 | 5.00 | Hard Photons |
| Harder | 5.00 | 10.00 | Very Hard photons |
| Hardest | 10.00 | Beyond 10 keV |
HRC
DOSE of Central 4K Pore-Pairs
Please refer to Maximum Dose Trends for more details.
)
|
|---|
IMAGE                NPIX      MEAN    STDDEV      MIN       MAX
HRCI_08_2022.fits  16777216	0.006 	0.075 	0.000 	2.000
)
IMAGE                       NPIX      MEAN    STDDEV      MIN       MAX
HRCI_08_1999_08_2022.fits  16777216	na	na	na	na
)
|
|---|
IMAGE                NPIX      MEAN    STDDEV      MIN       MAX
HRCS_08_2022.fits  16777216	0.004 	0.066 	0.000 	6.000
)
IMAGE                       NPIX      MEAN    STDDEV      MIN       MAX
HRCS_08_1999_08_2022.fits  16777216	na	na	na	na
|
|
Max dose trend plots corrected for events that "pile-up"
in the center of the taps due to bad position information.
|
)
|
)
|
)
|
)
|
| May 2022 | Feb 2022 | Nov 2021 | Aug 2021 |
|---|
)
|
)
|
)
|
)
|
| May 2022 | Feb 2022 | Nov 2021 | Aug 2021 |
|---|
HRMA Focus
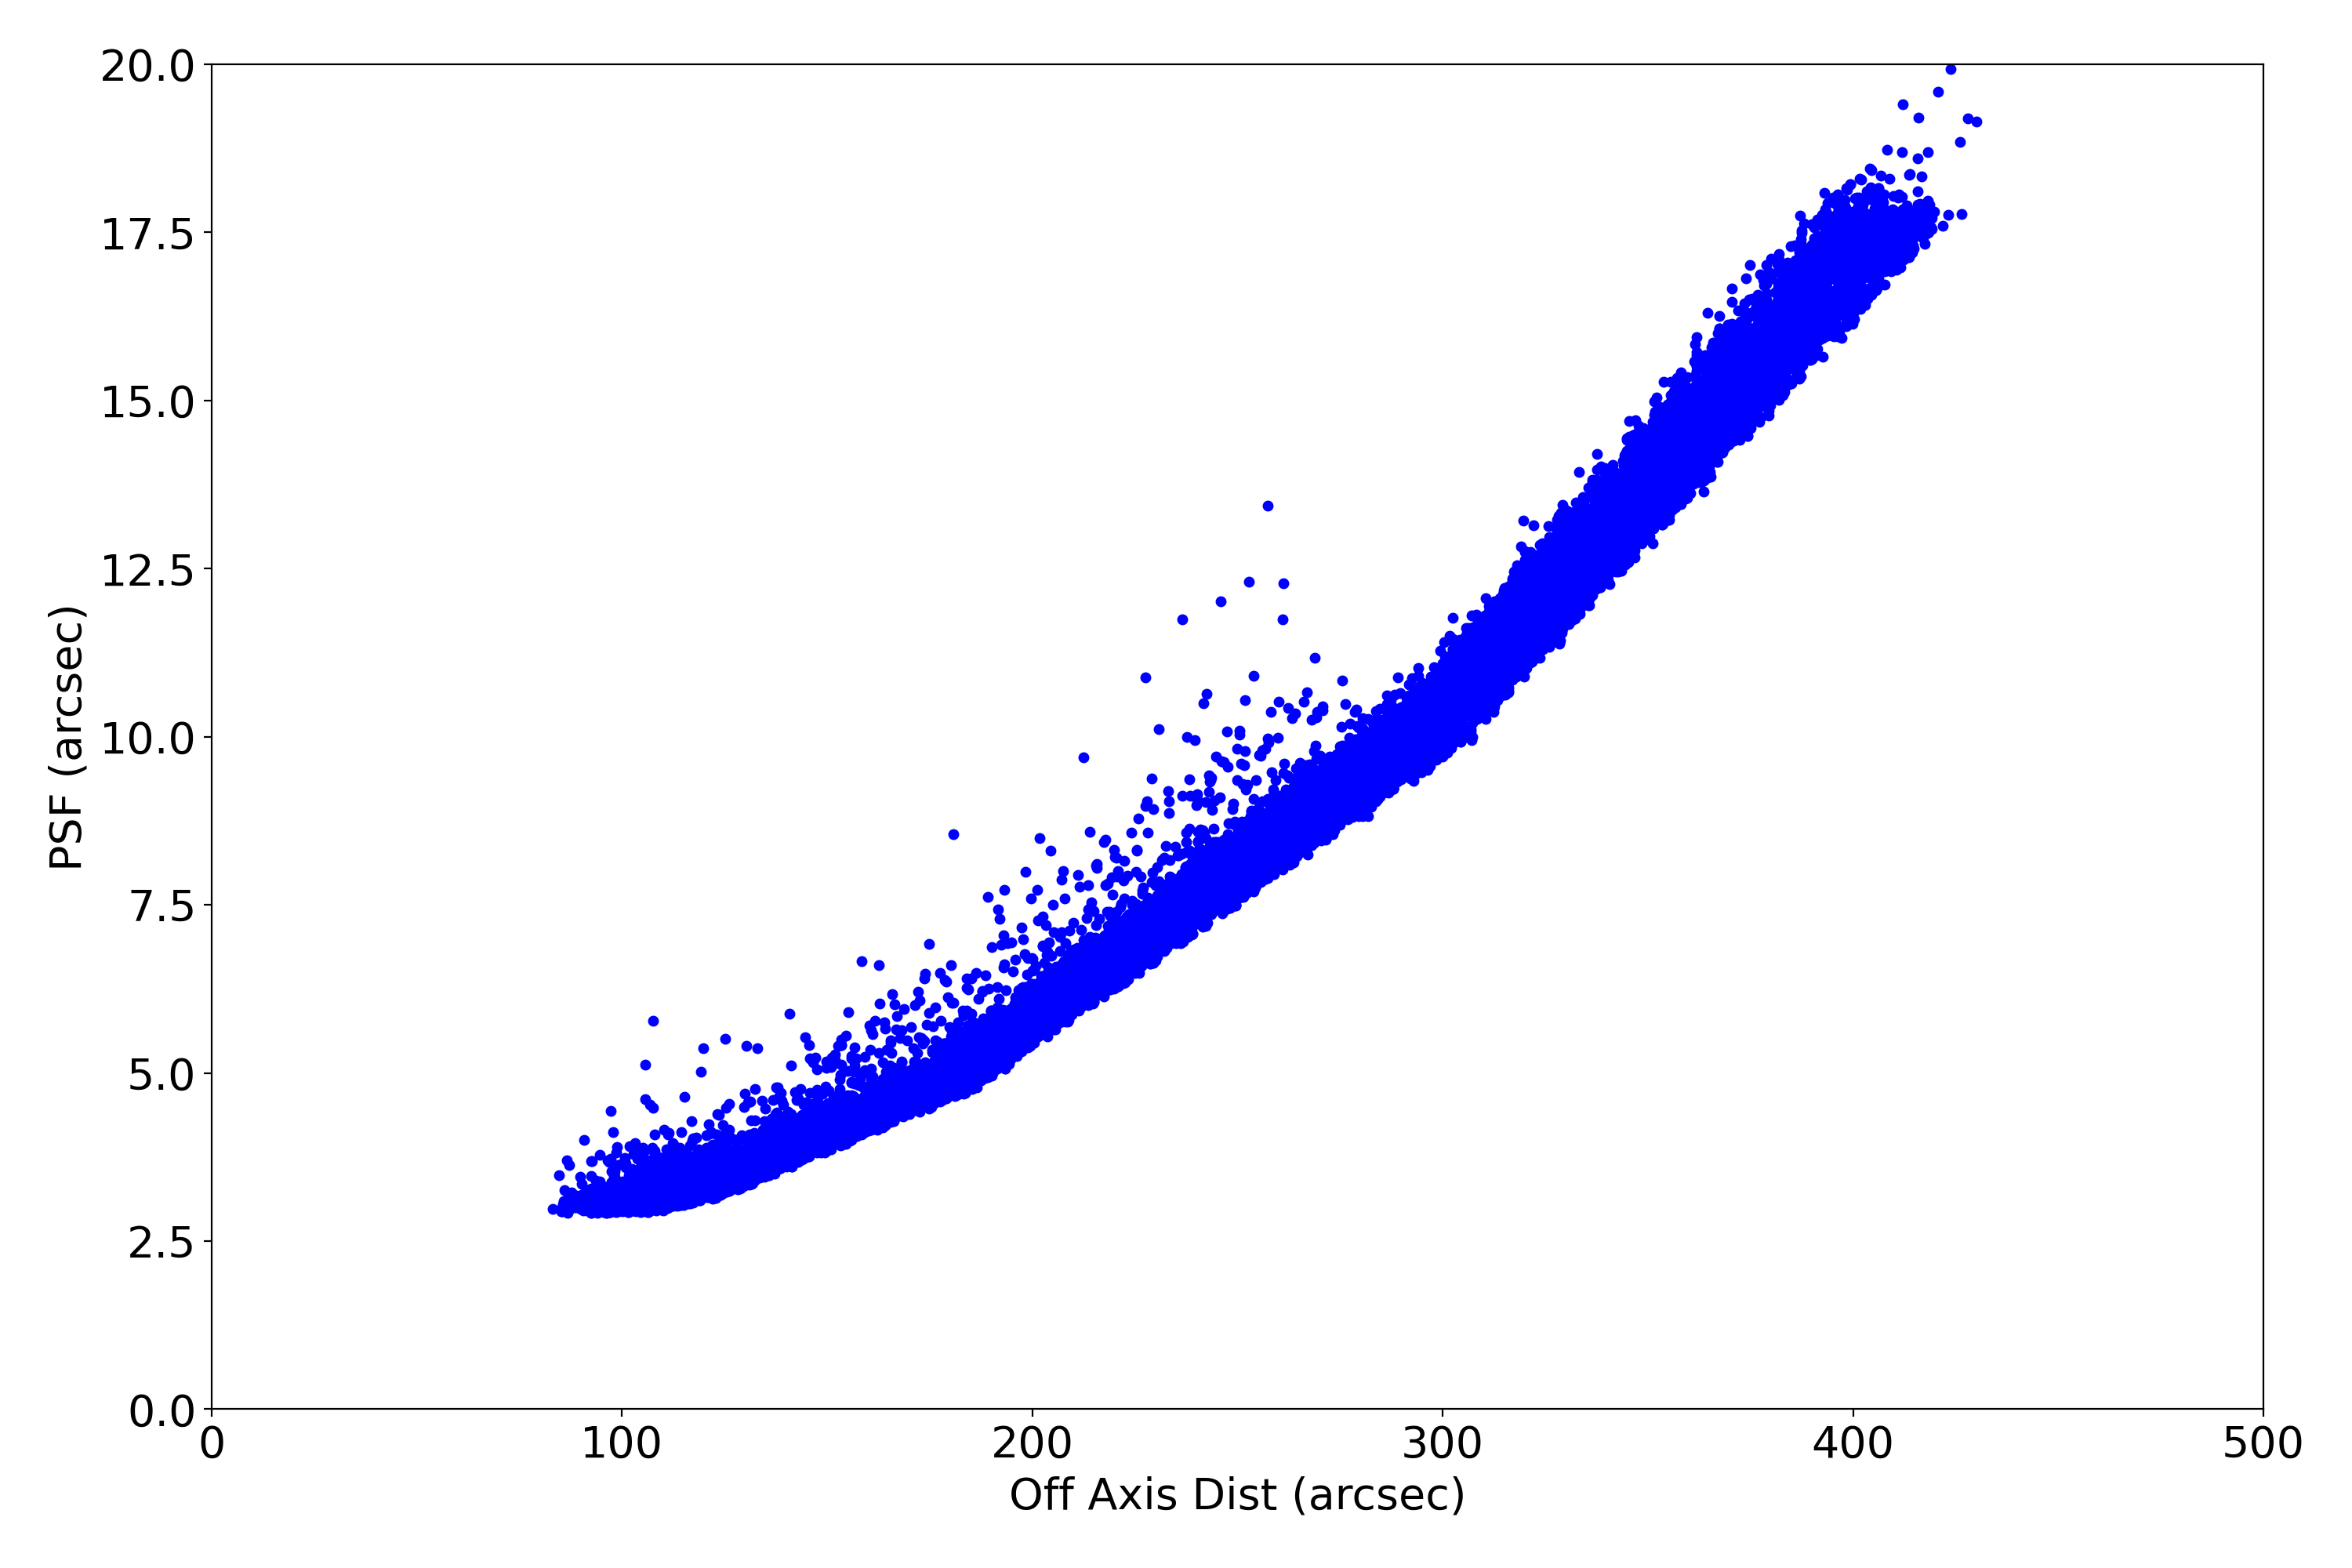
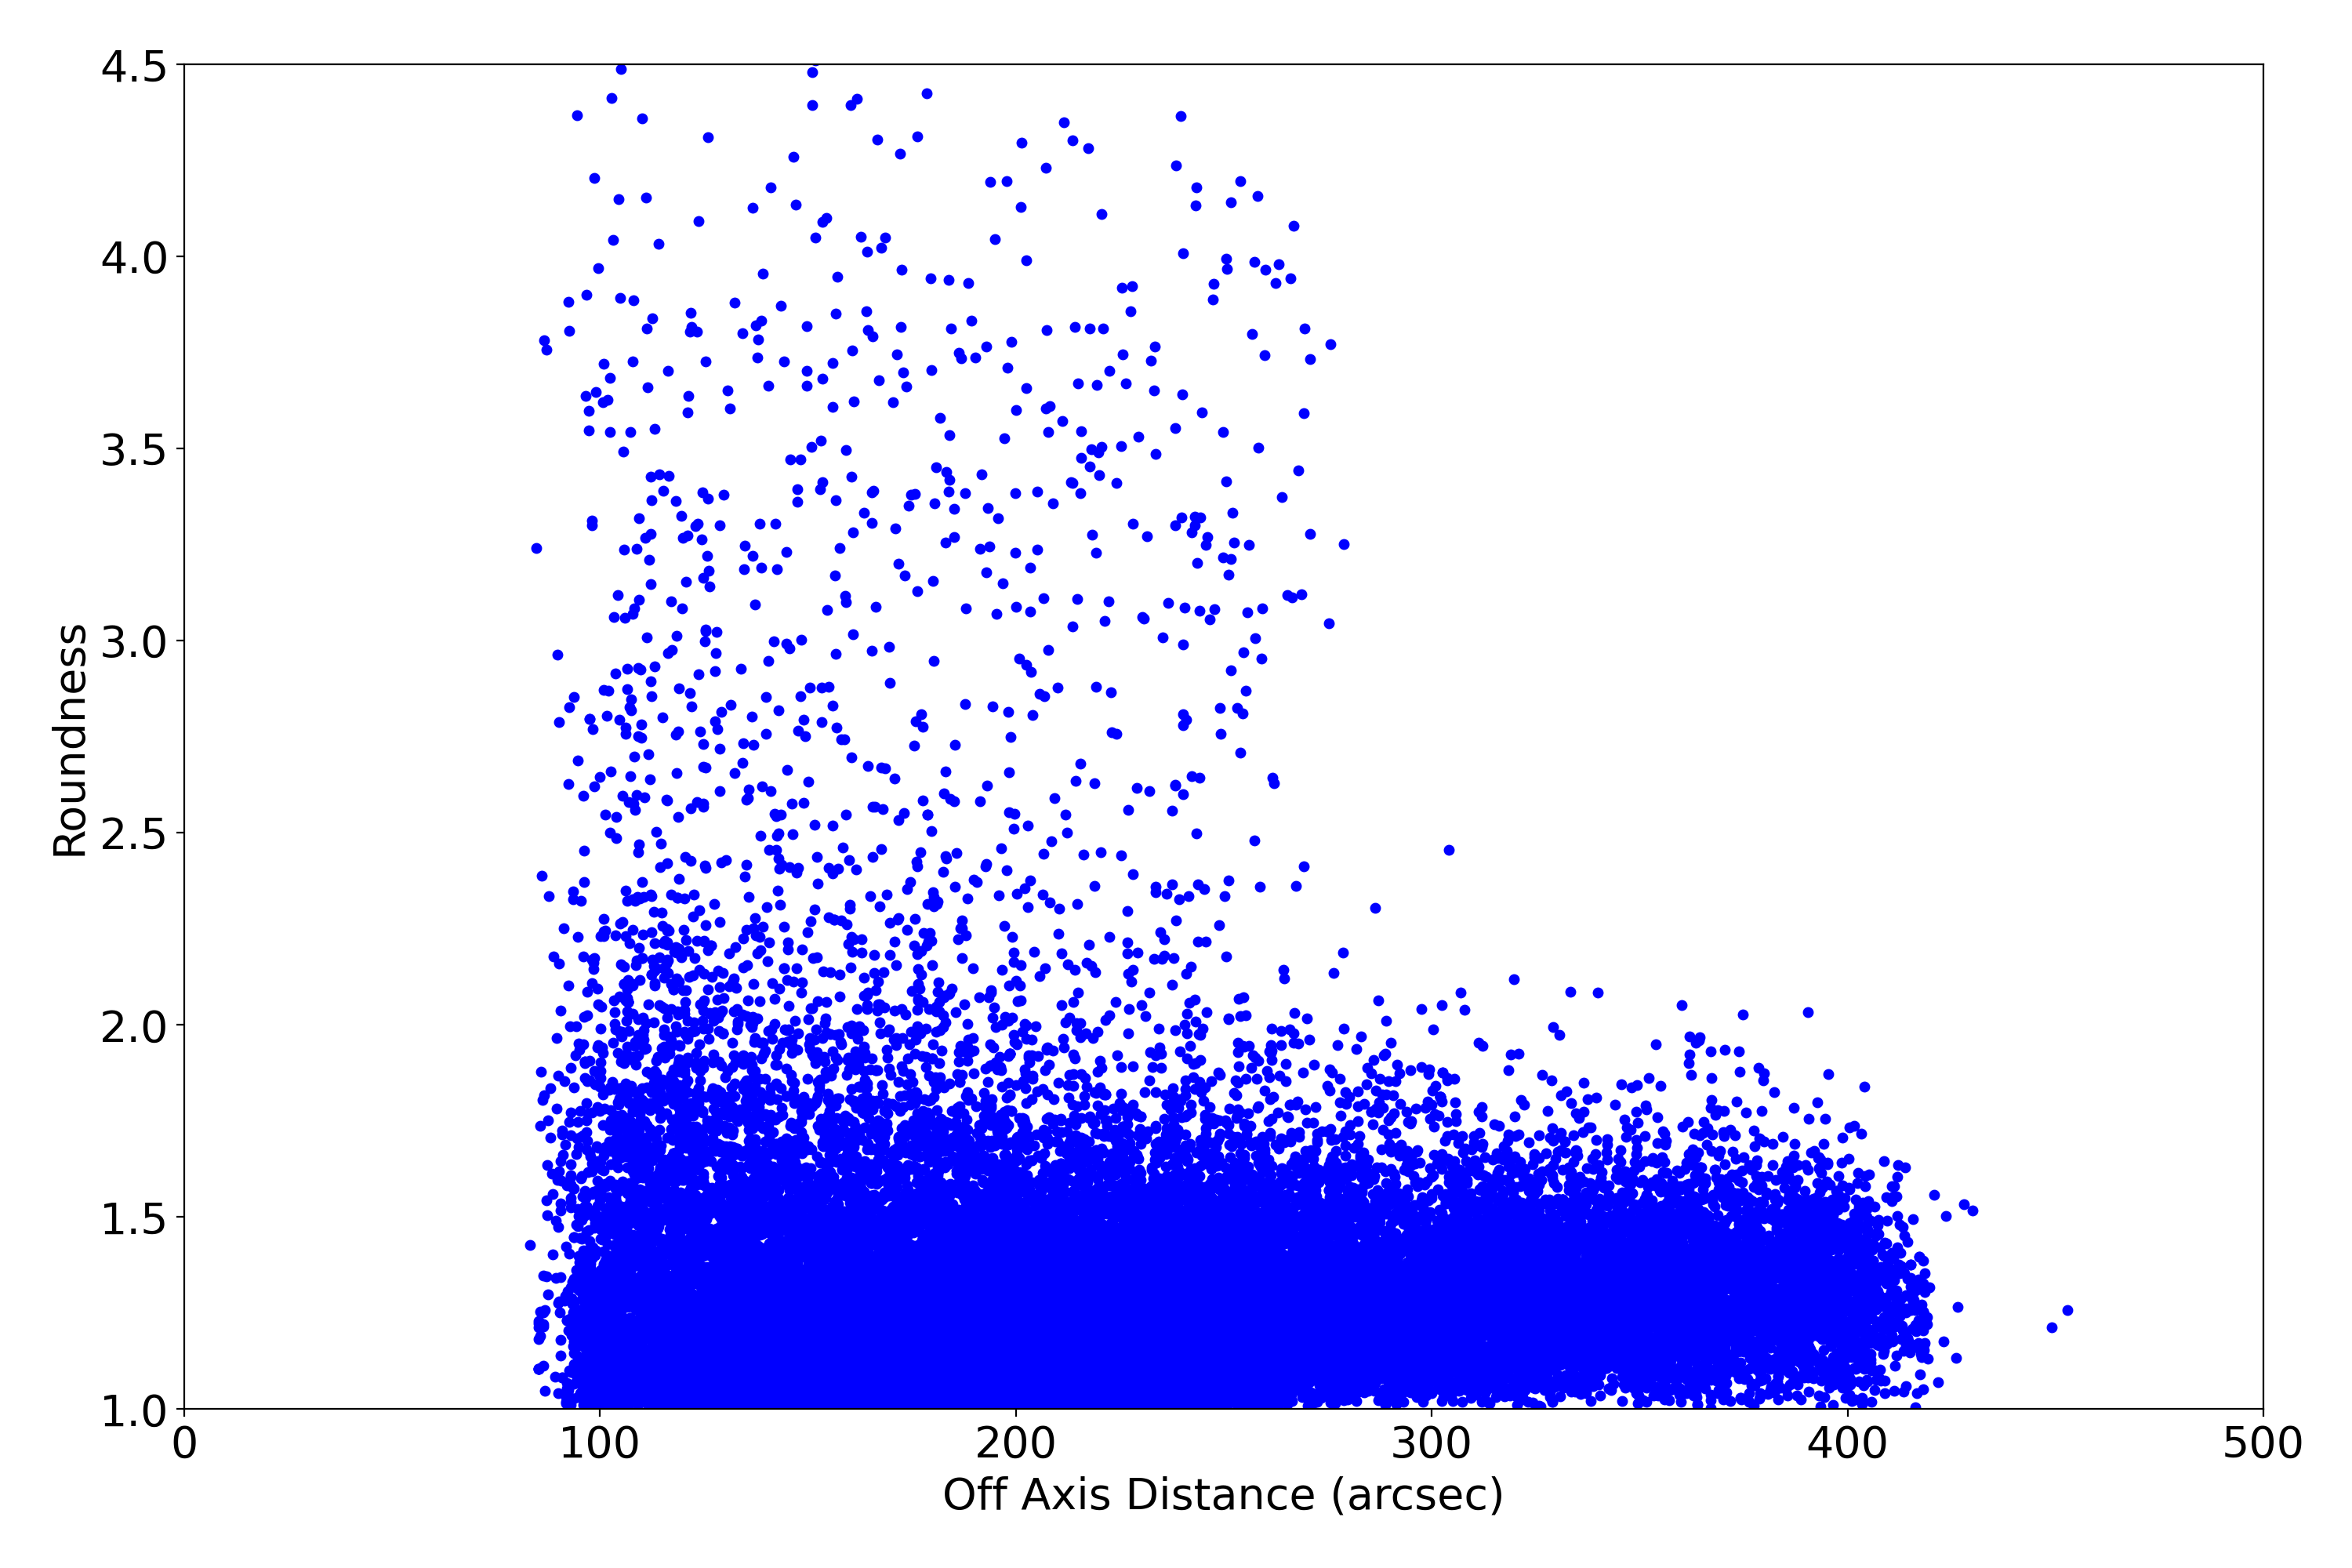
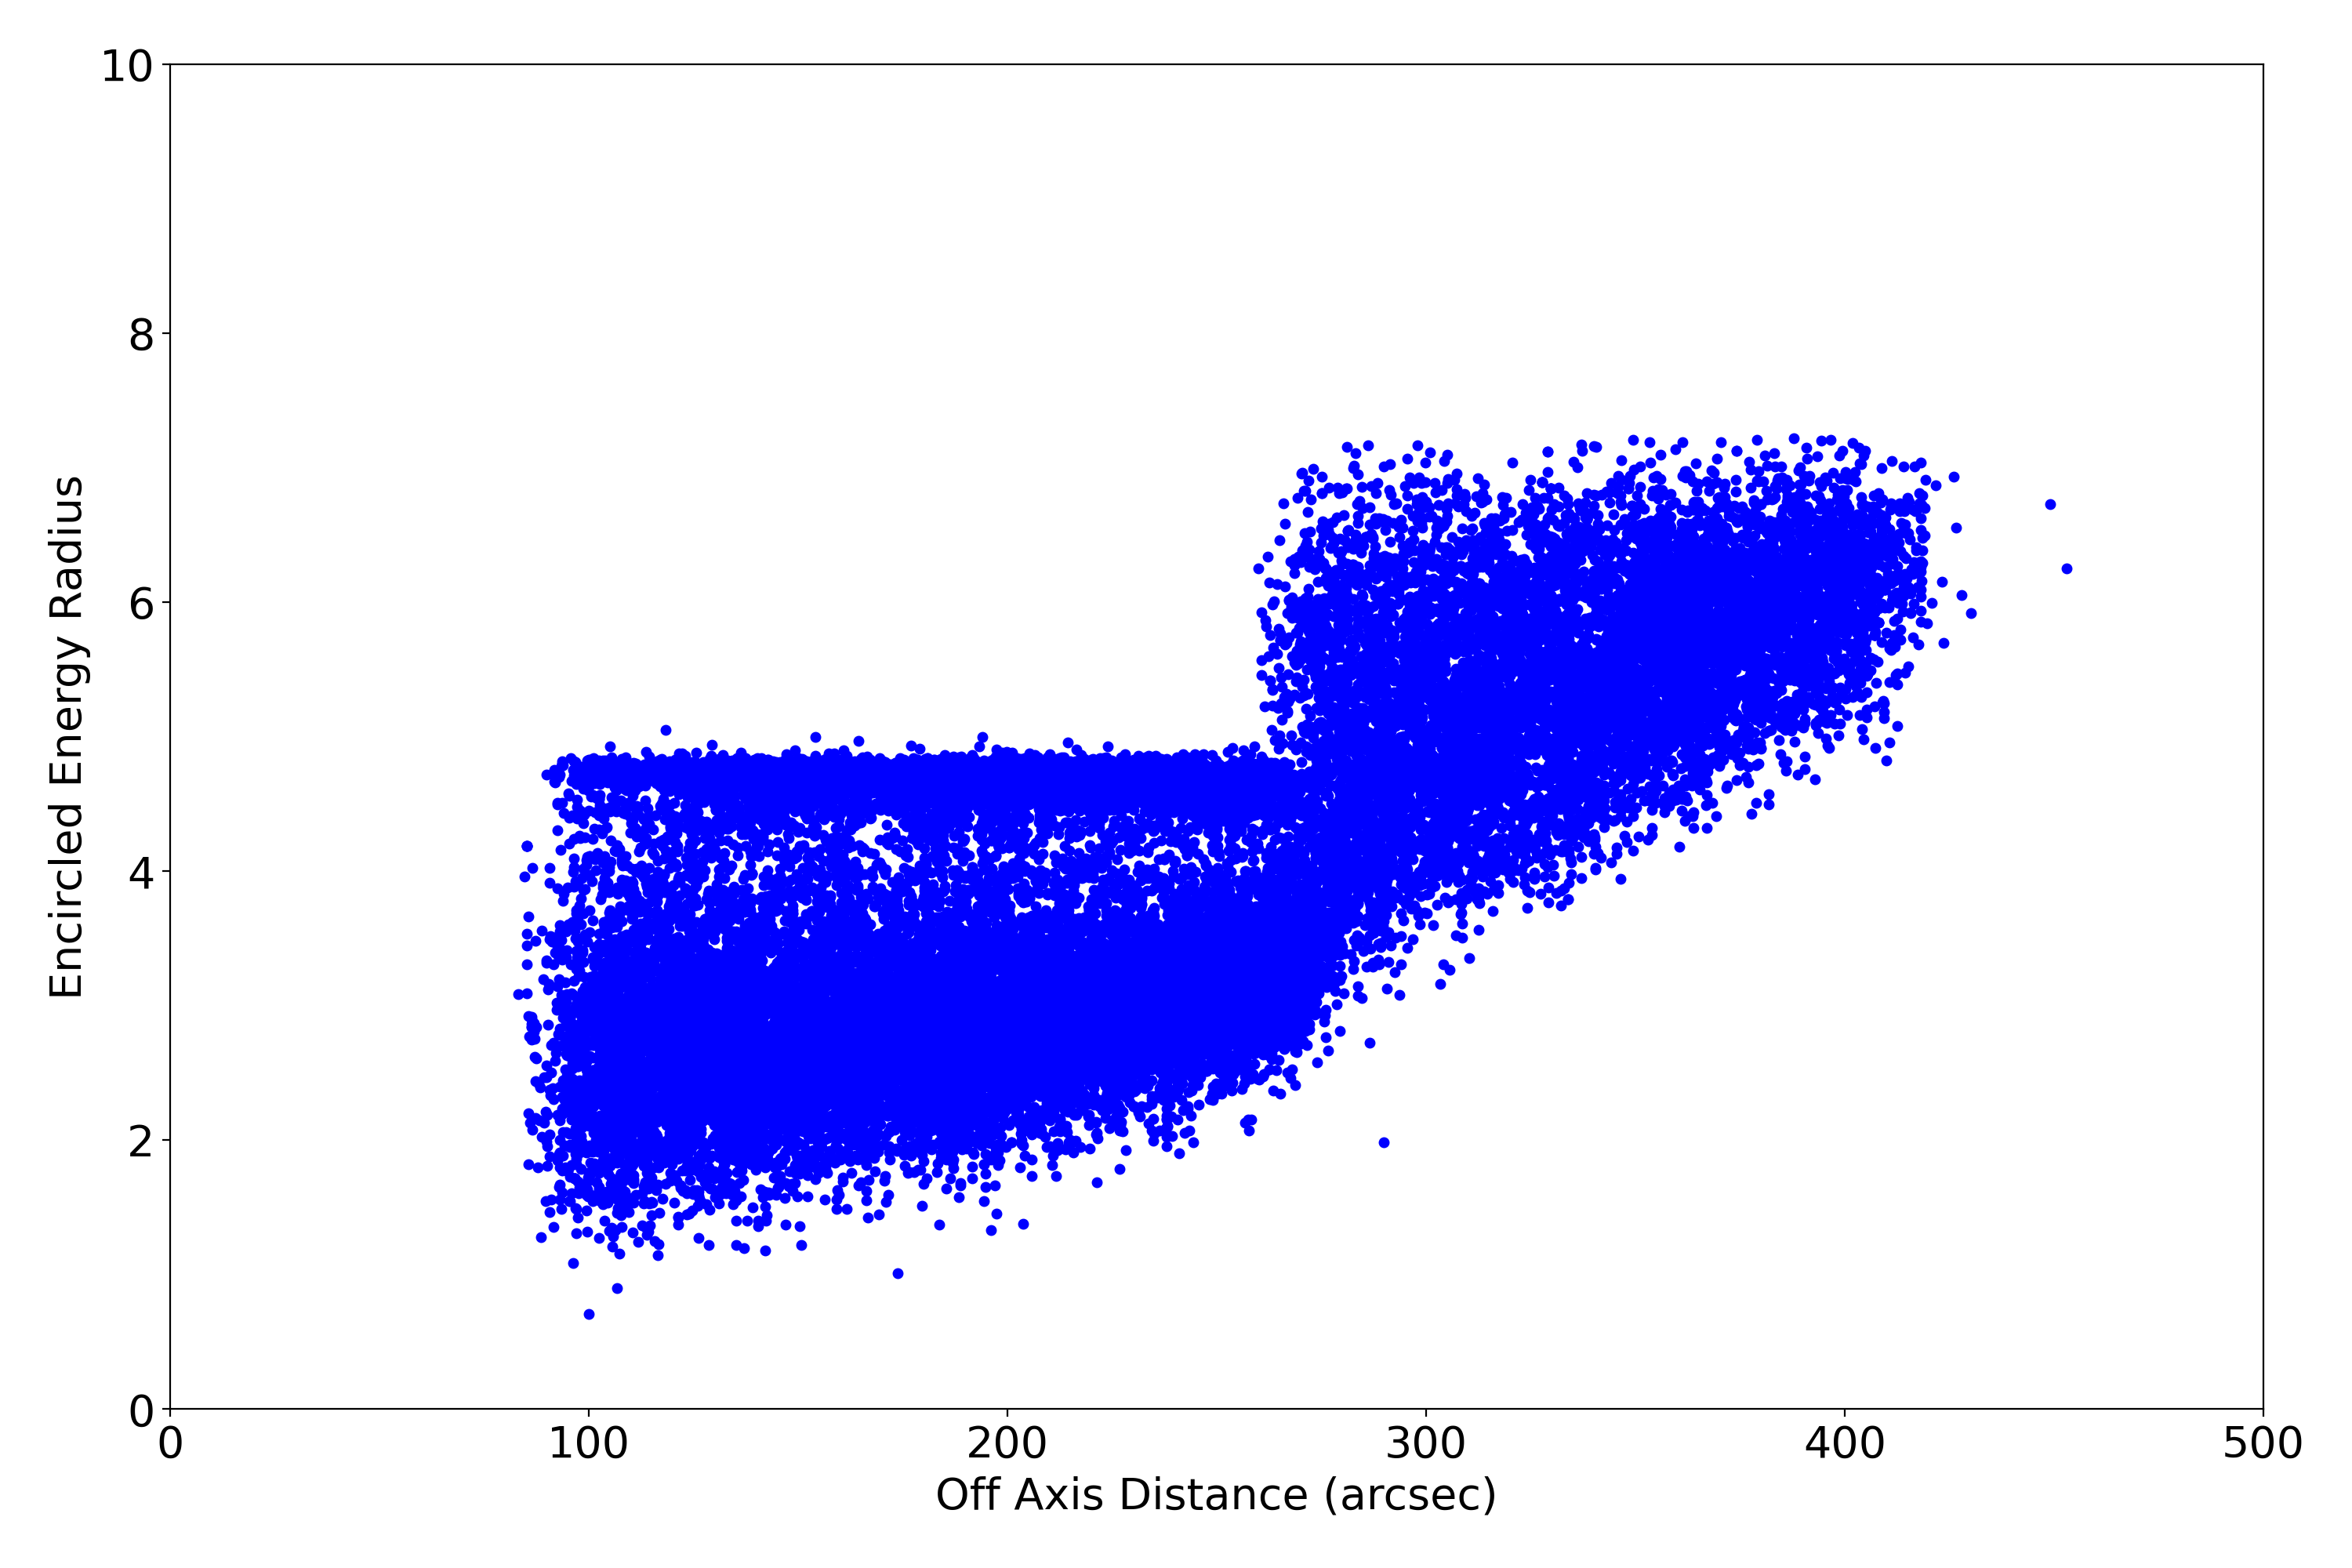
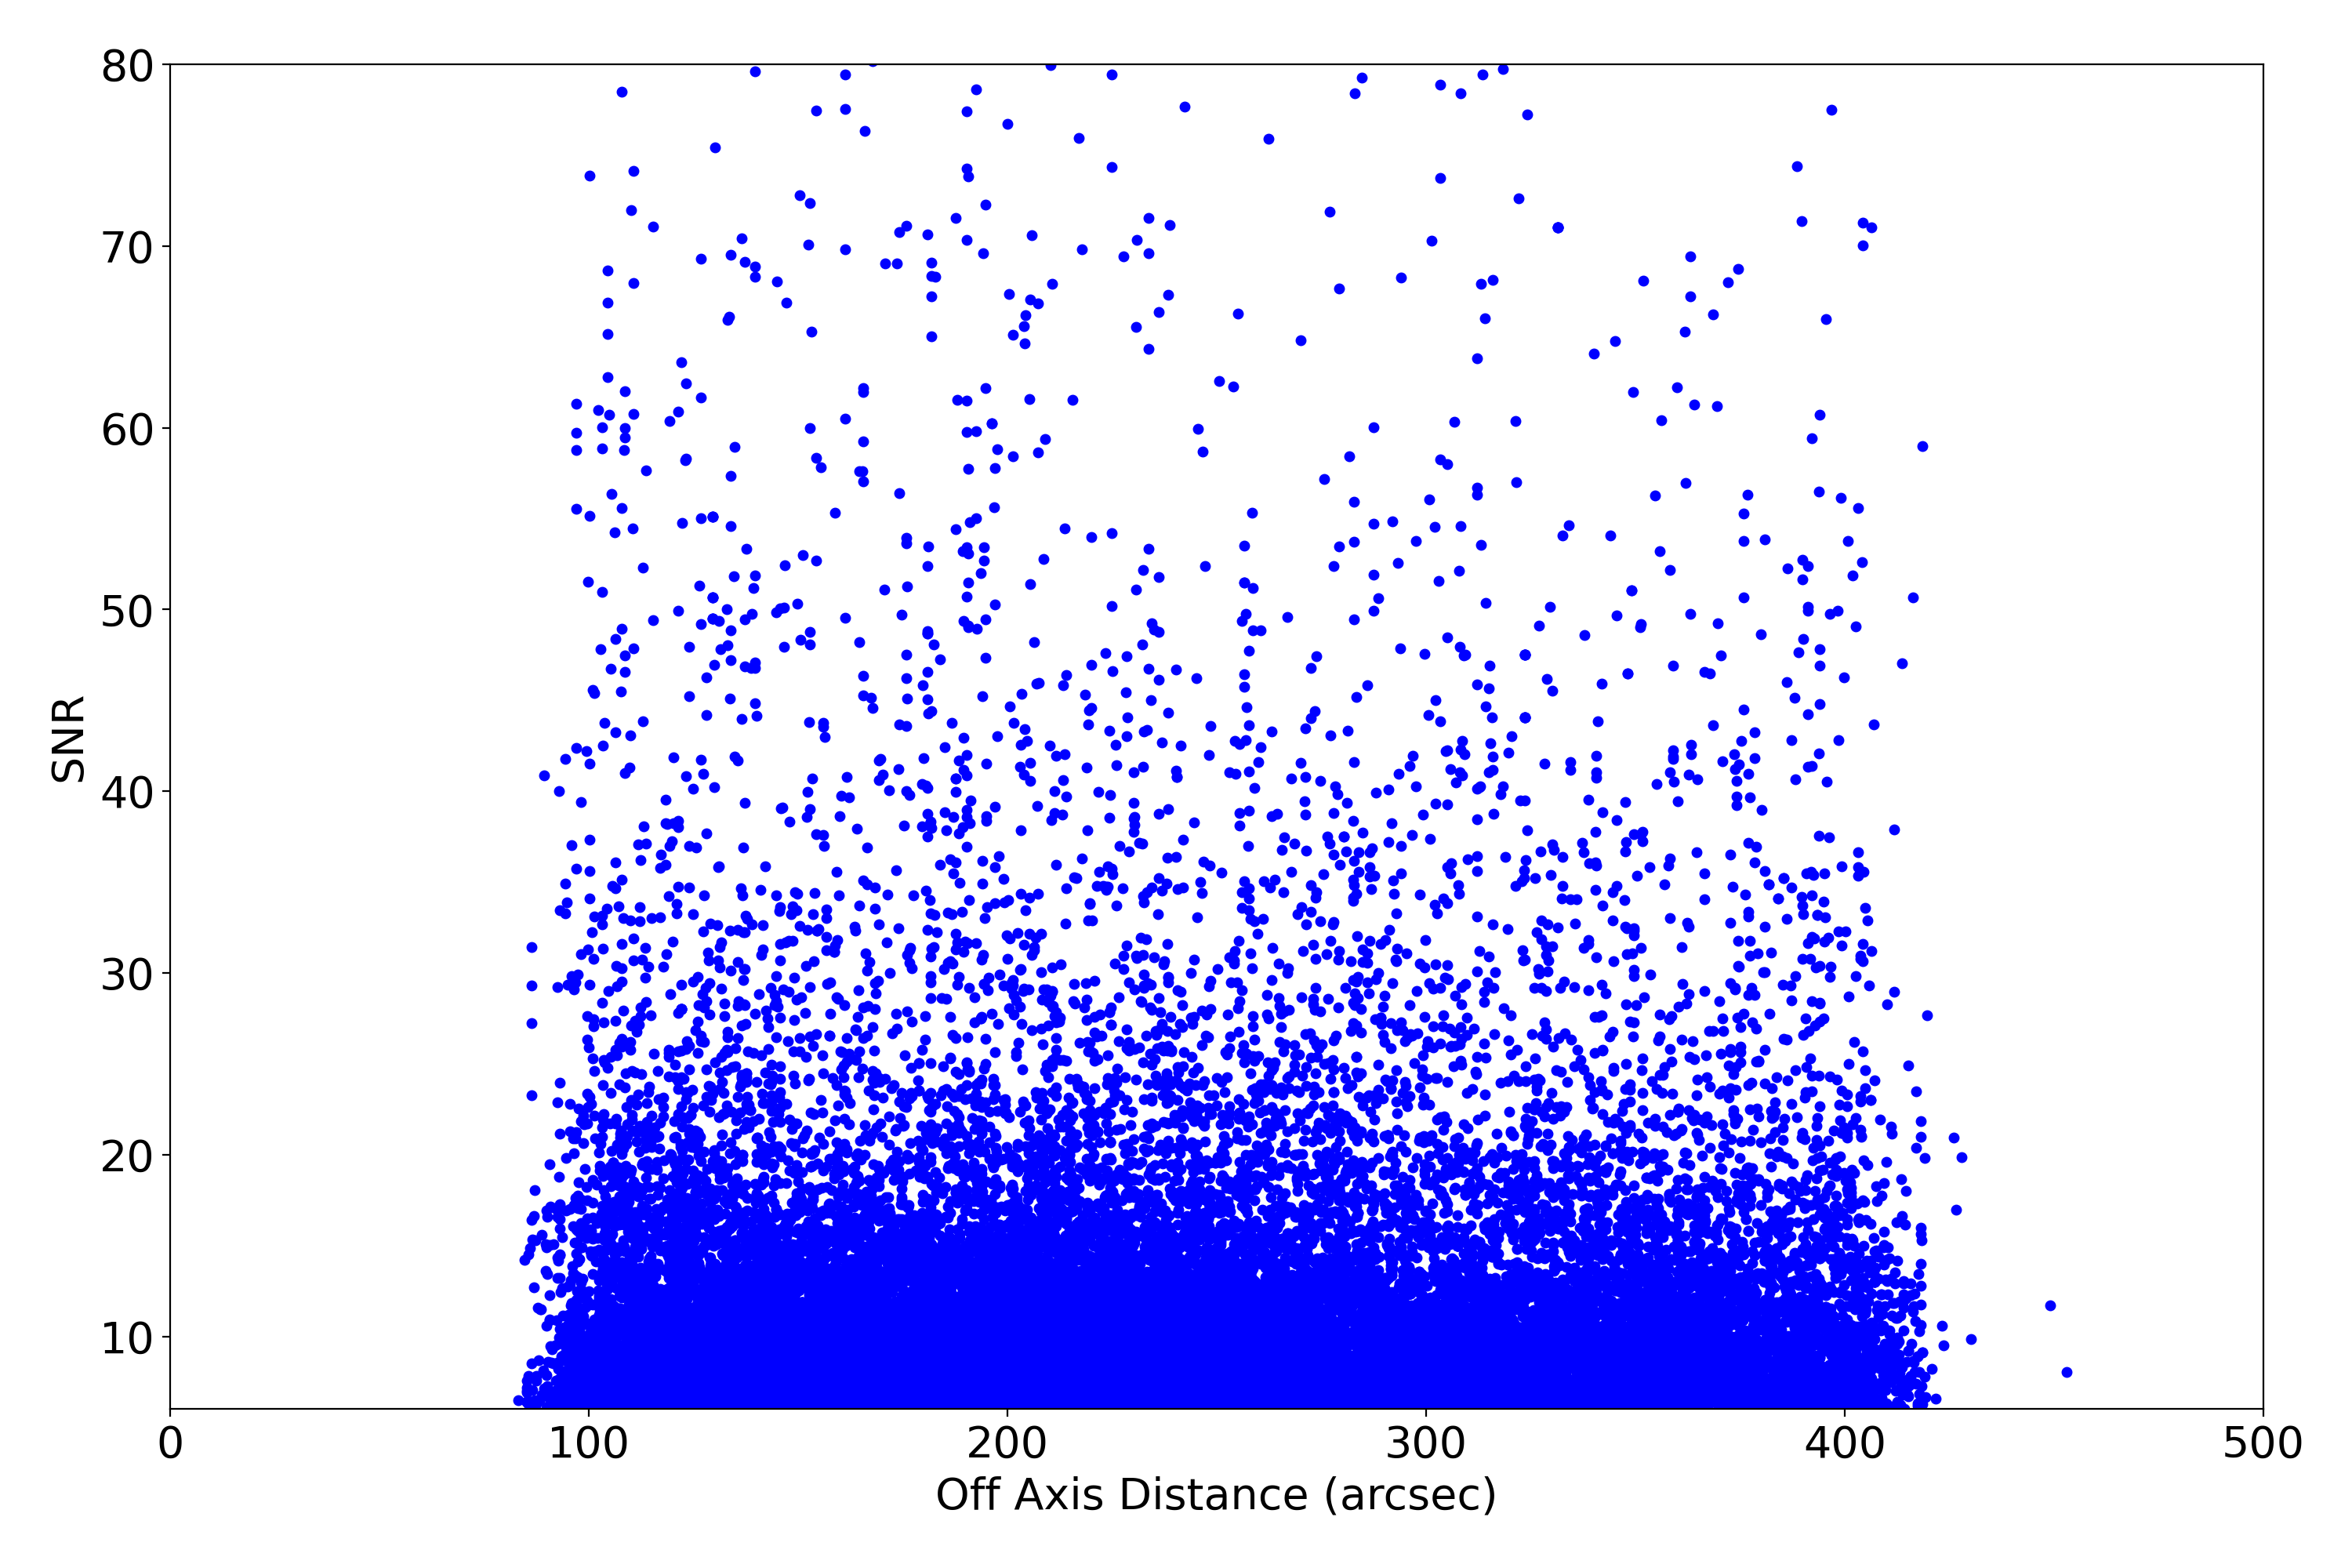
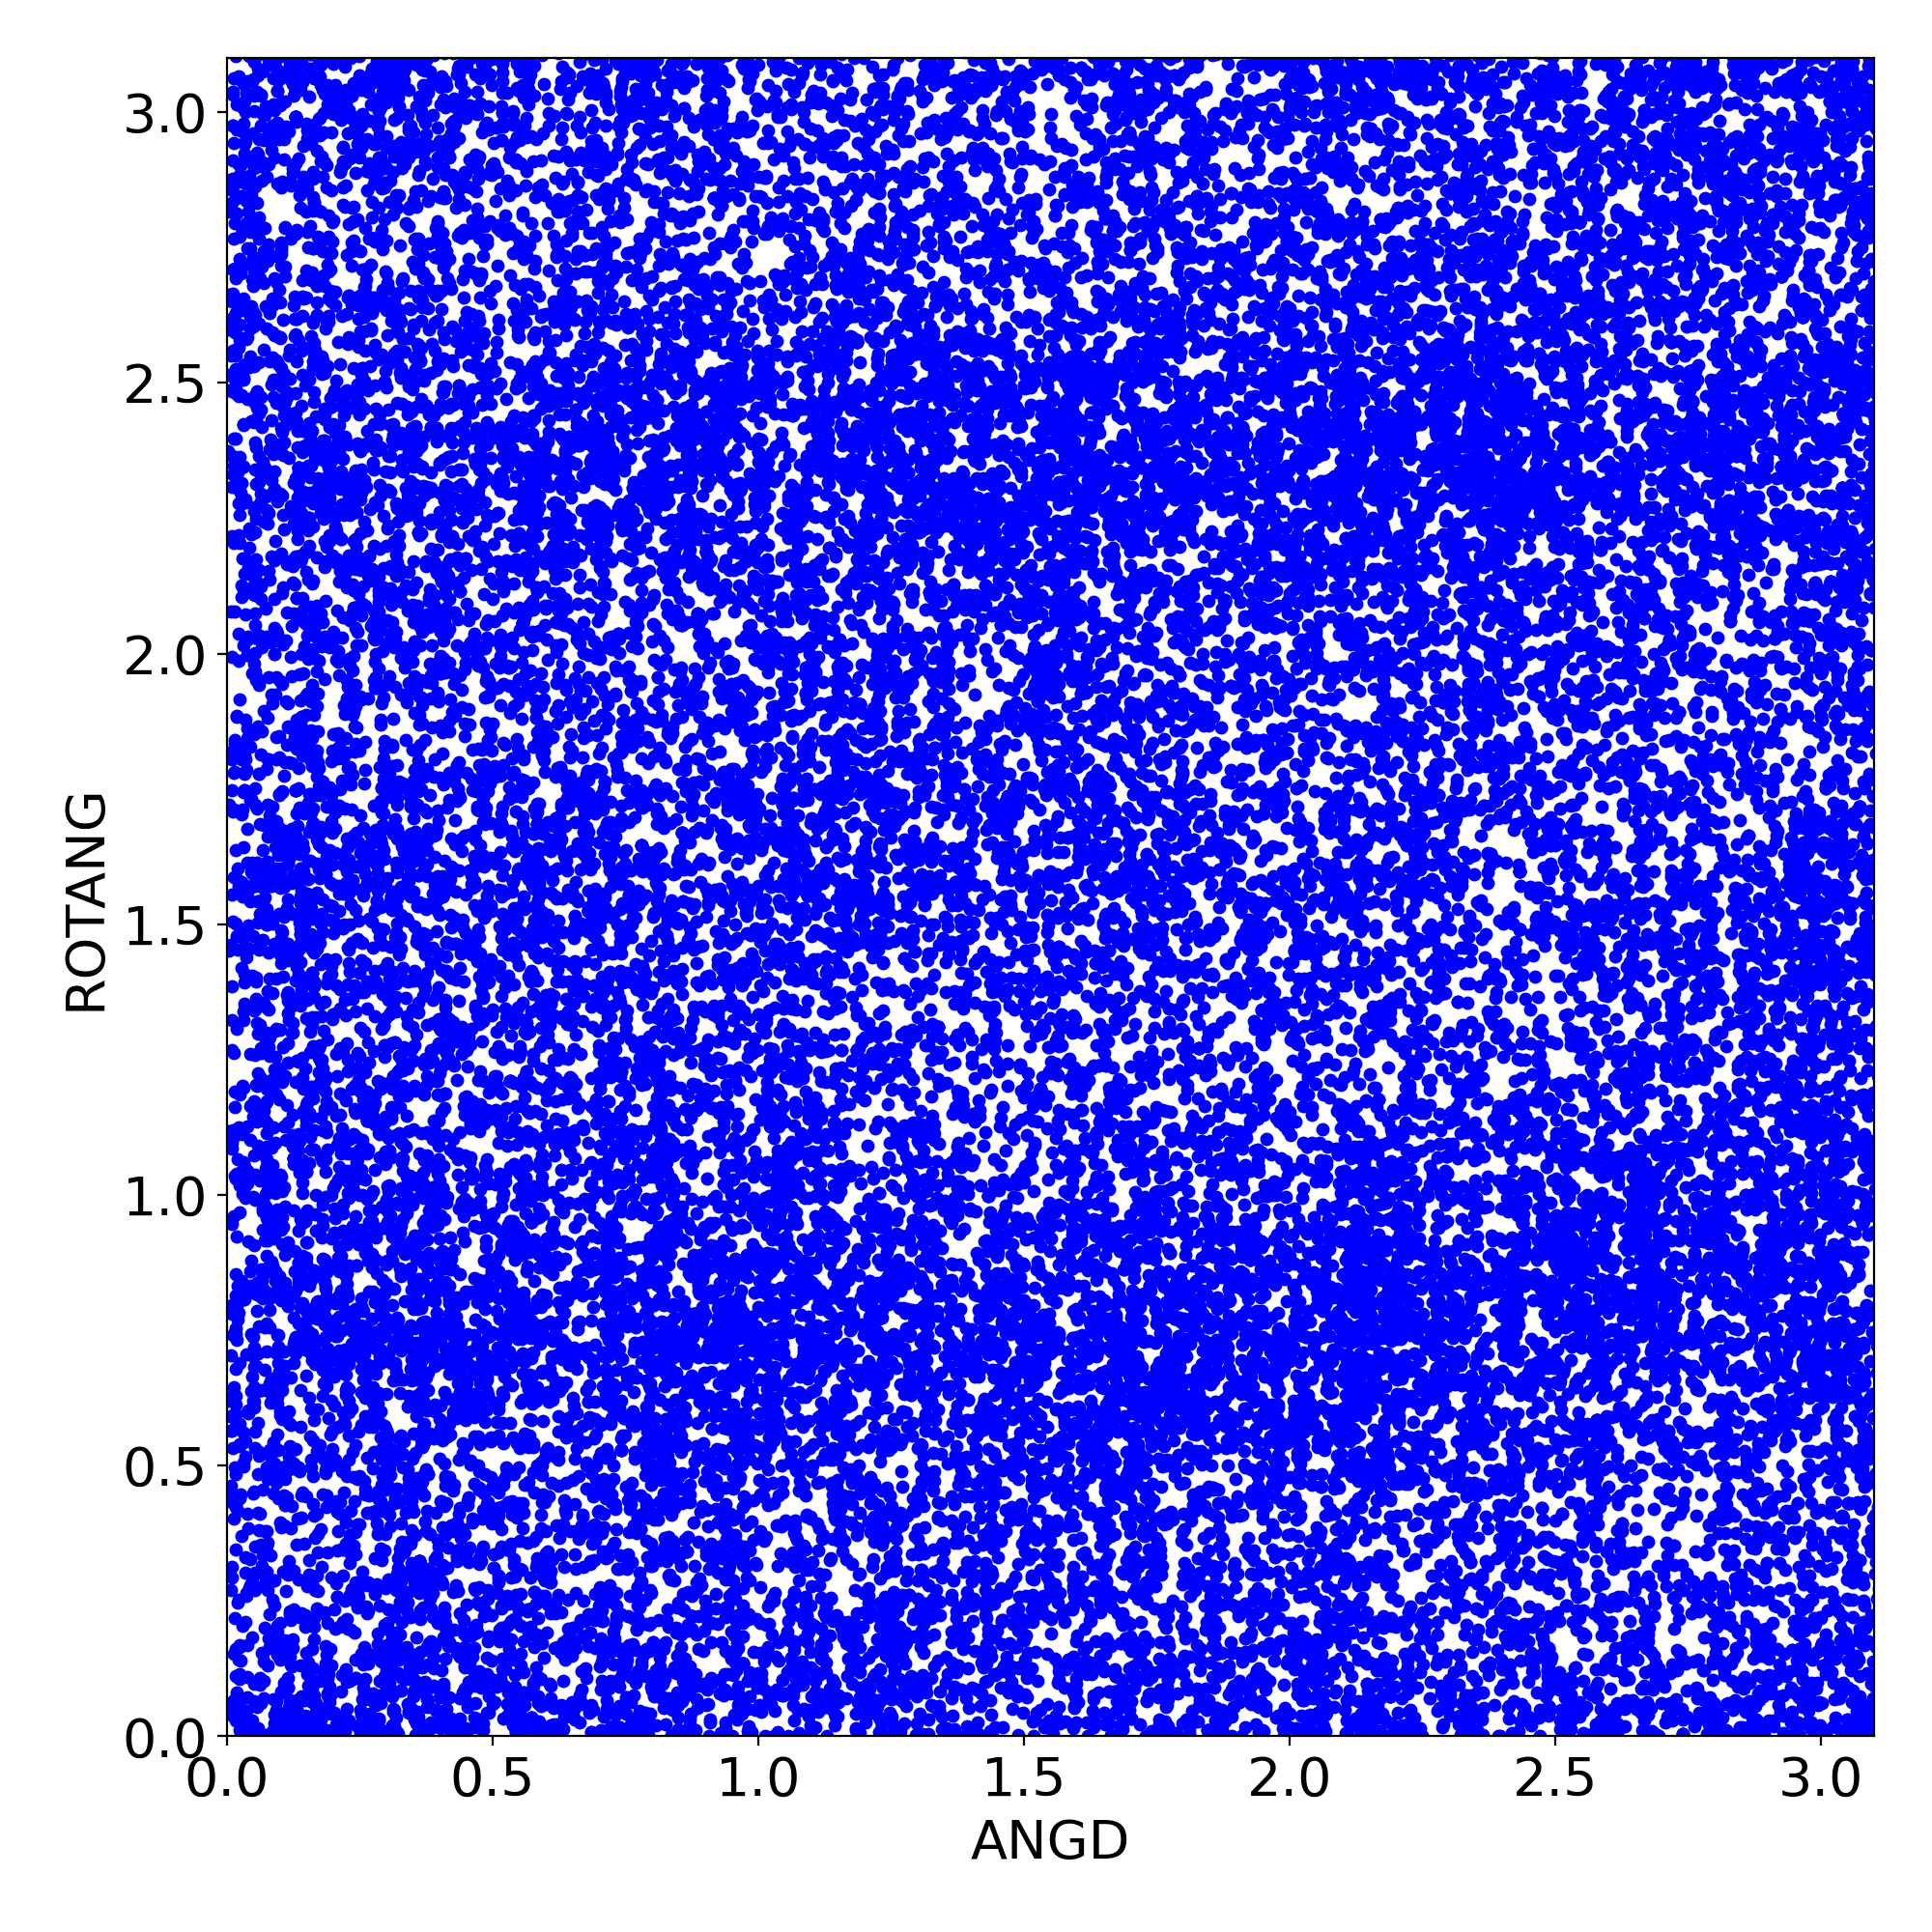
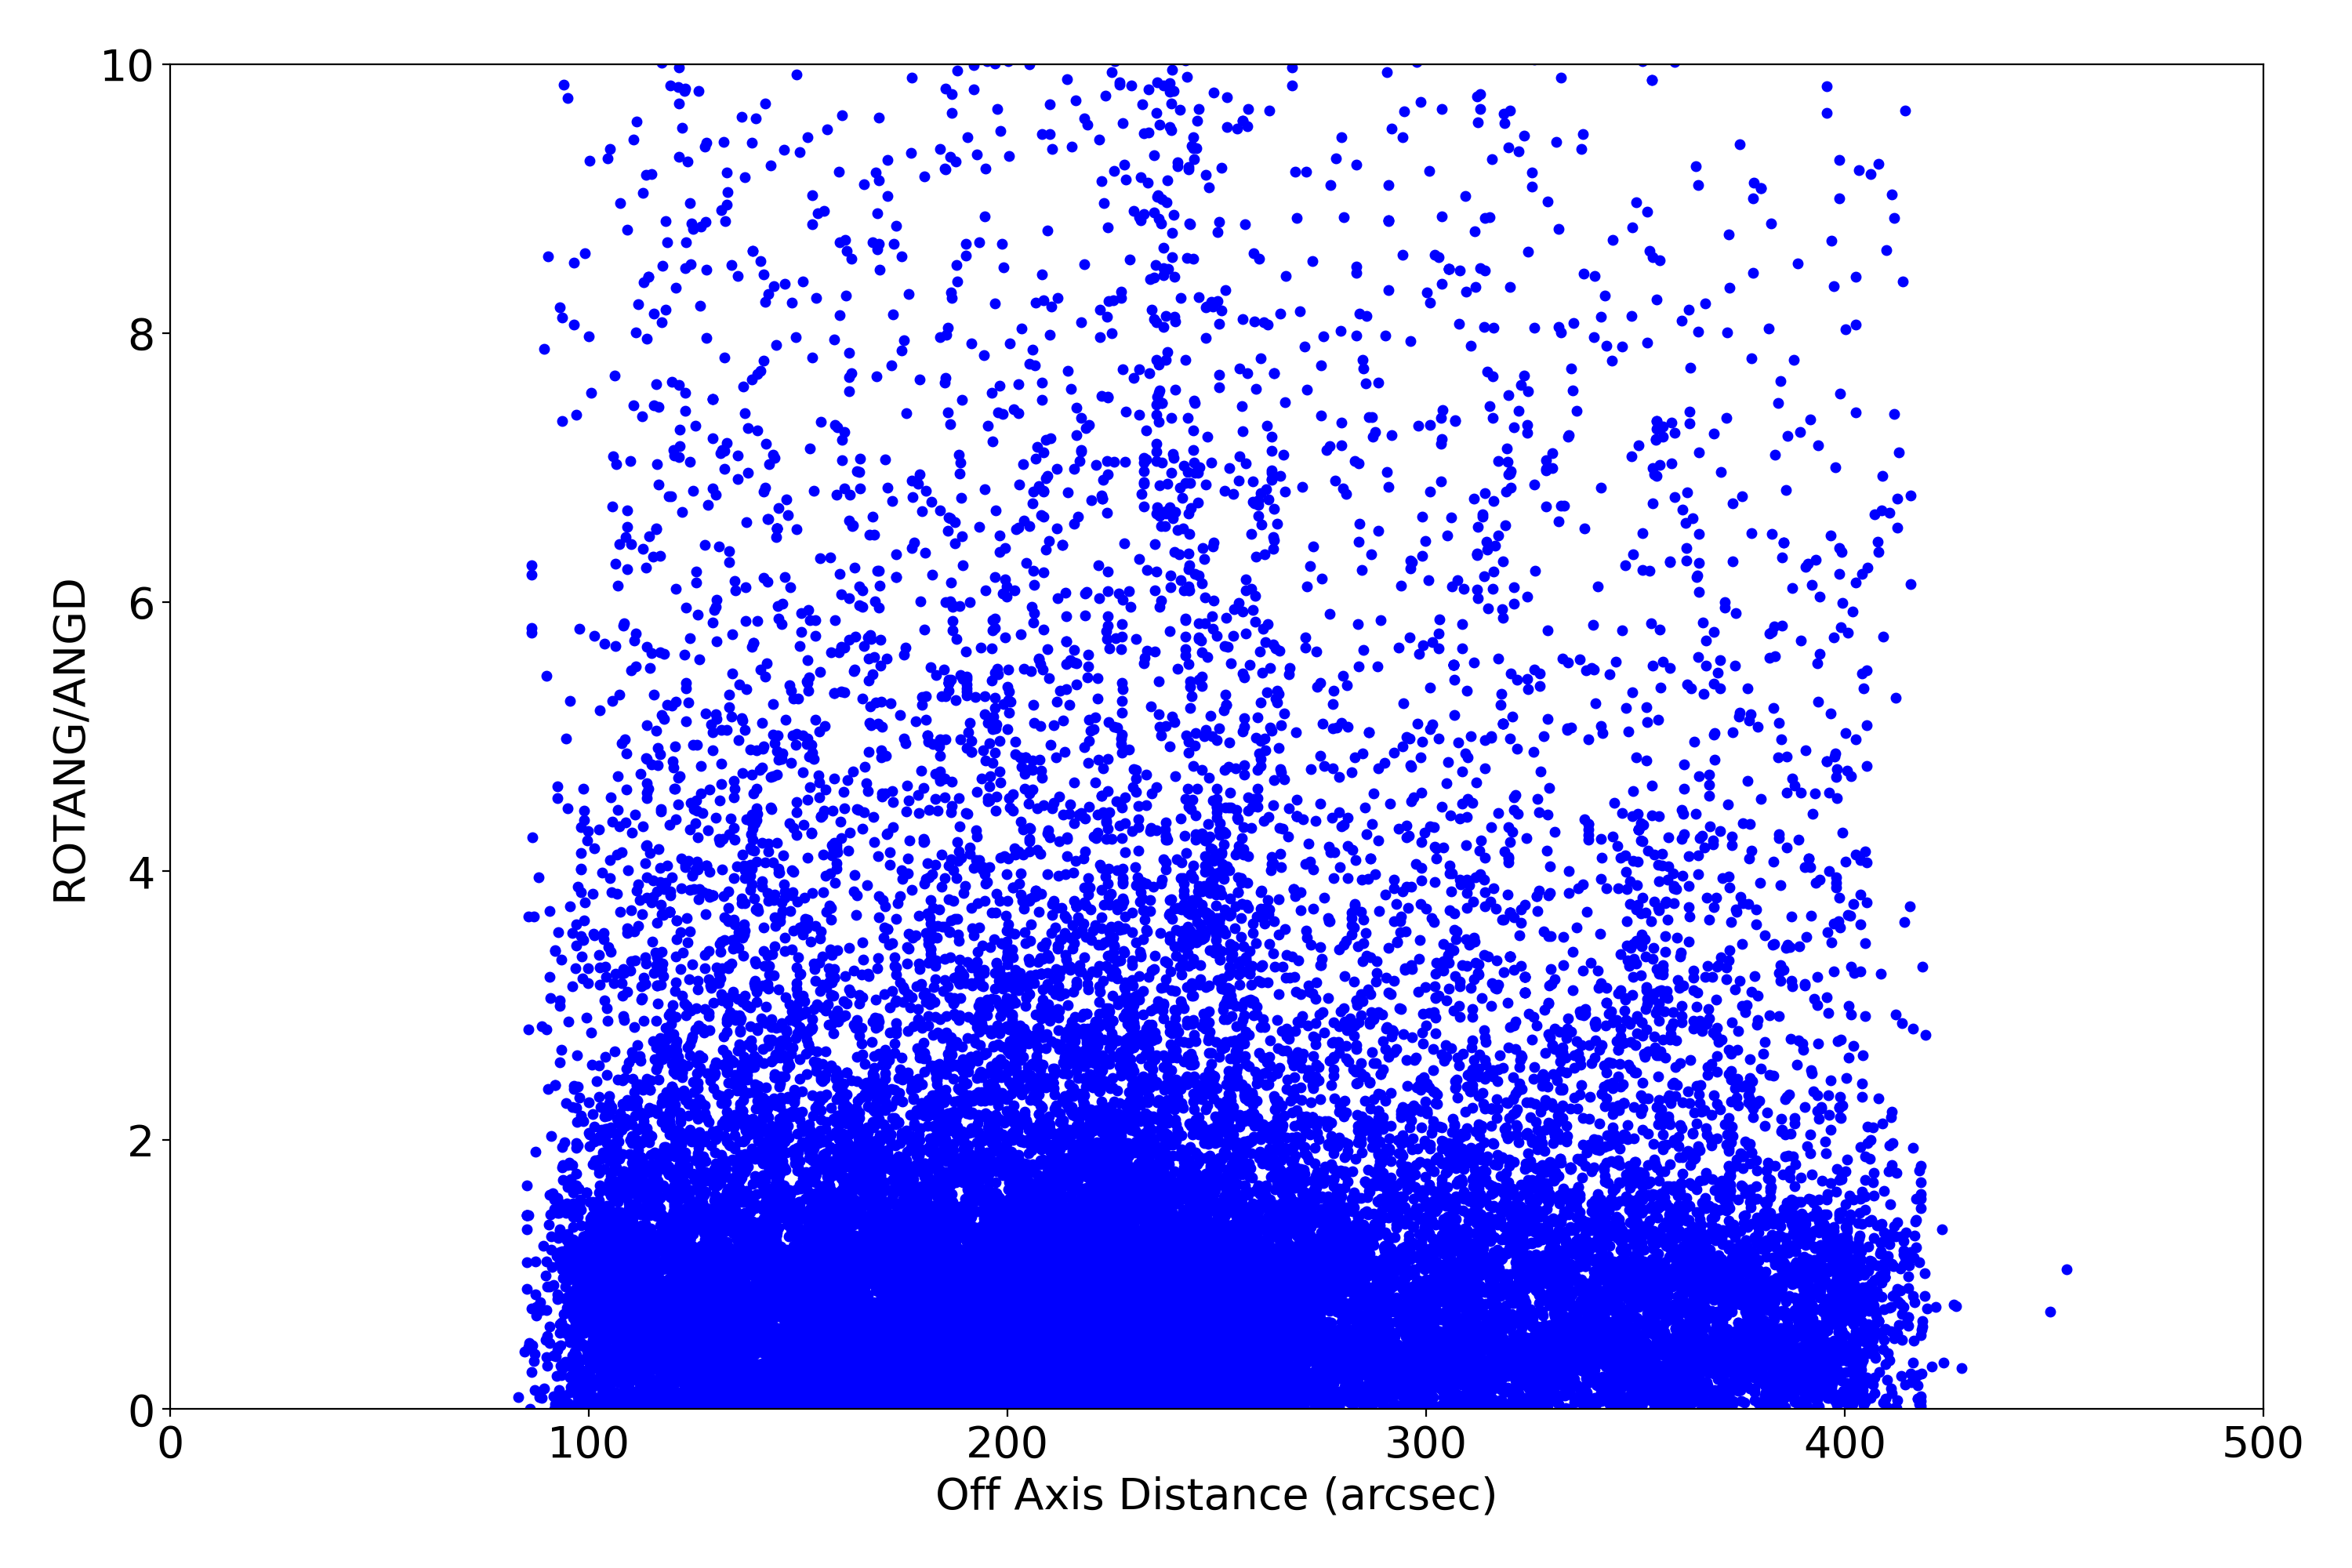
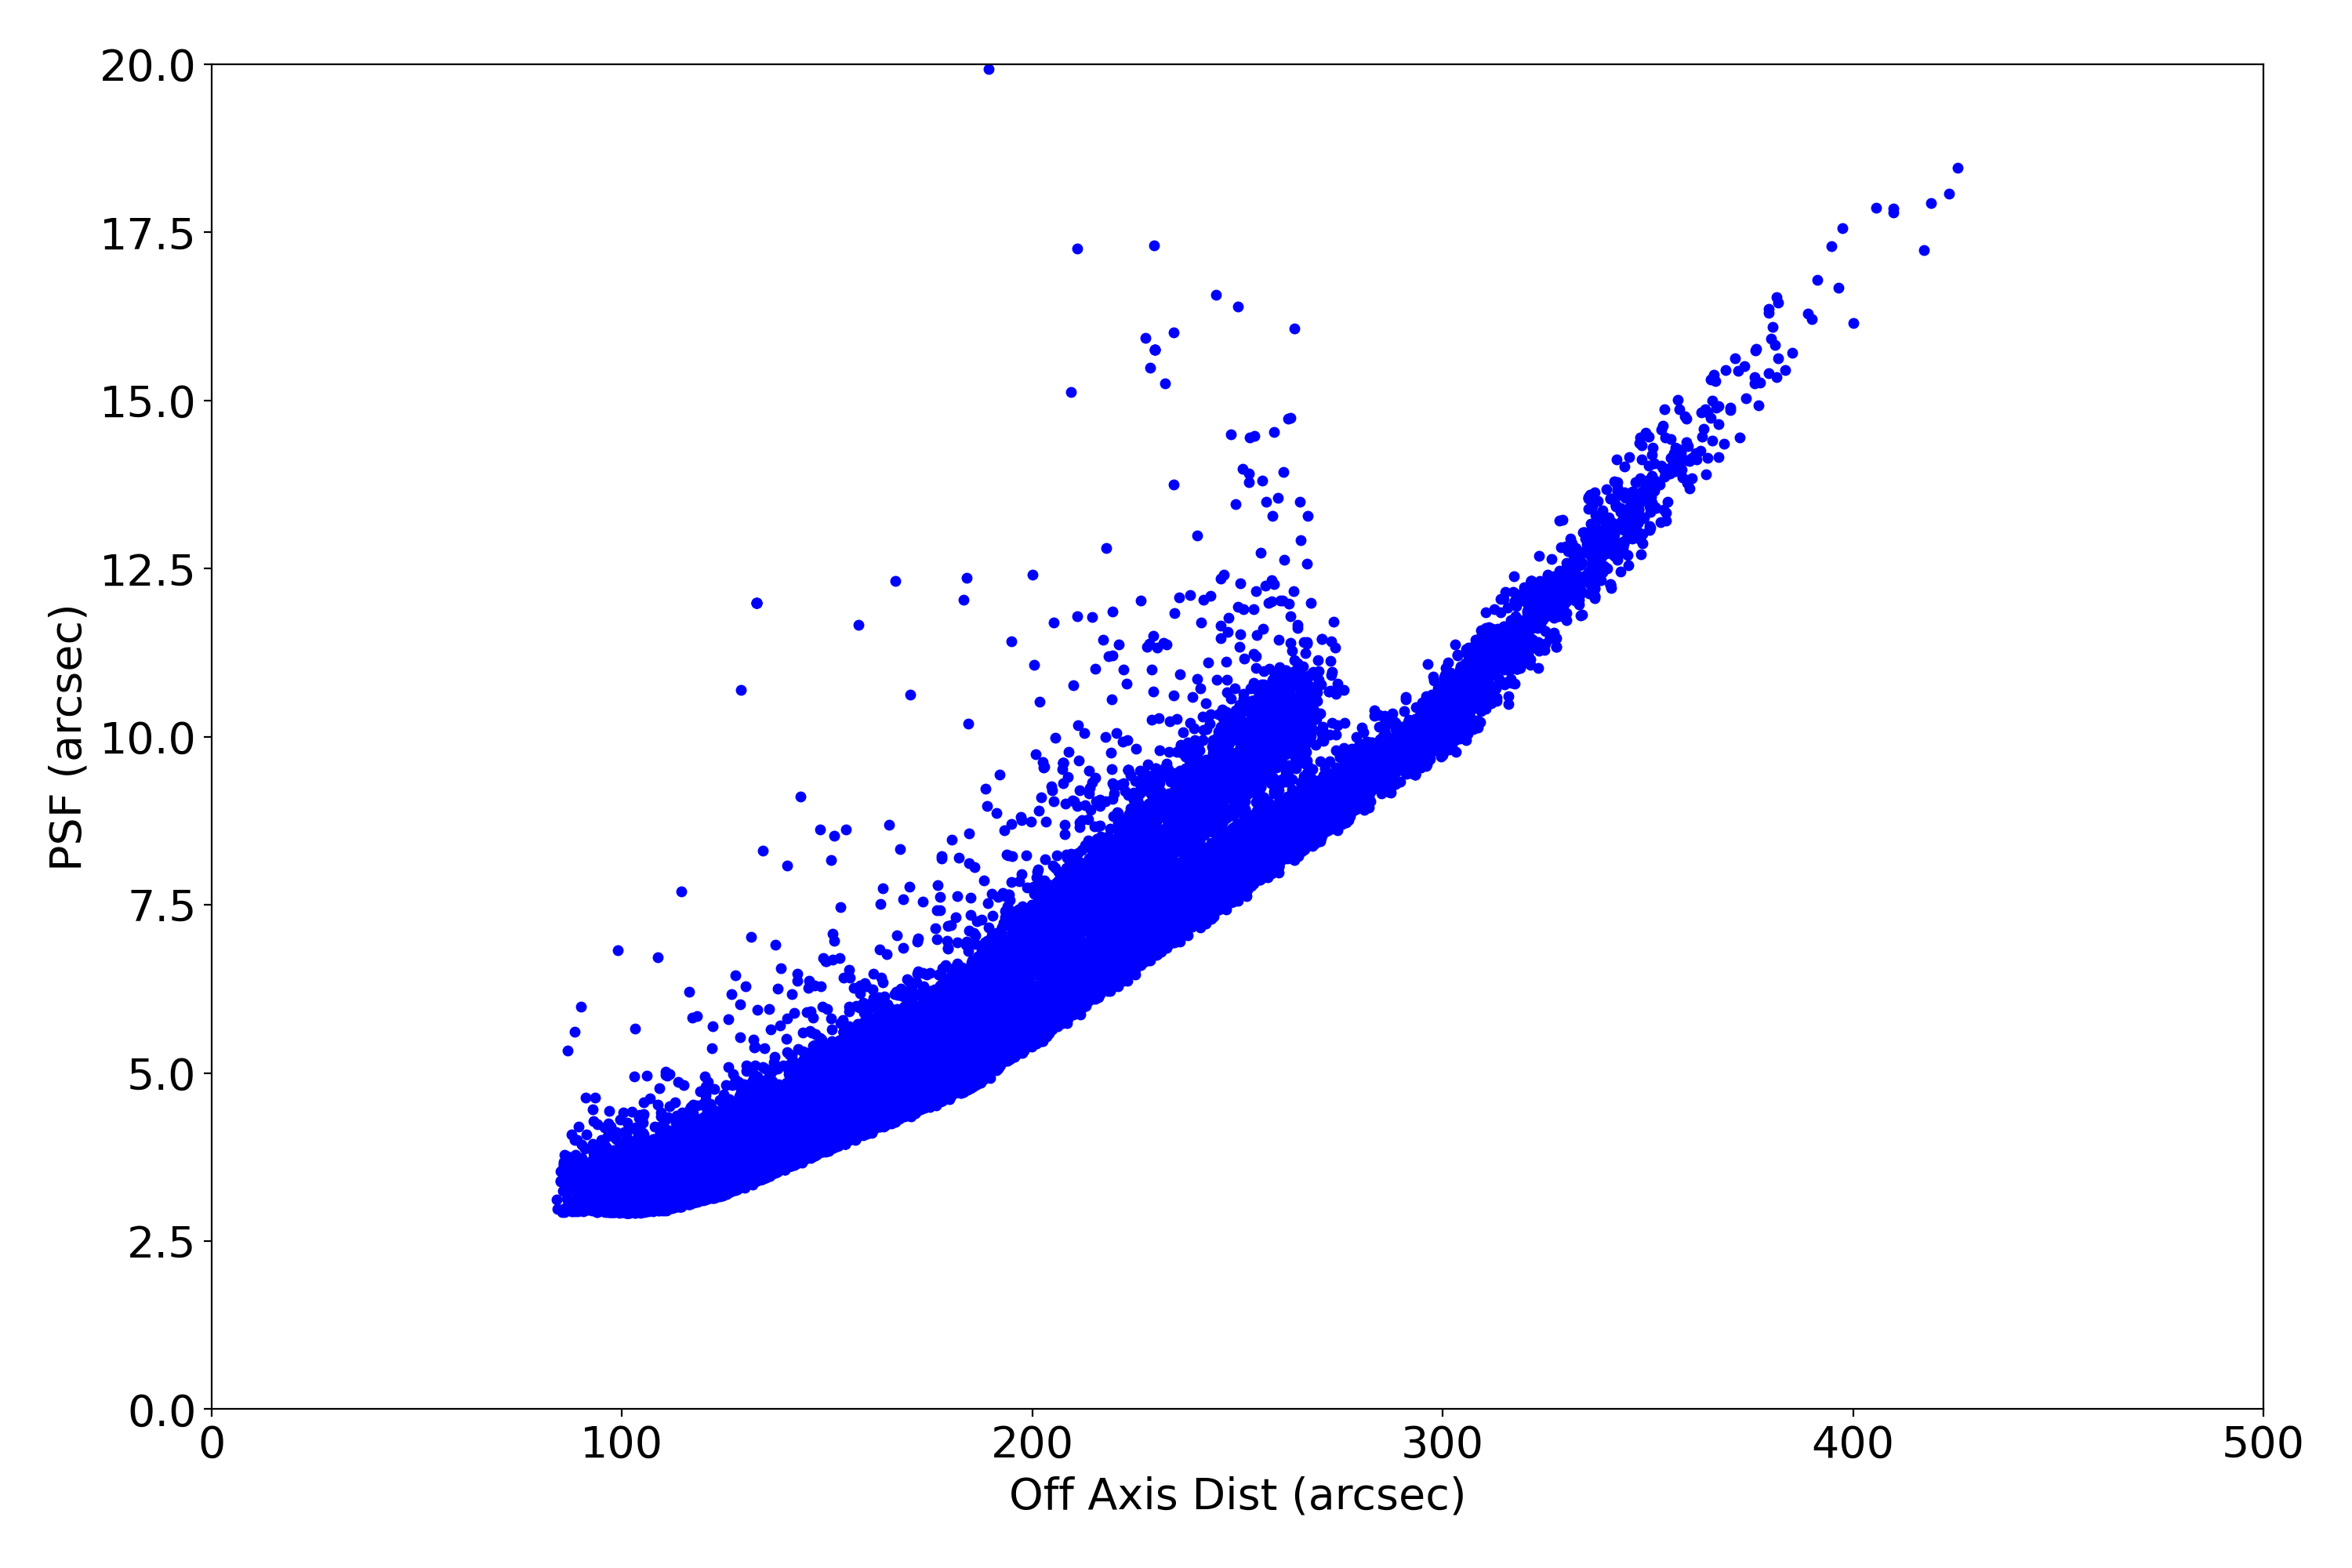
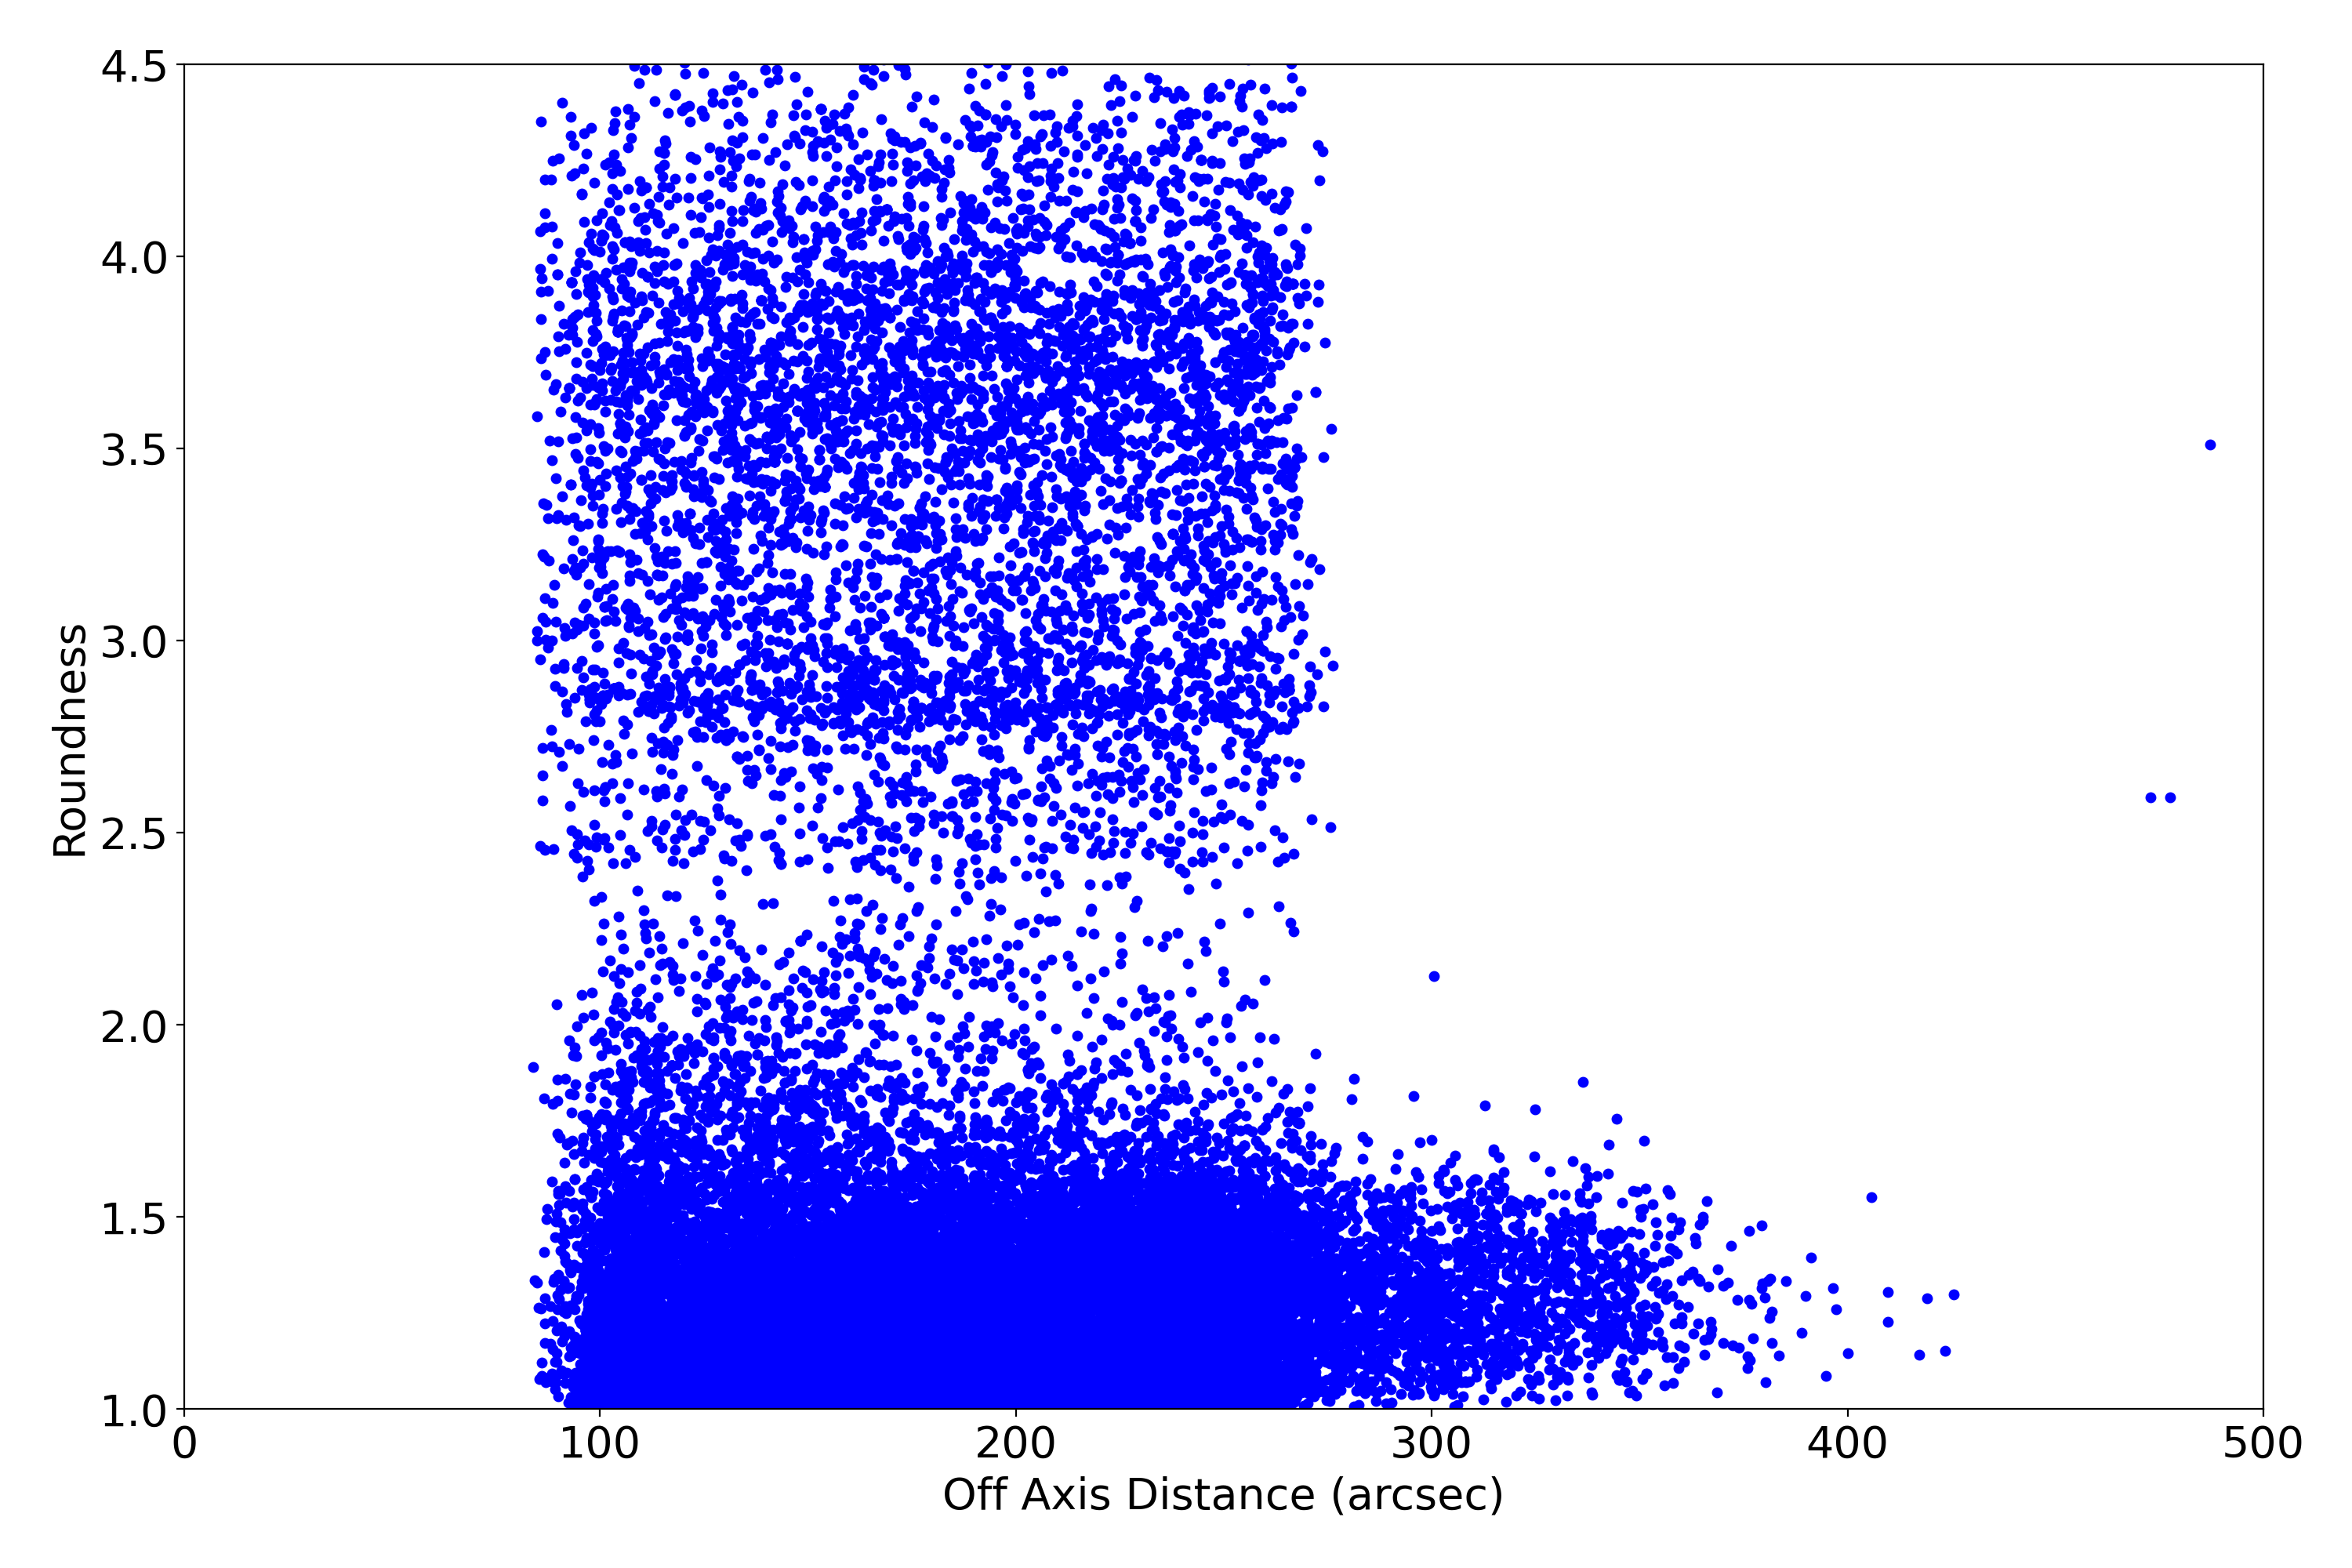
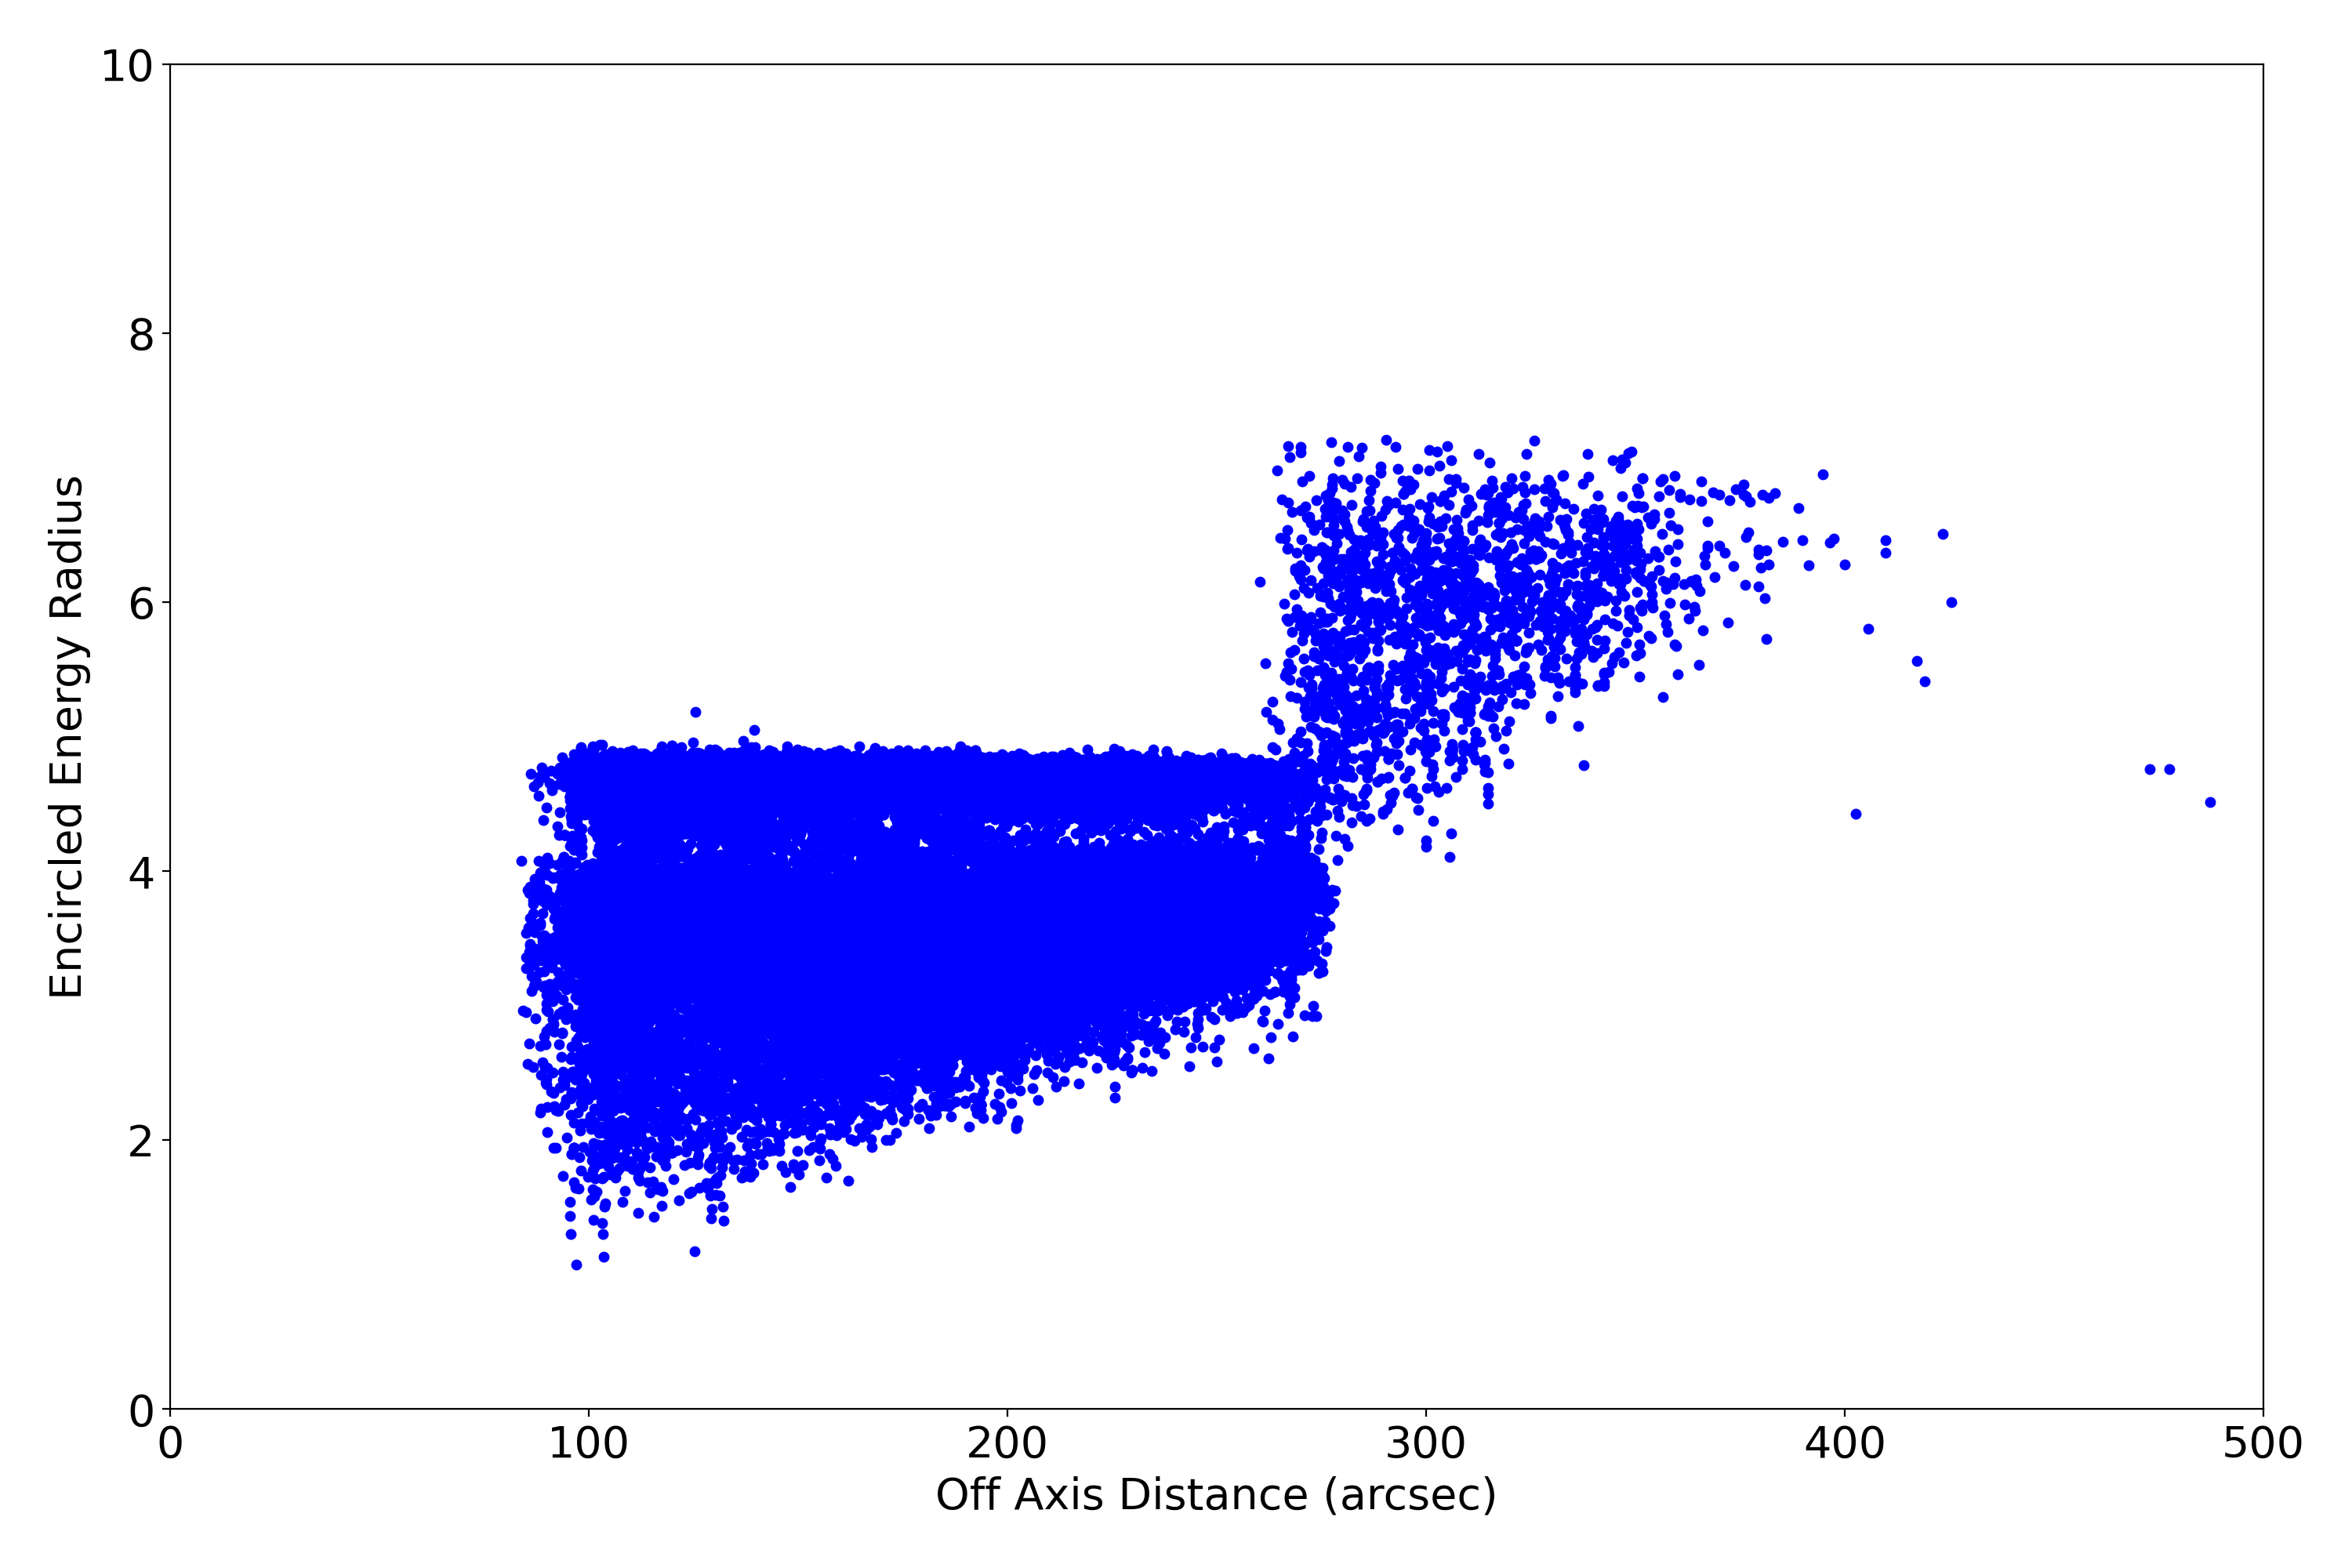
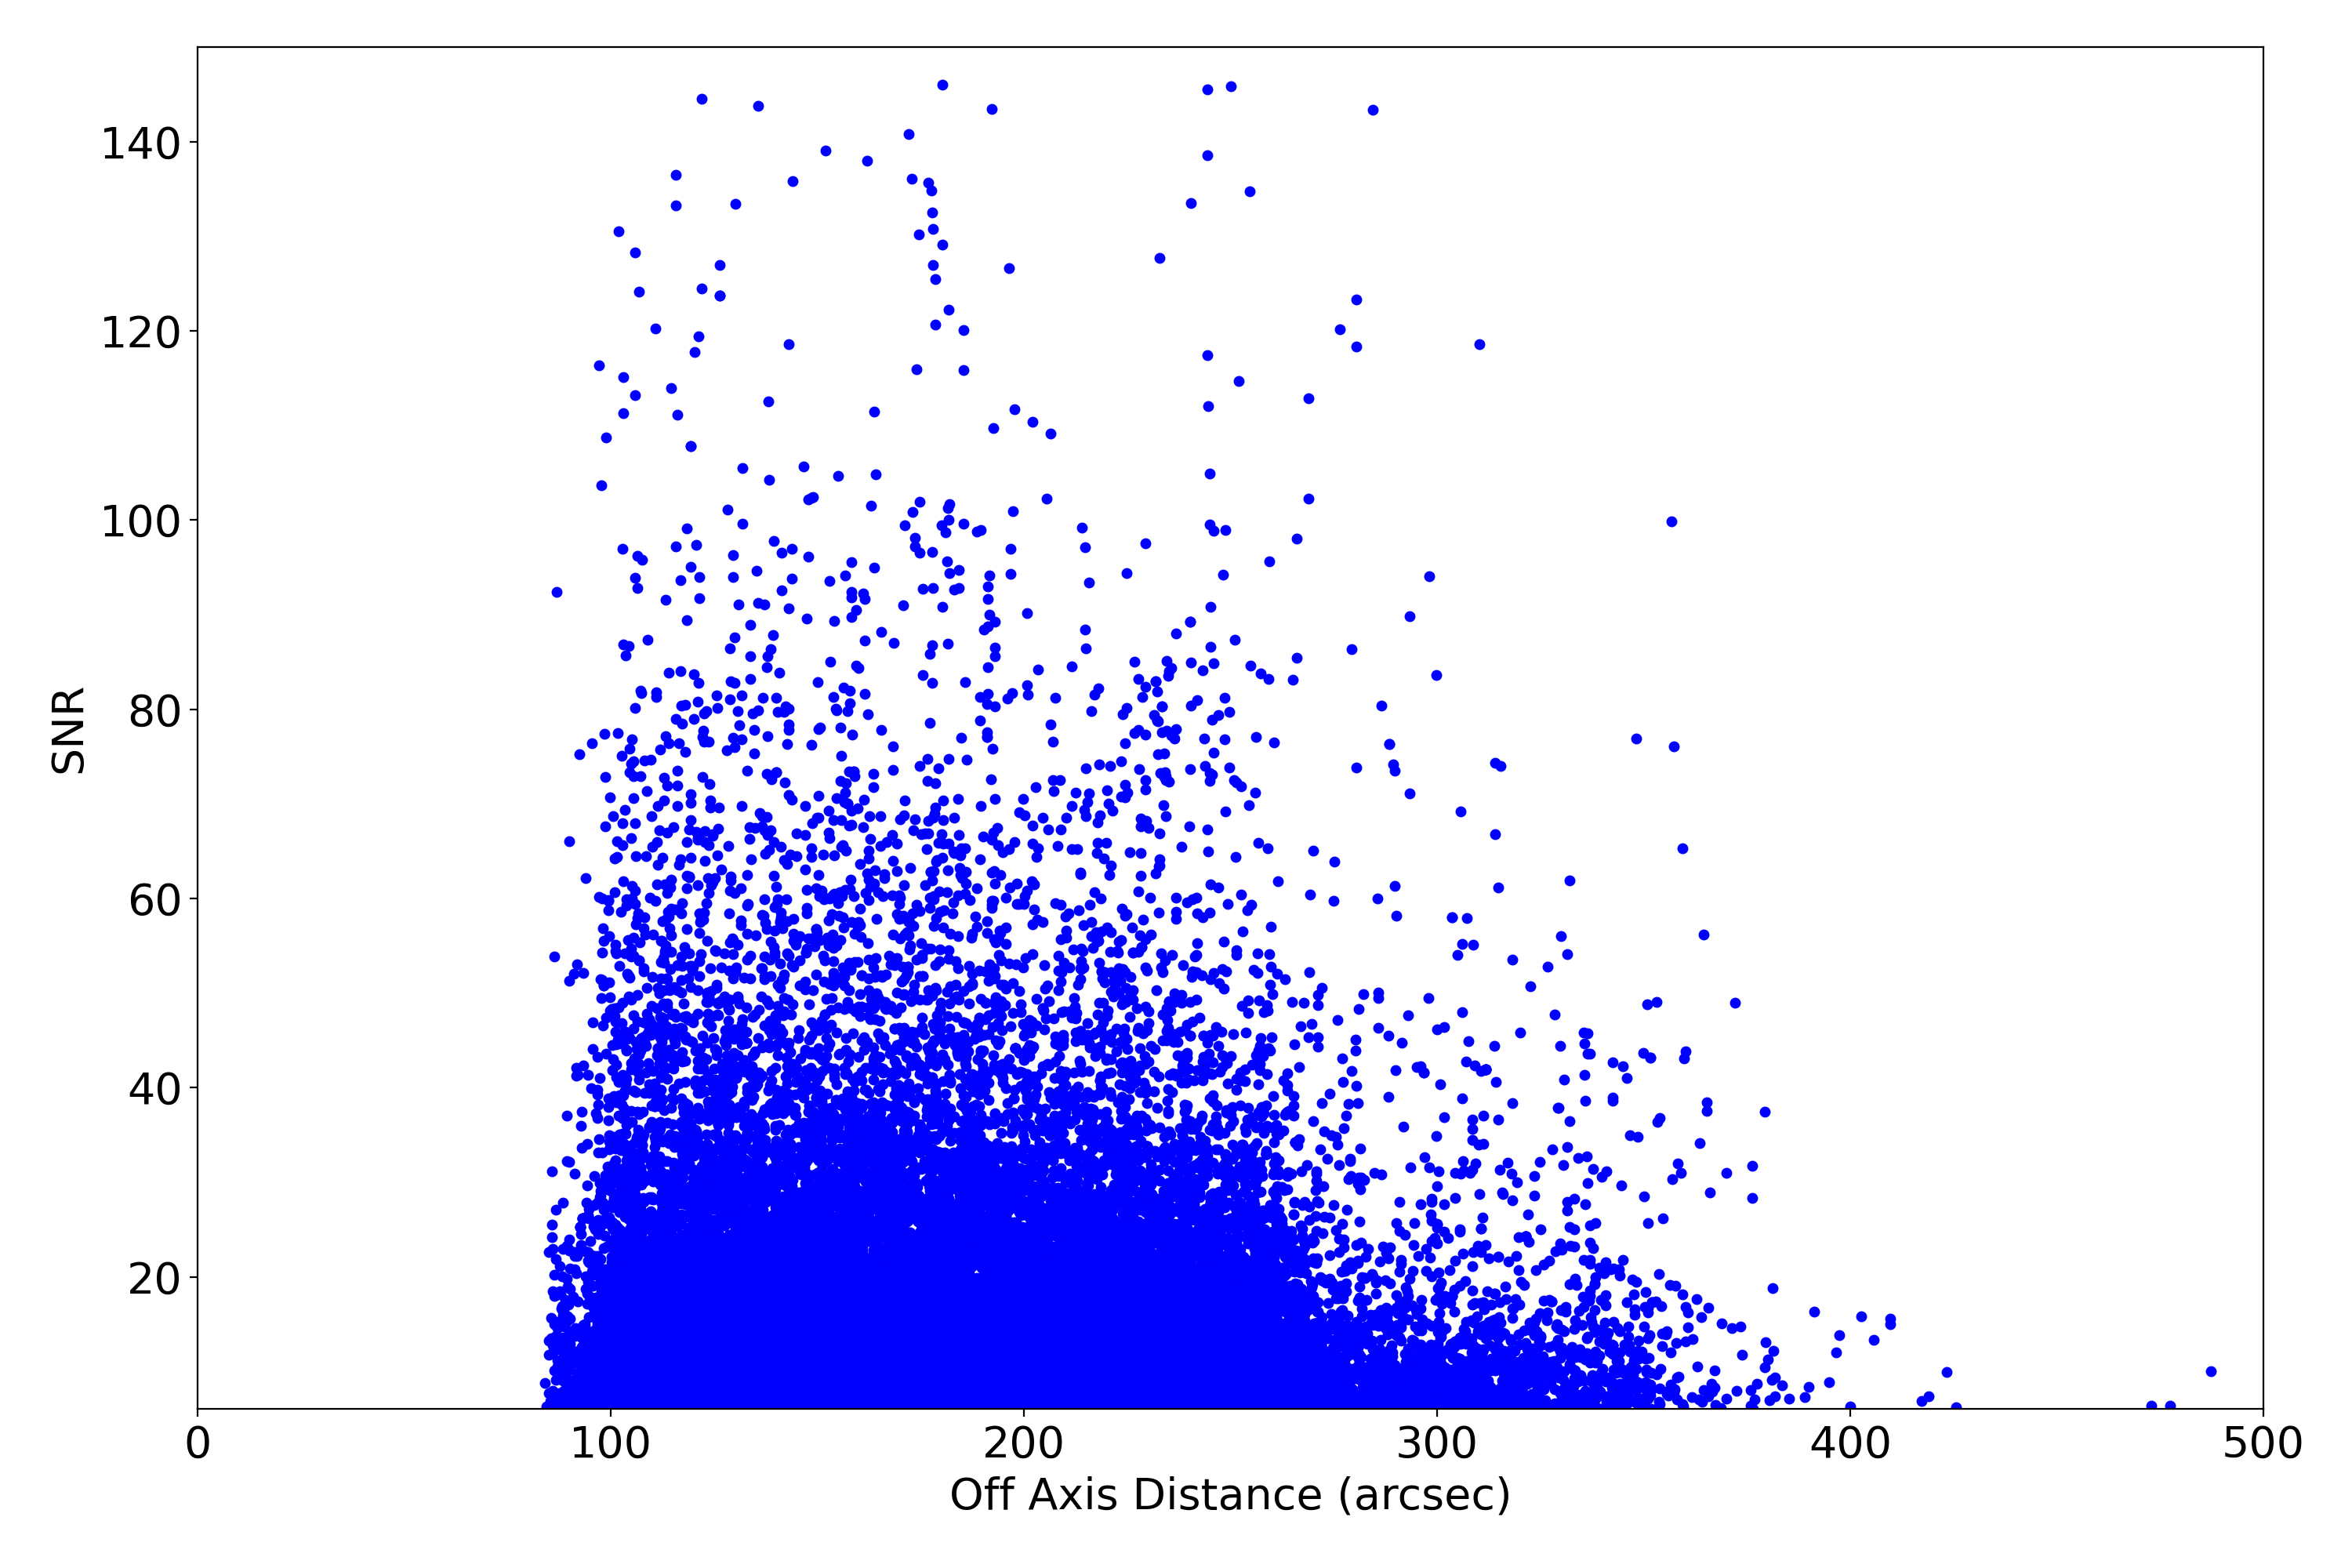
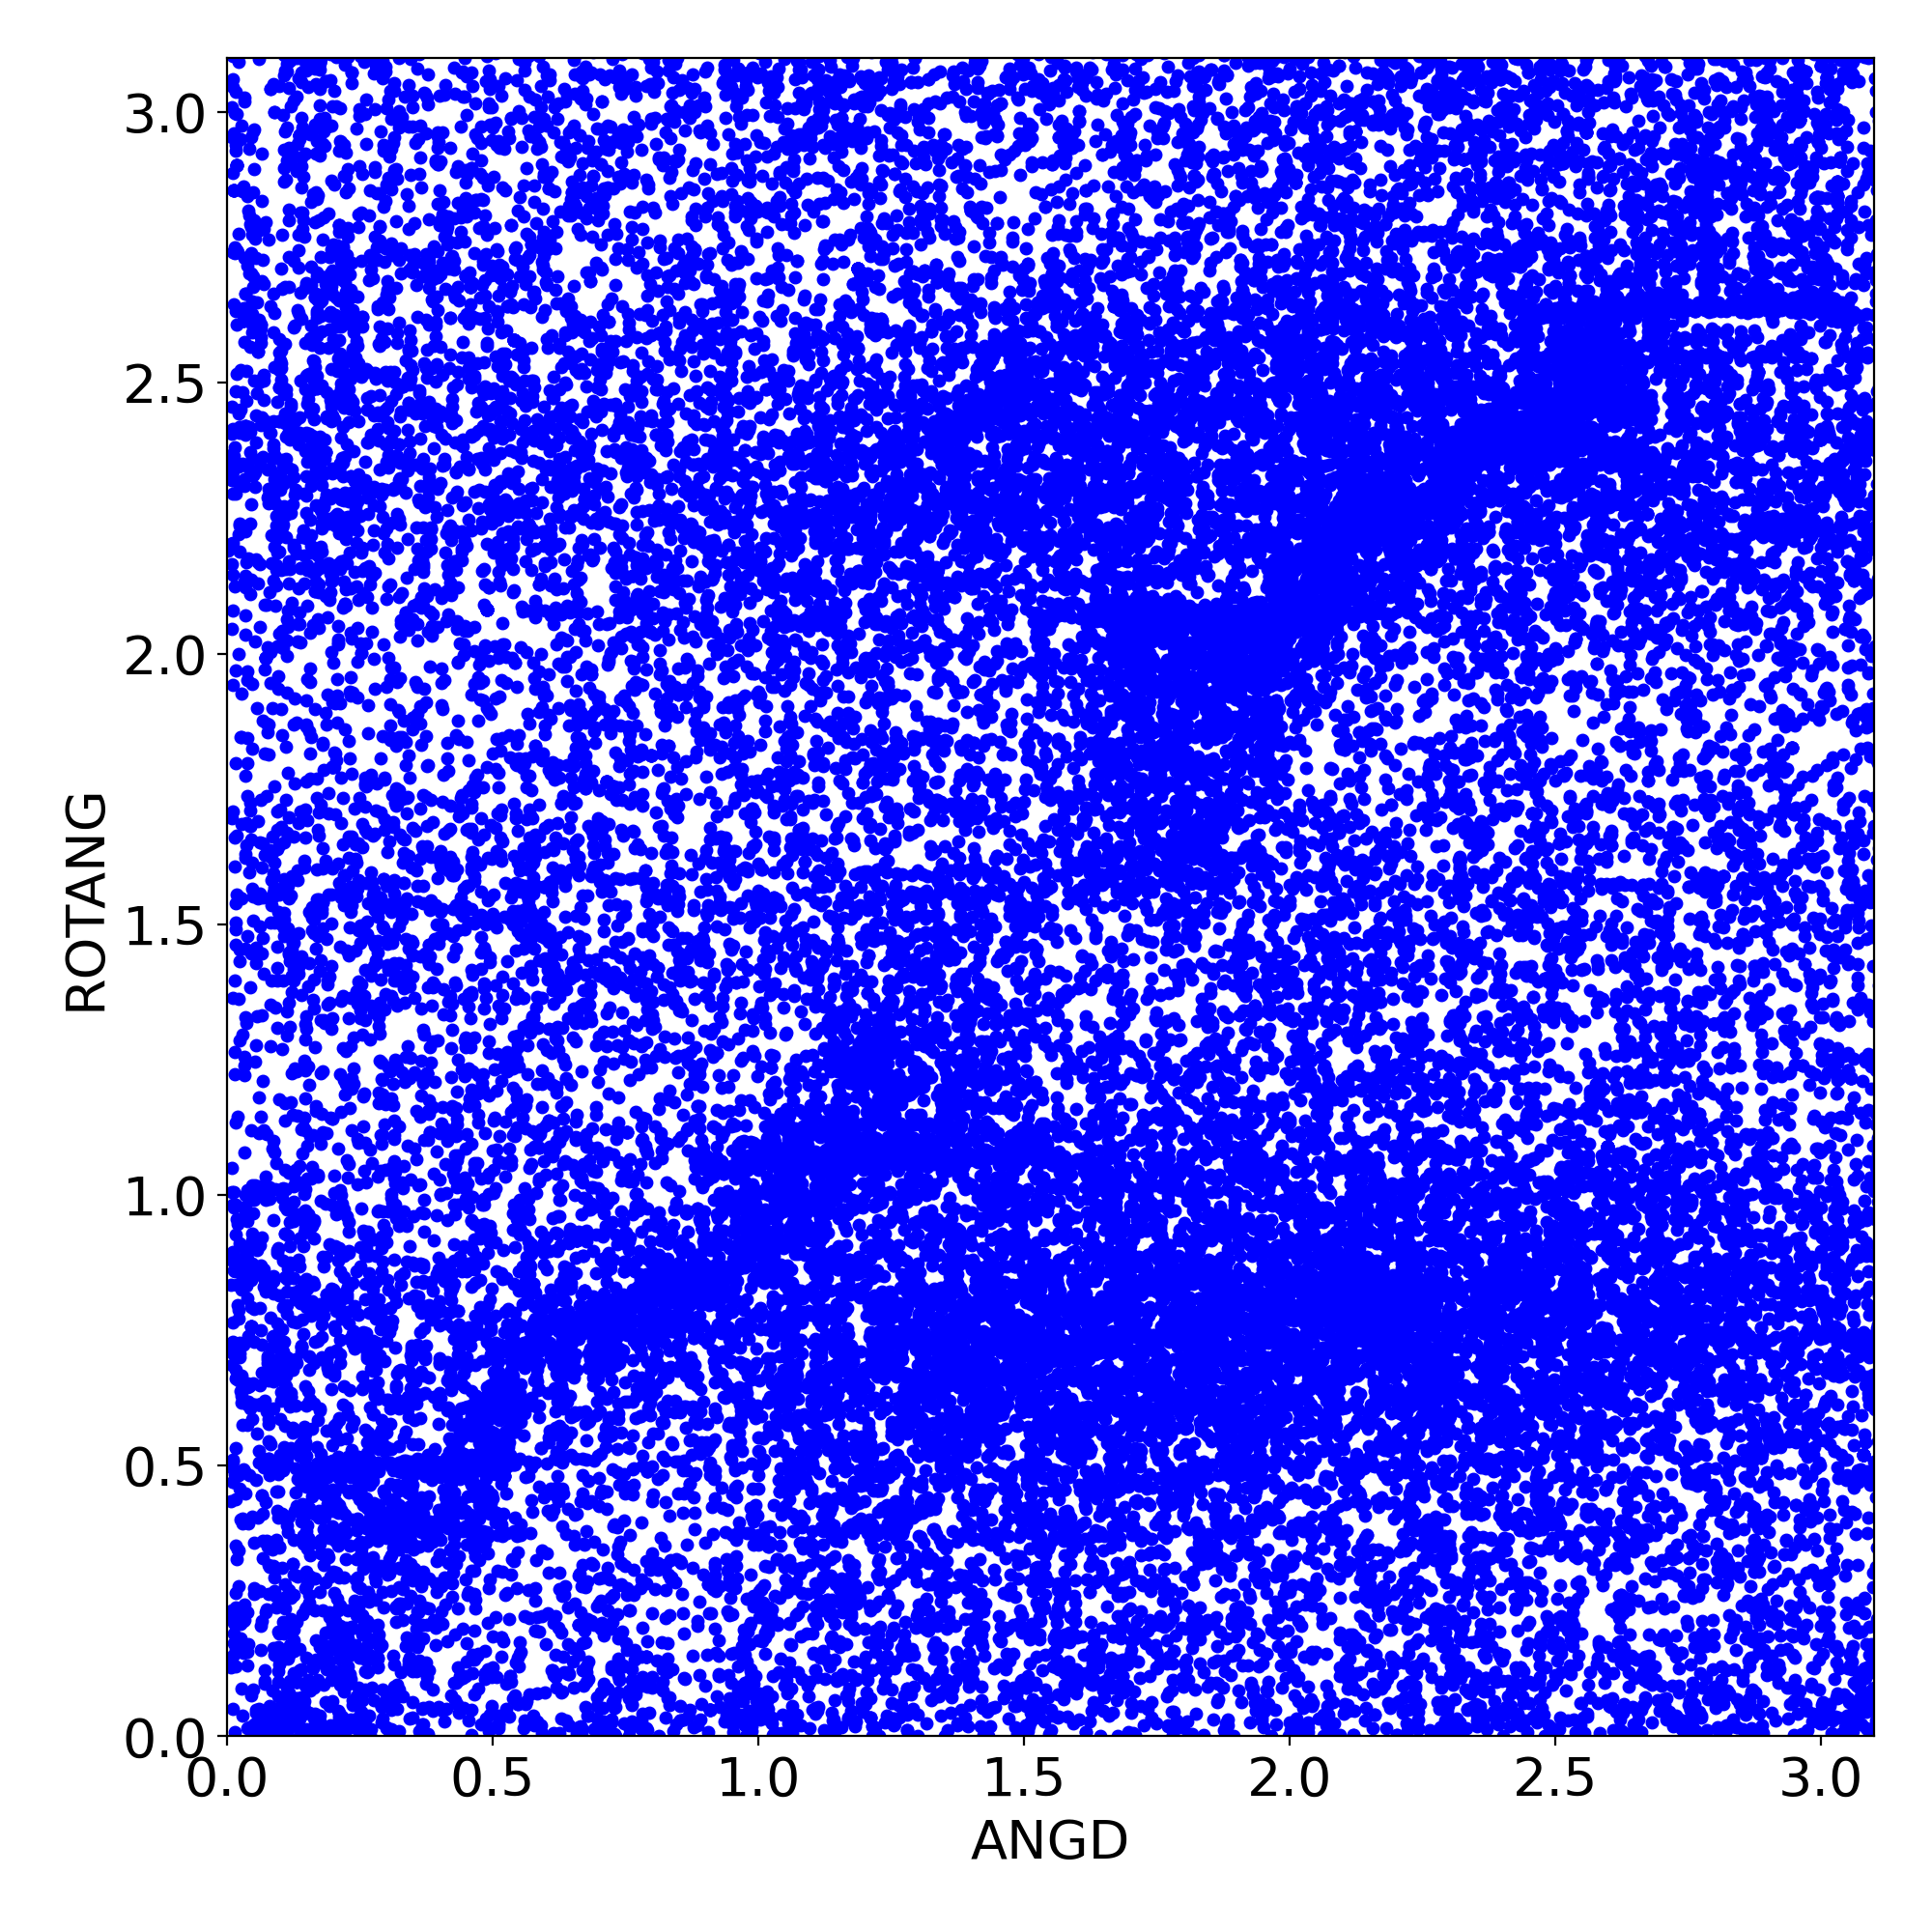
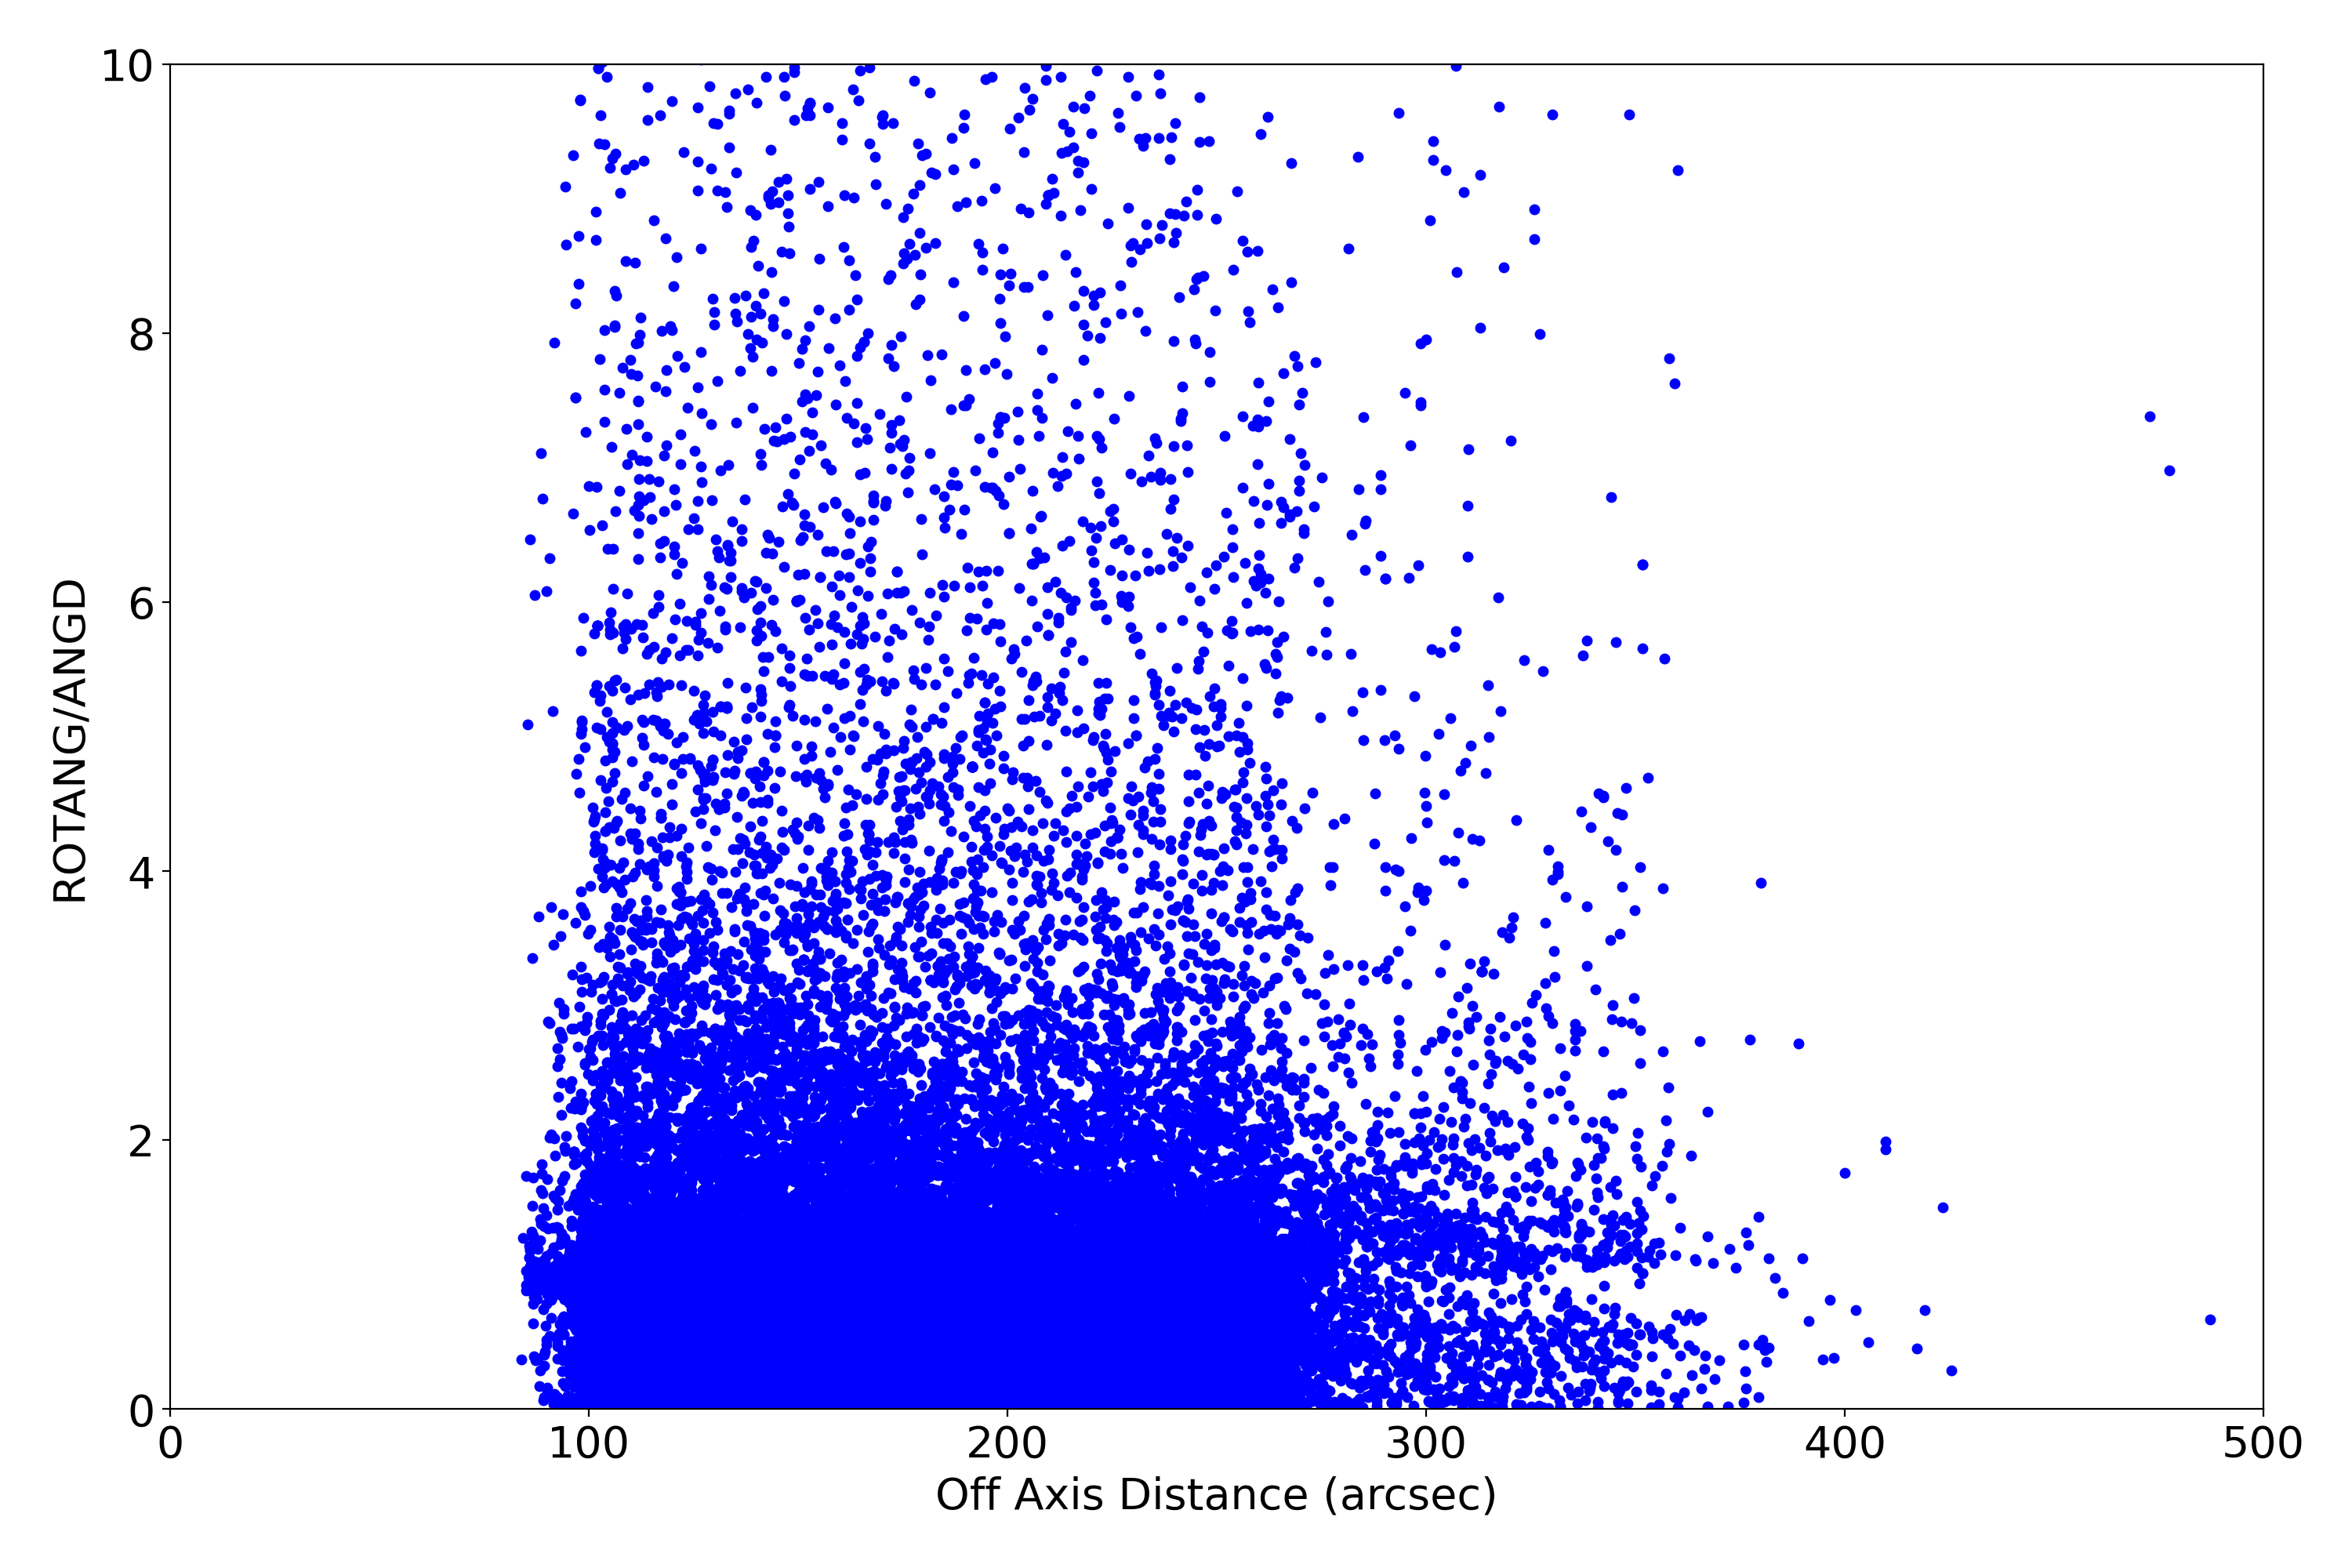
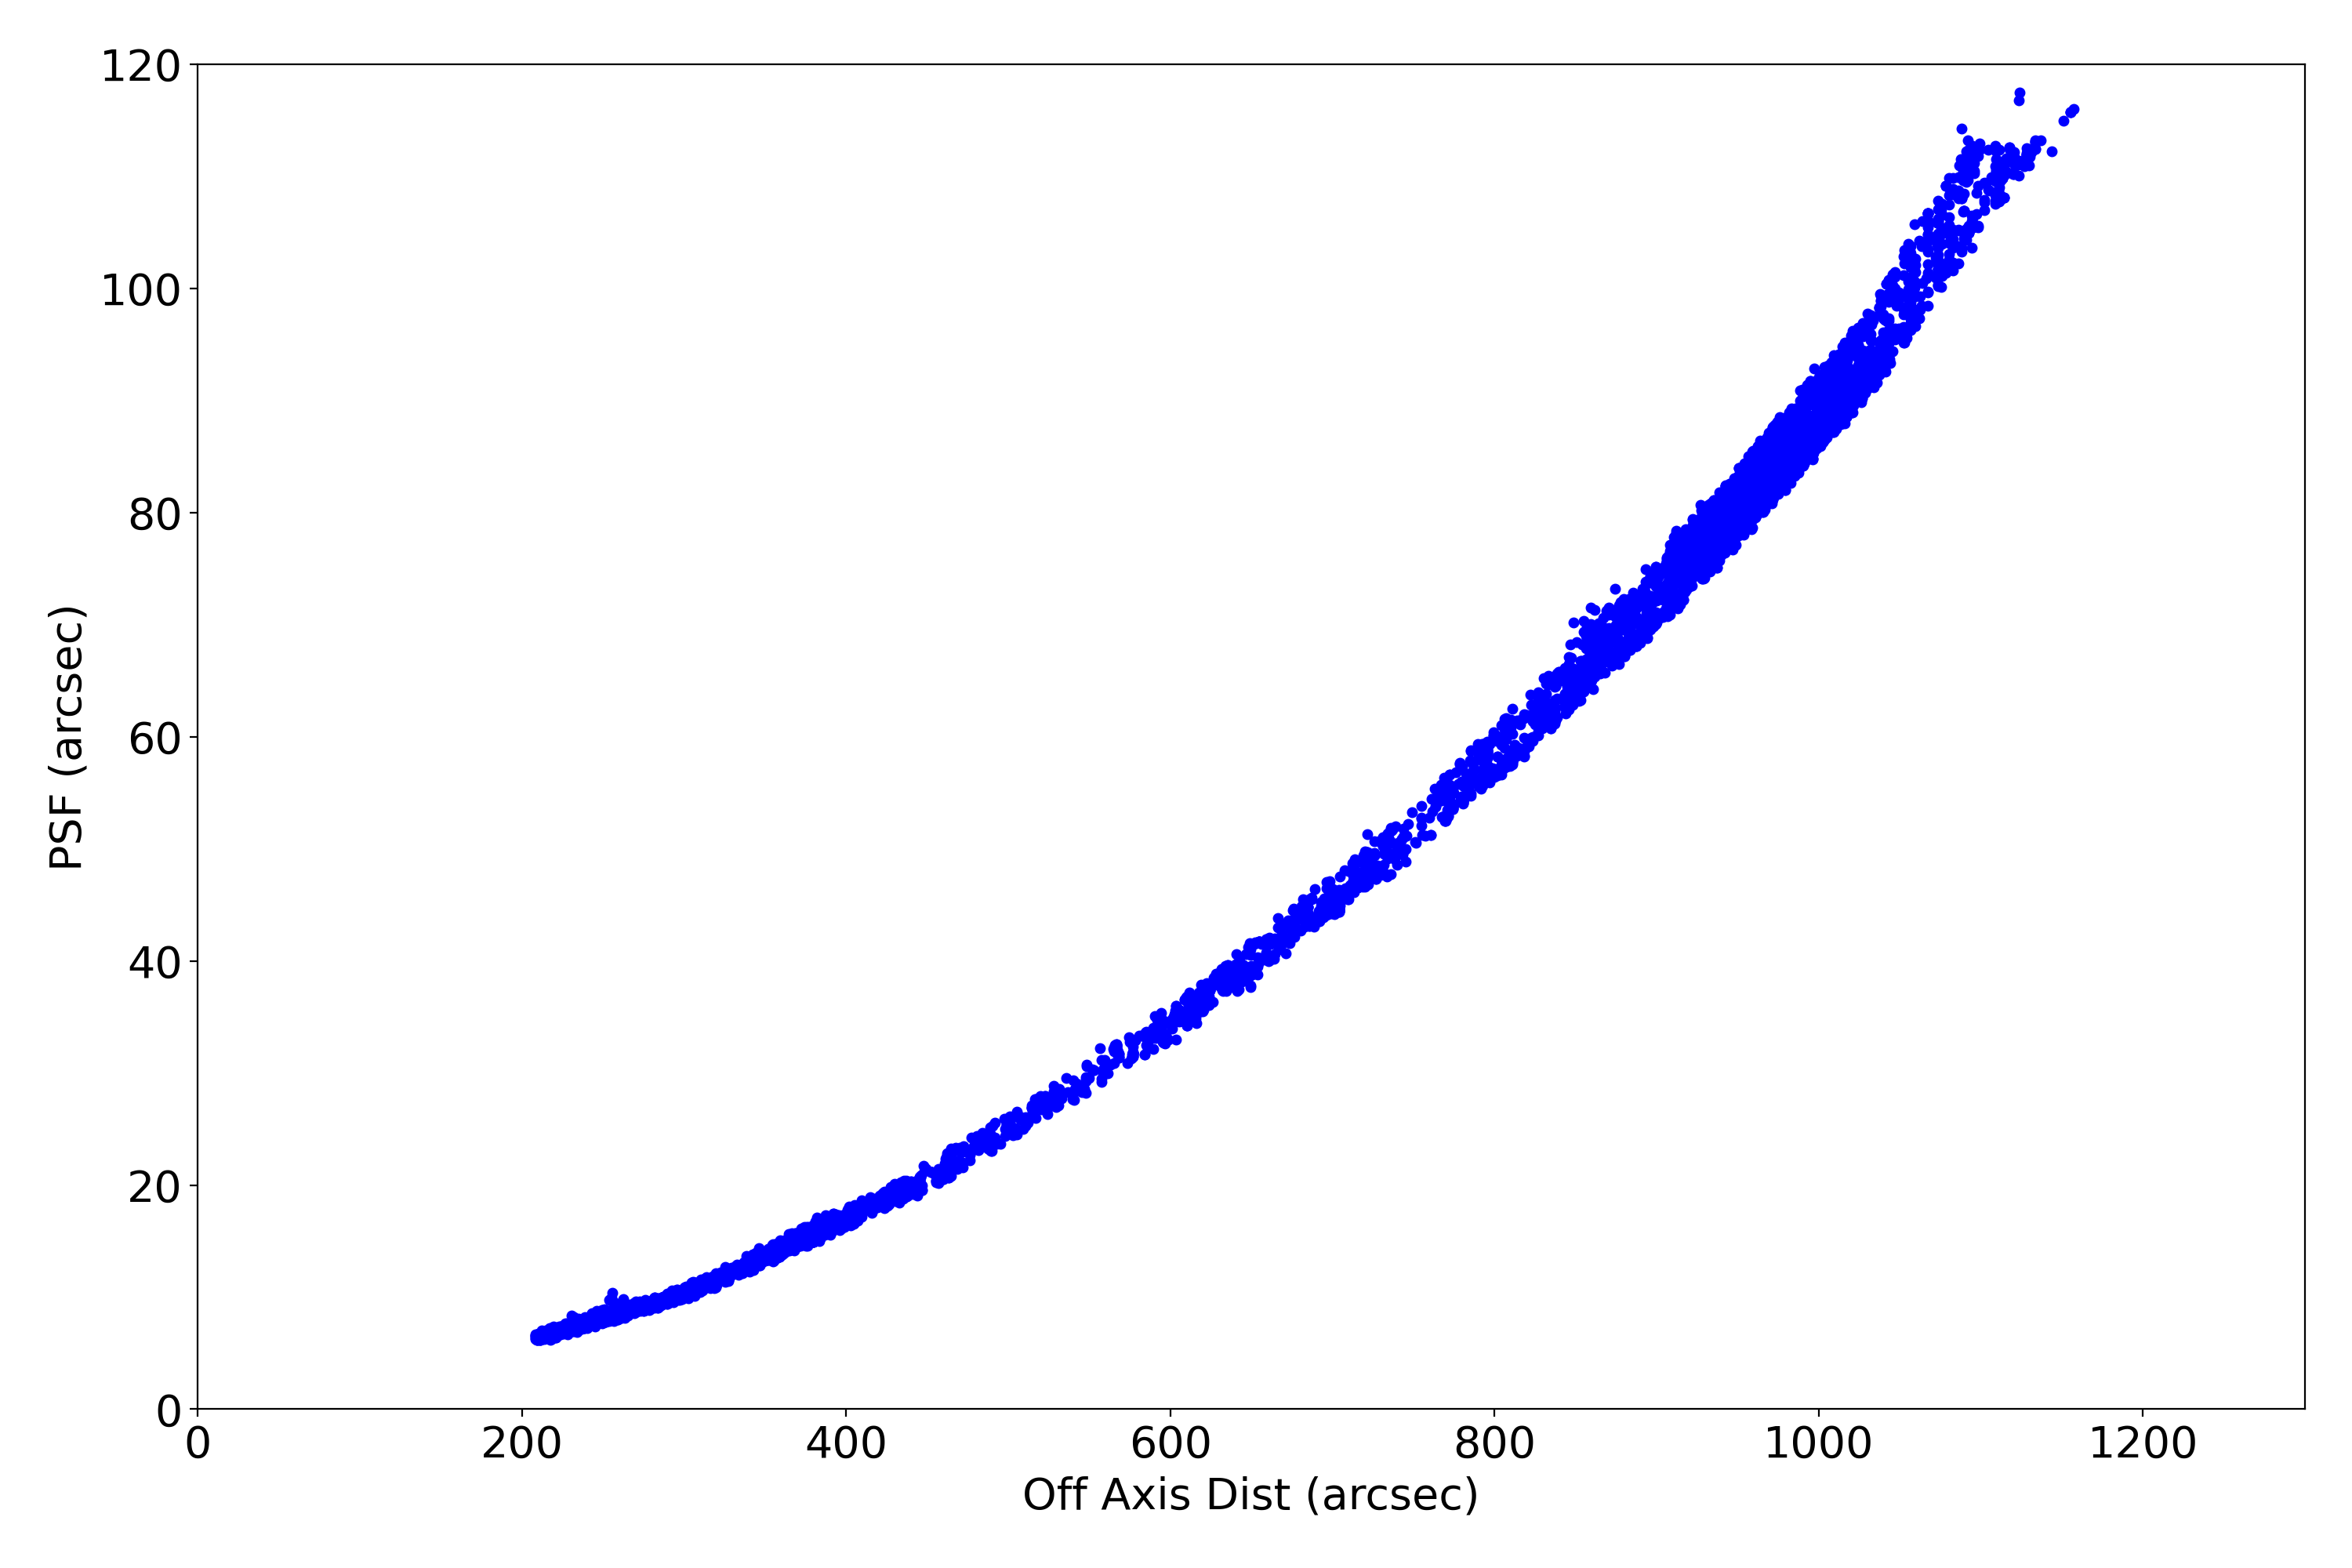
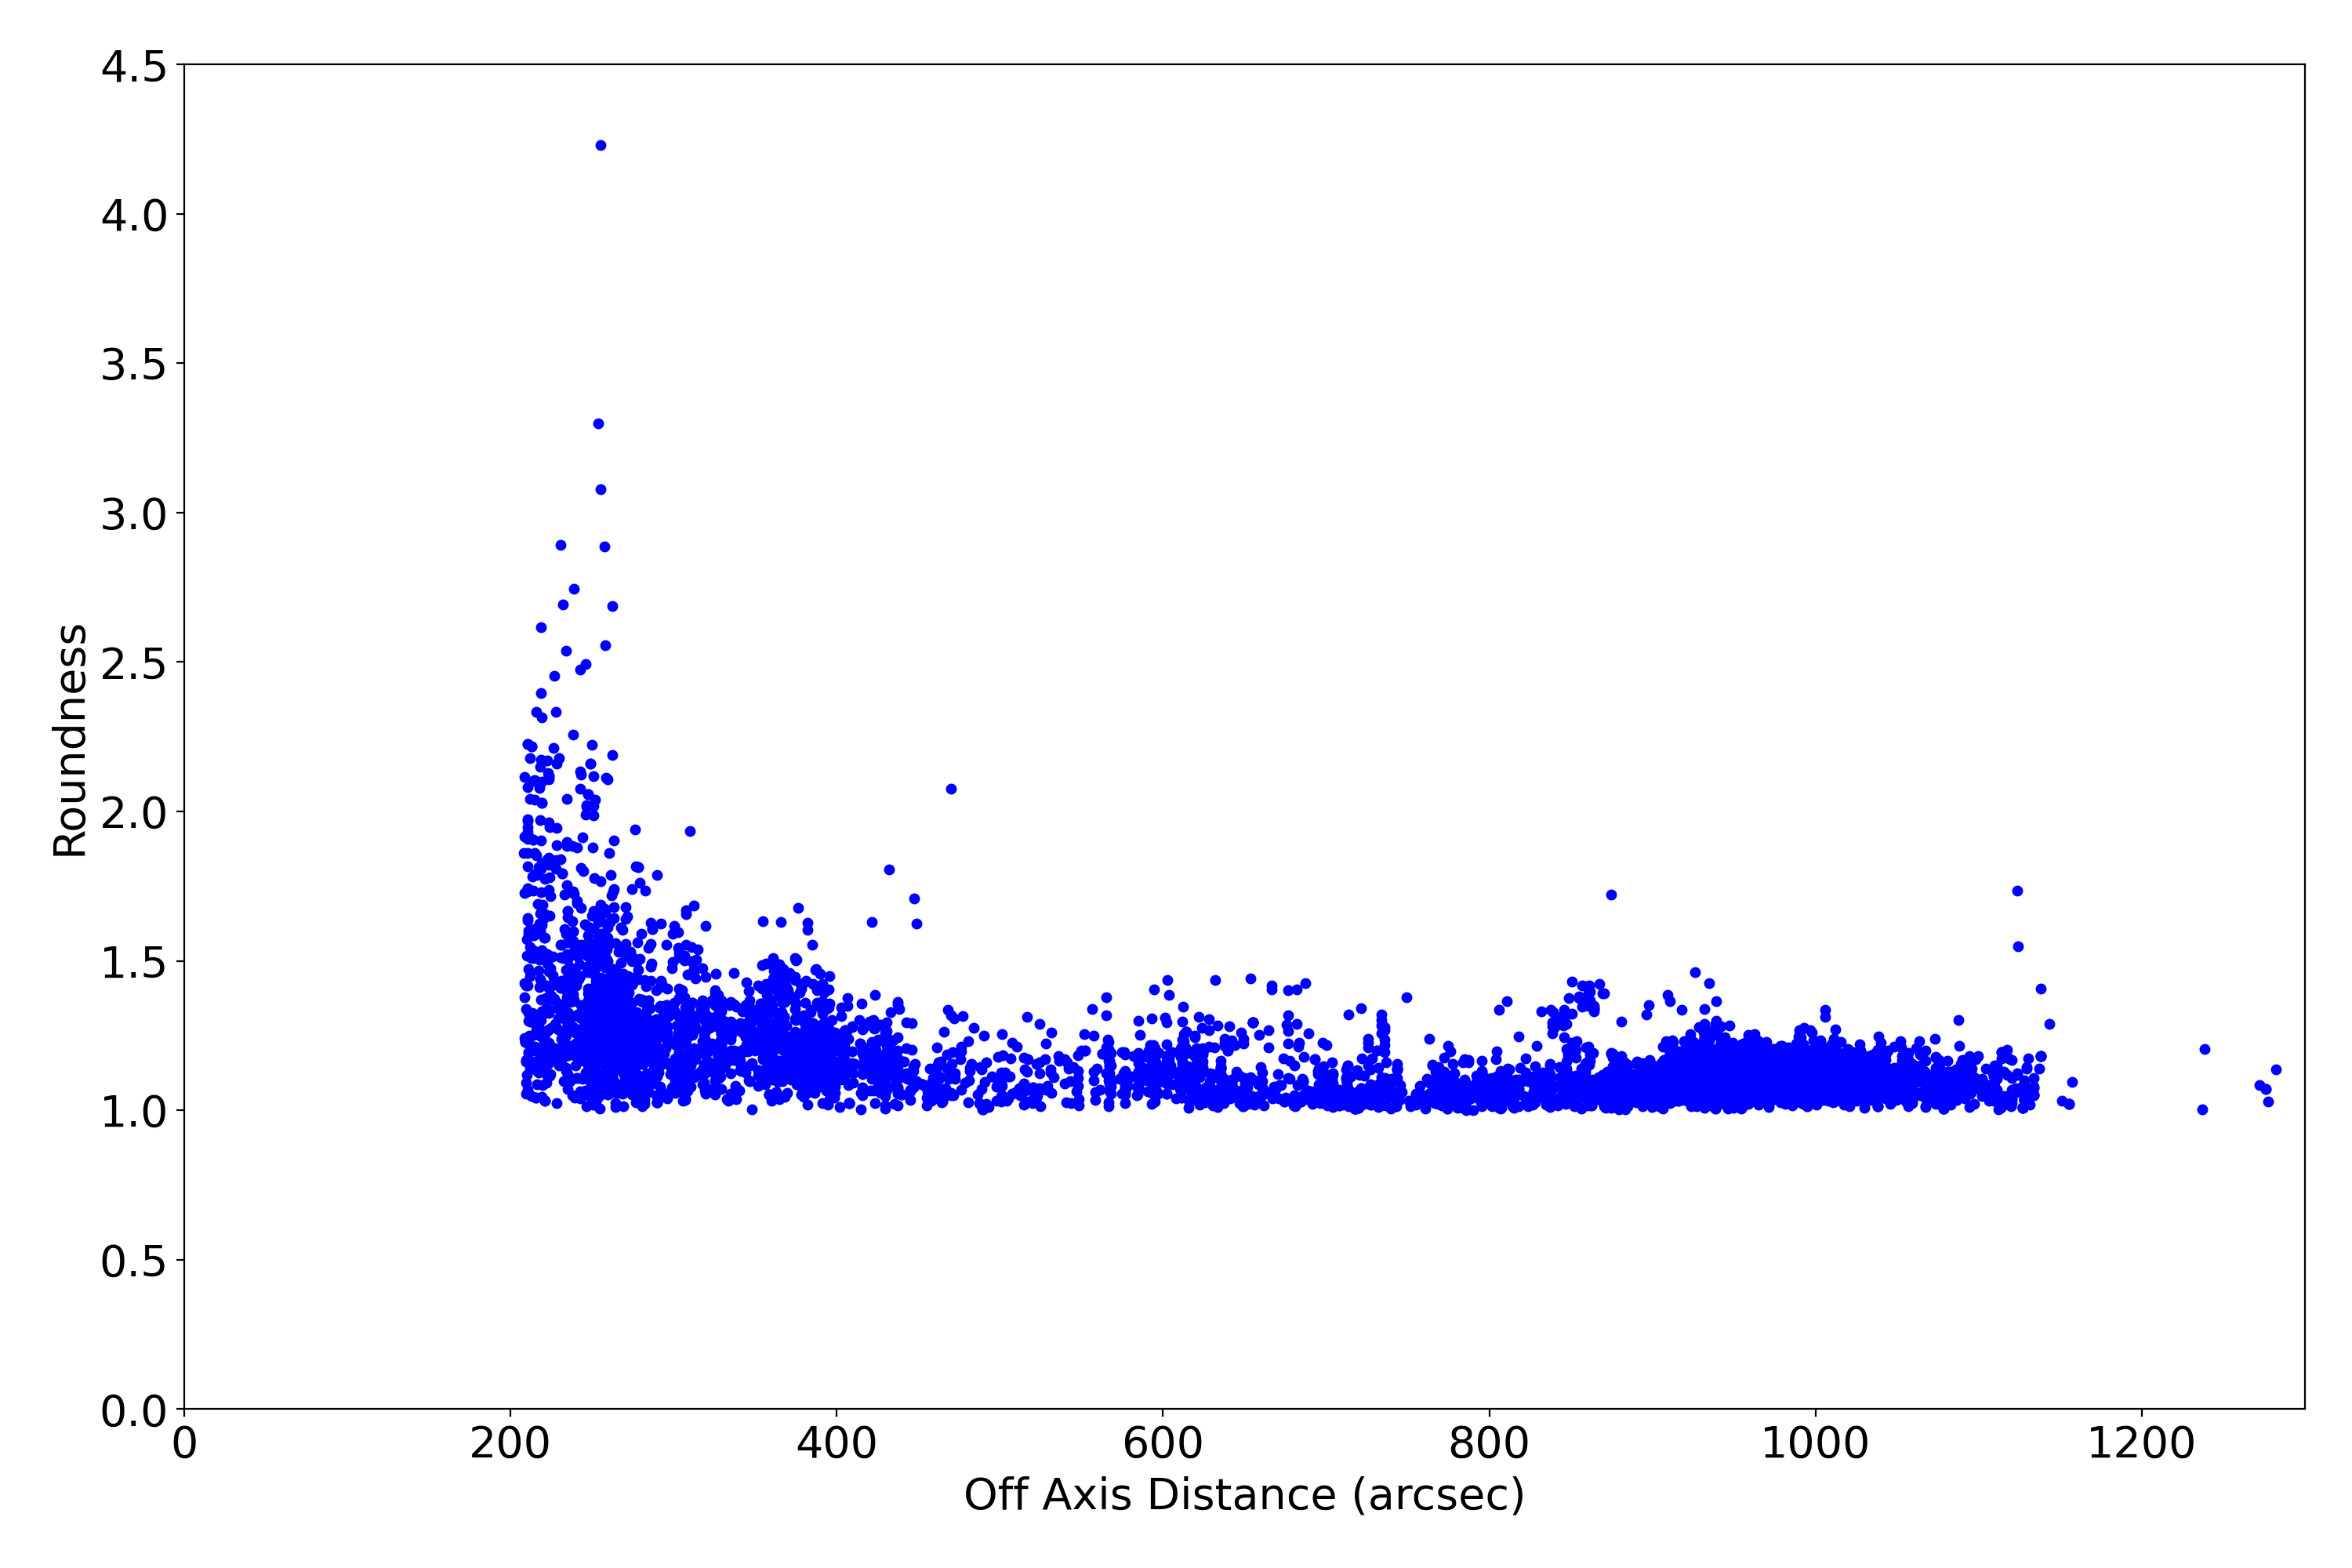
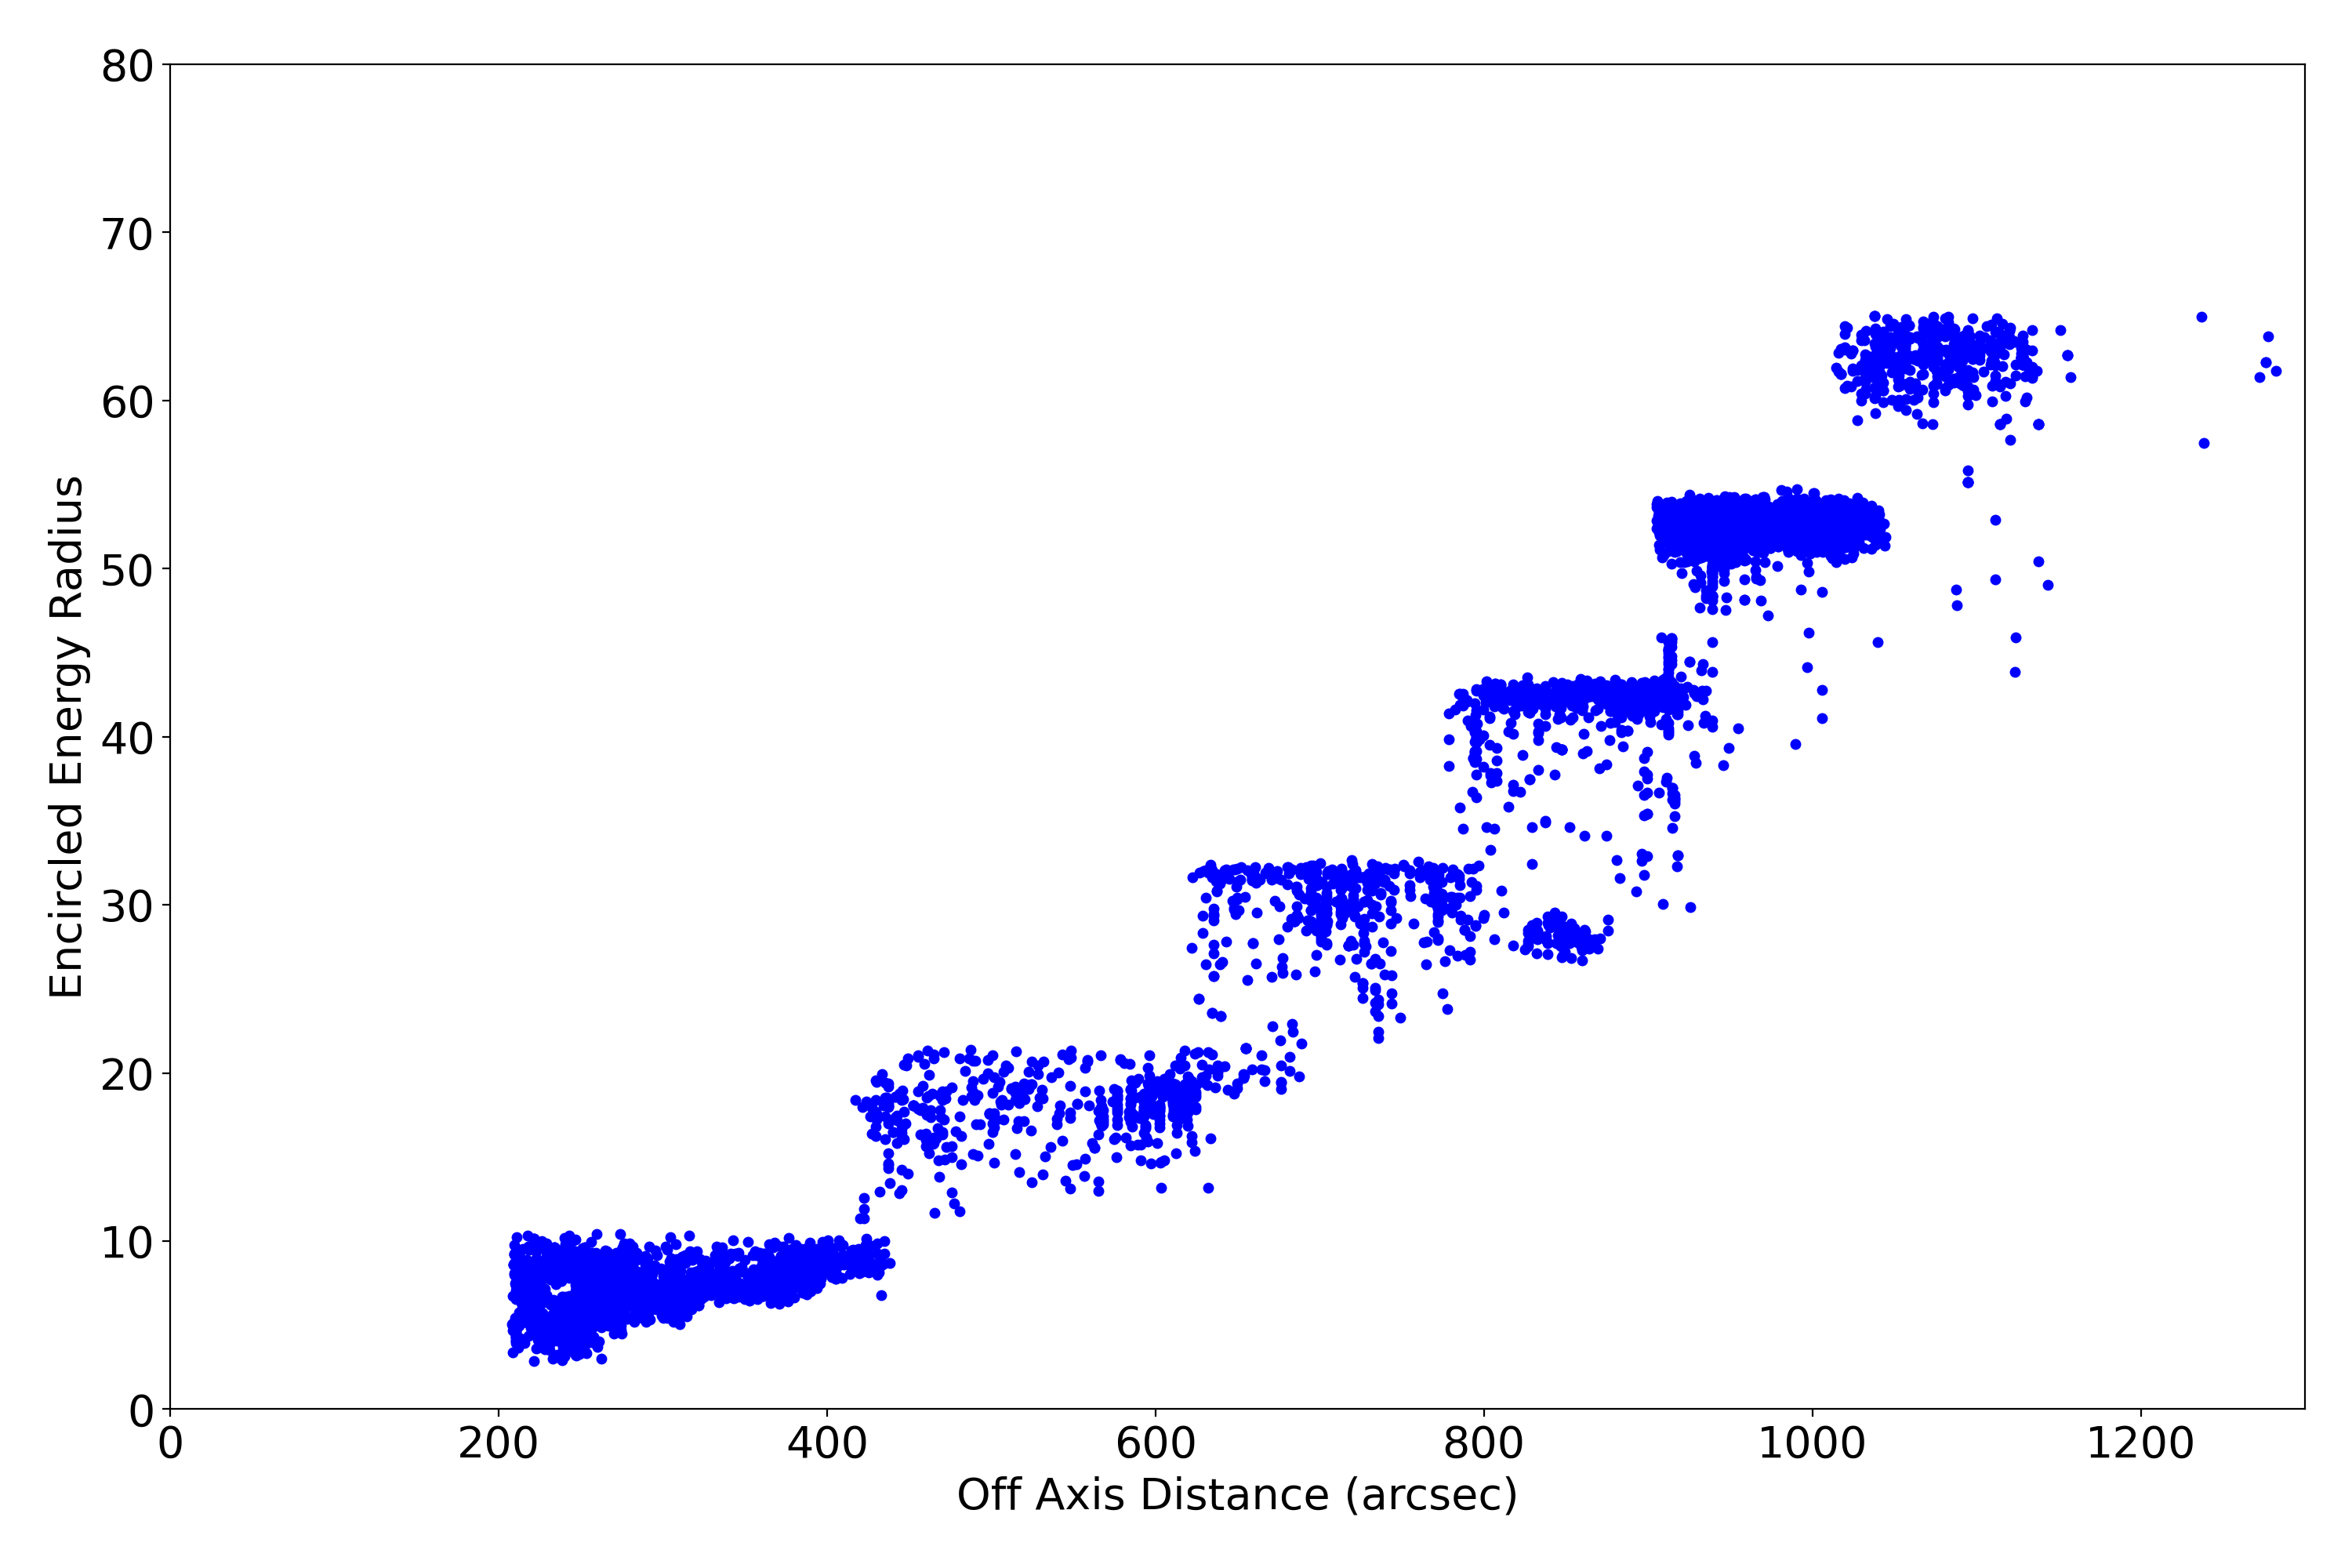
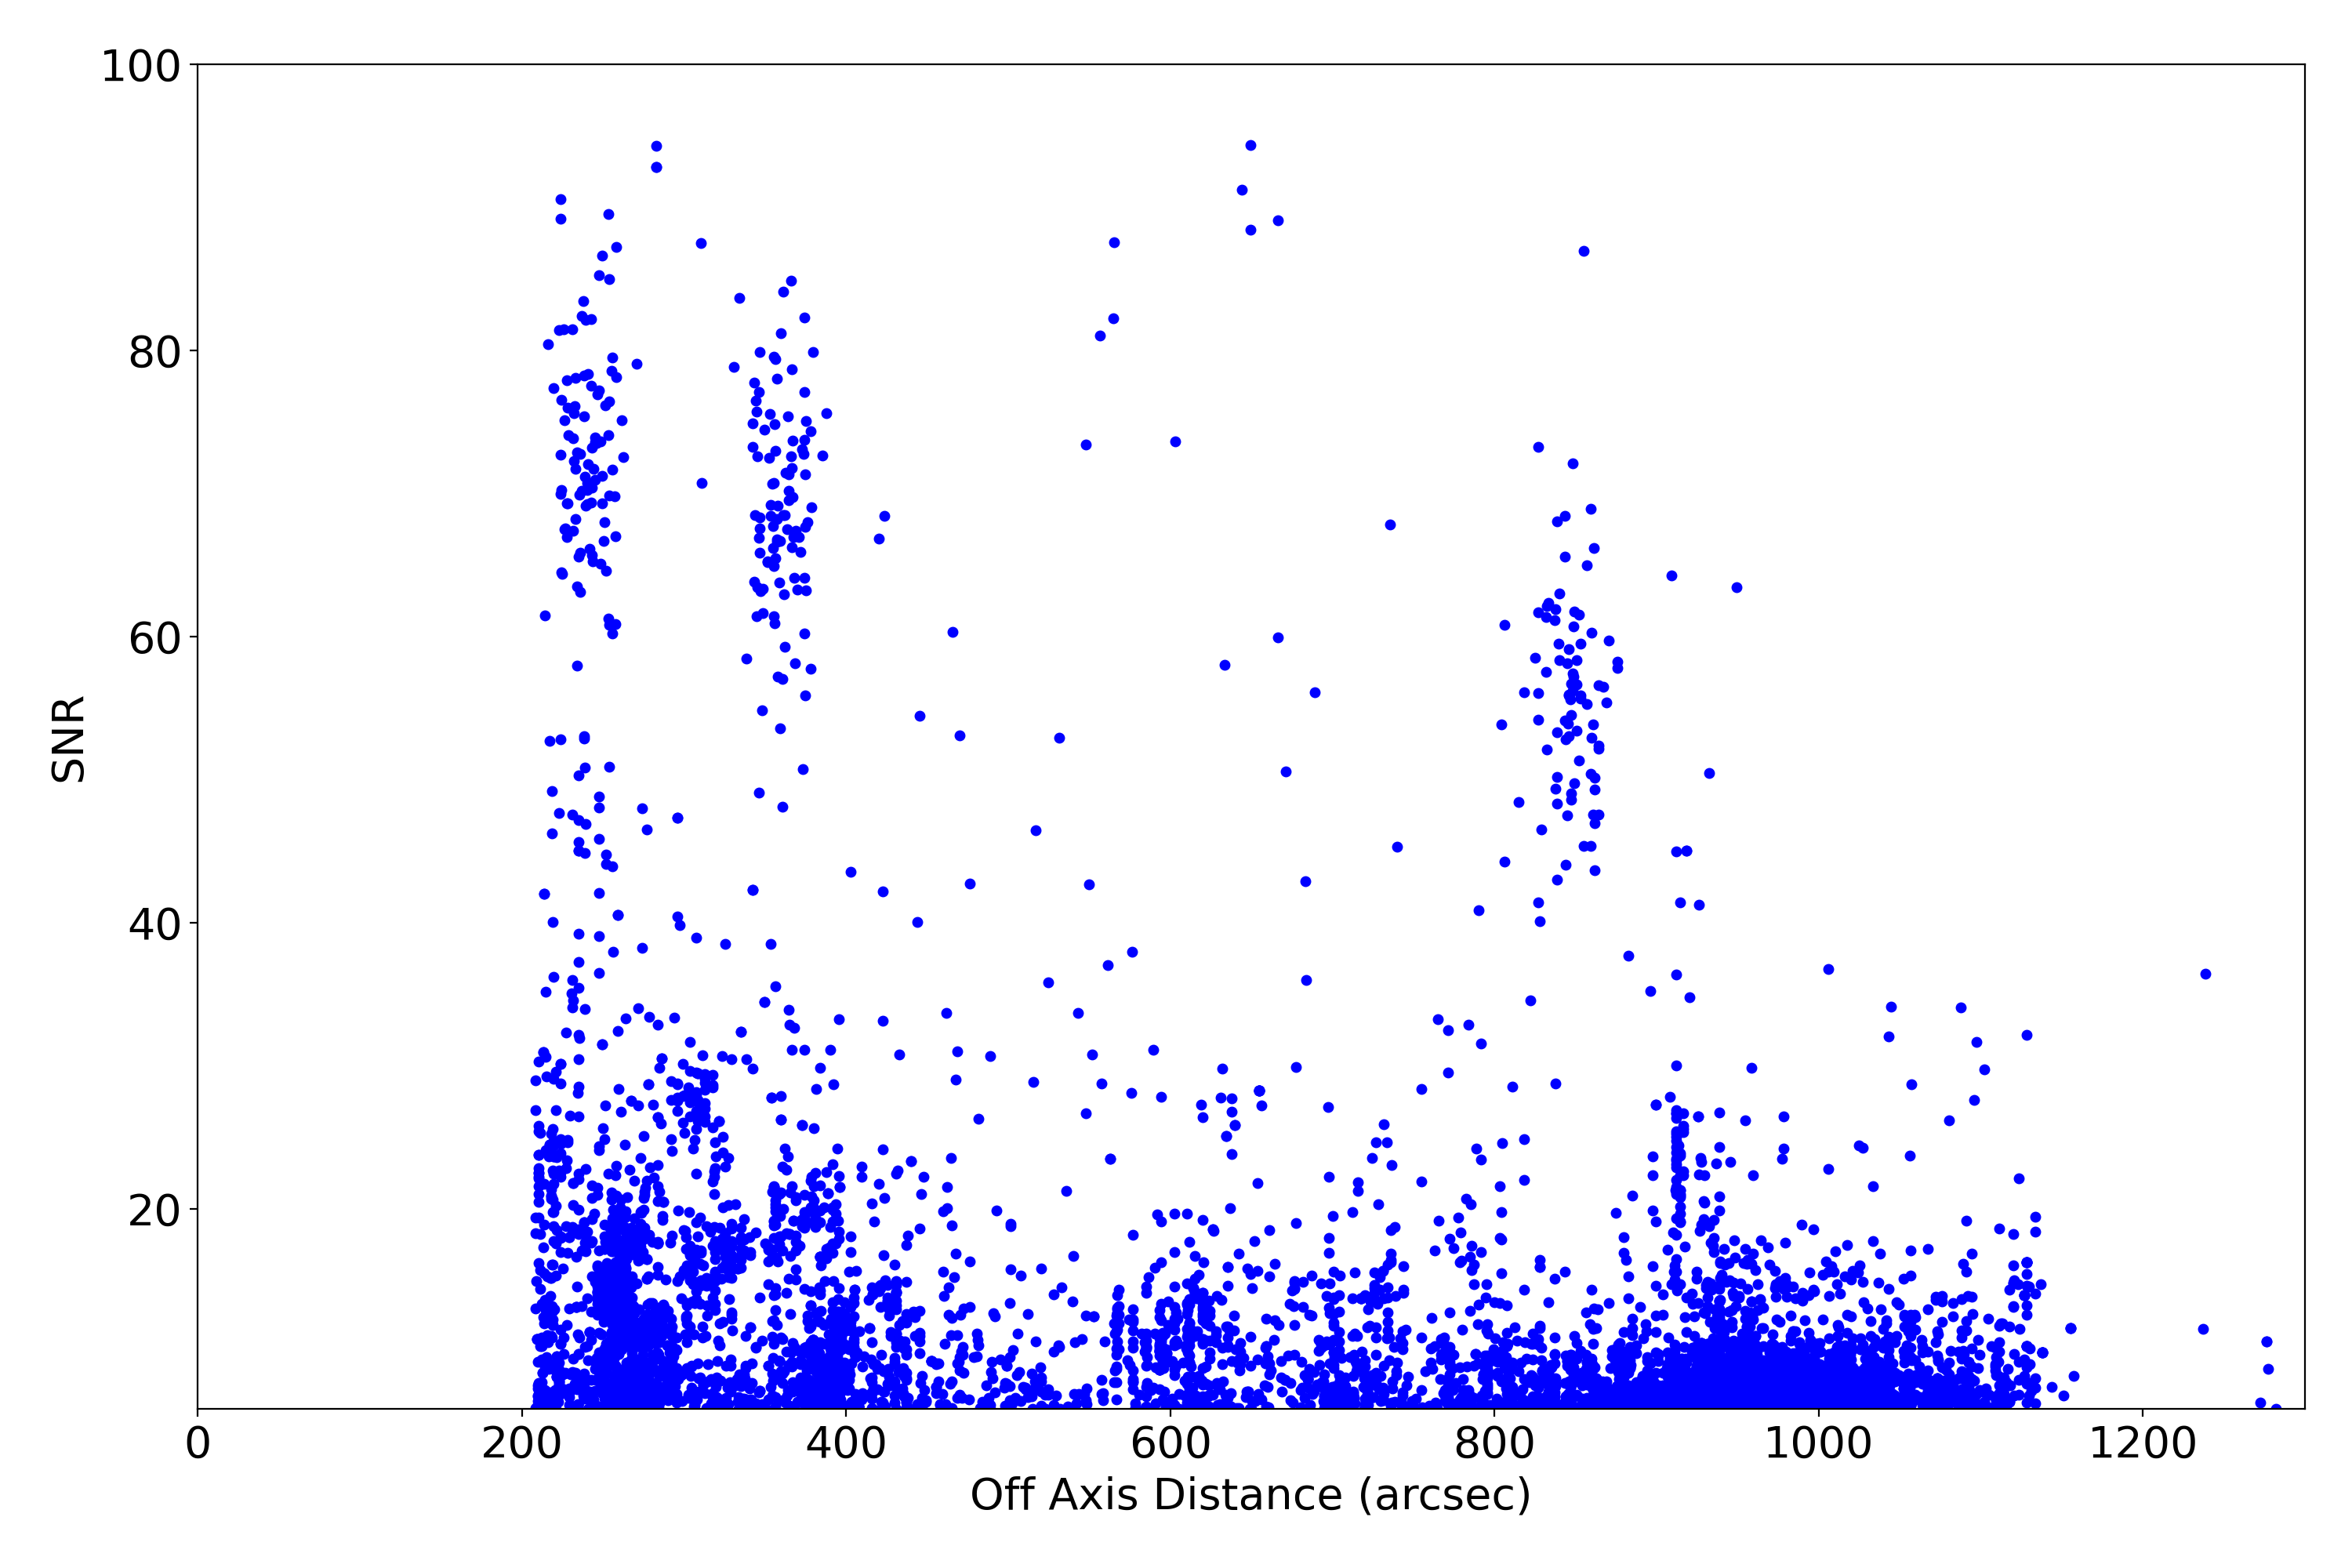
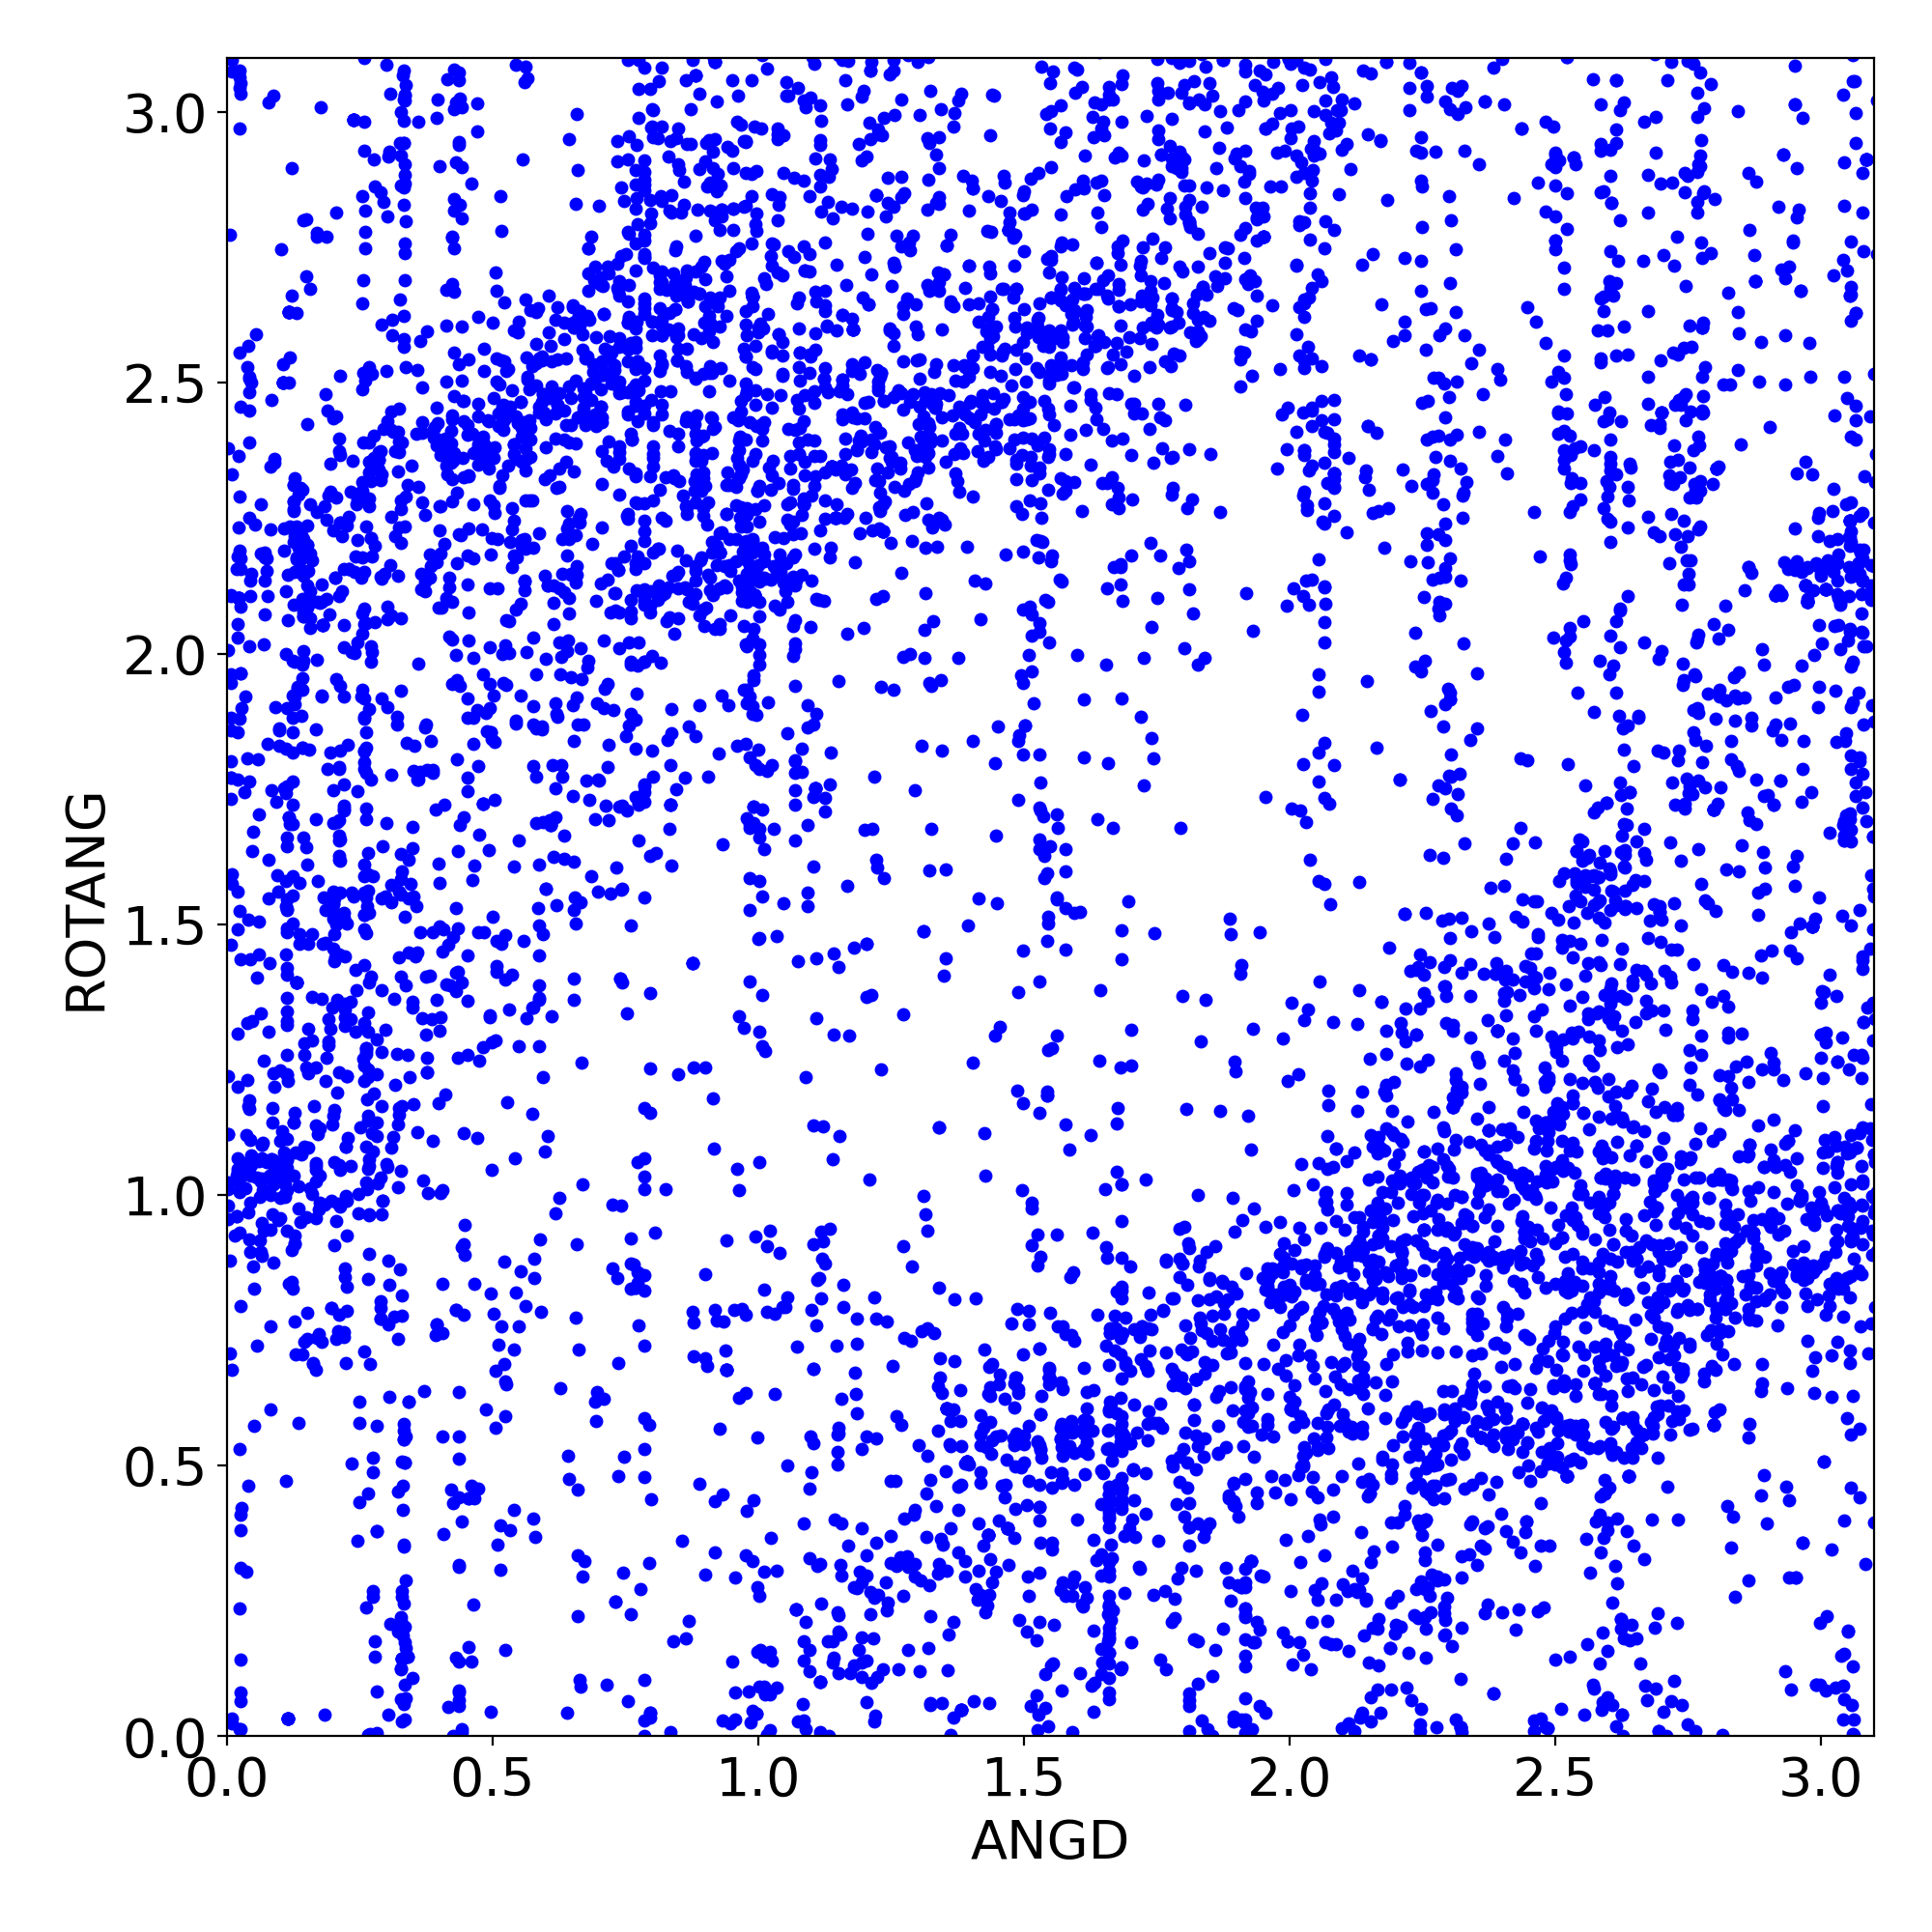
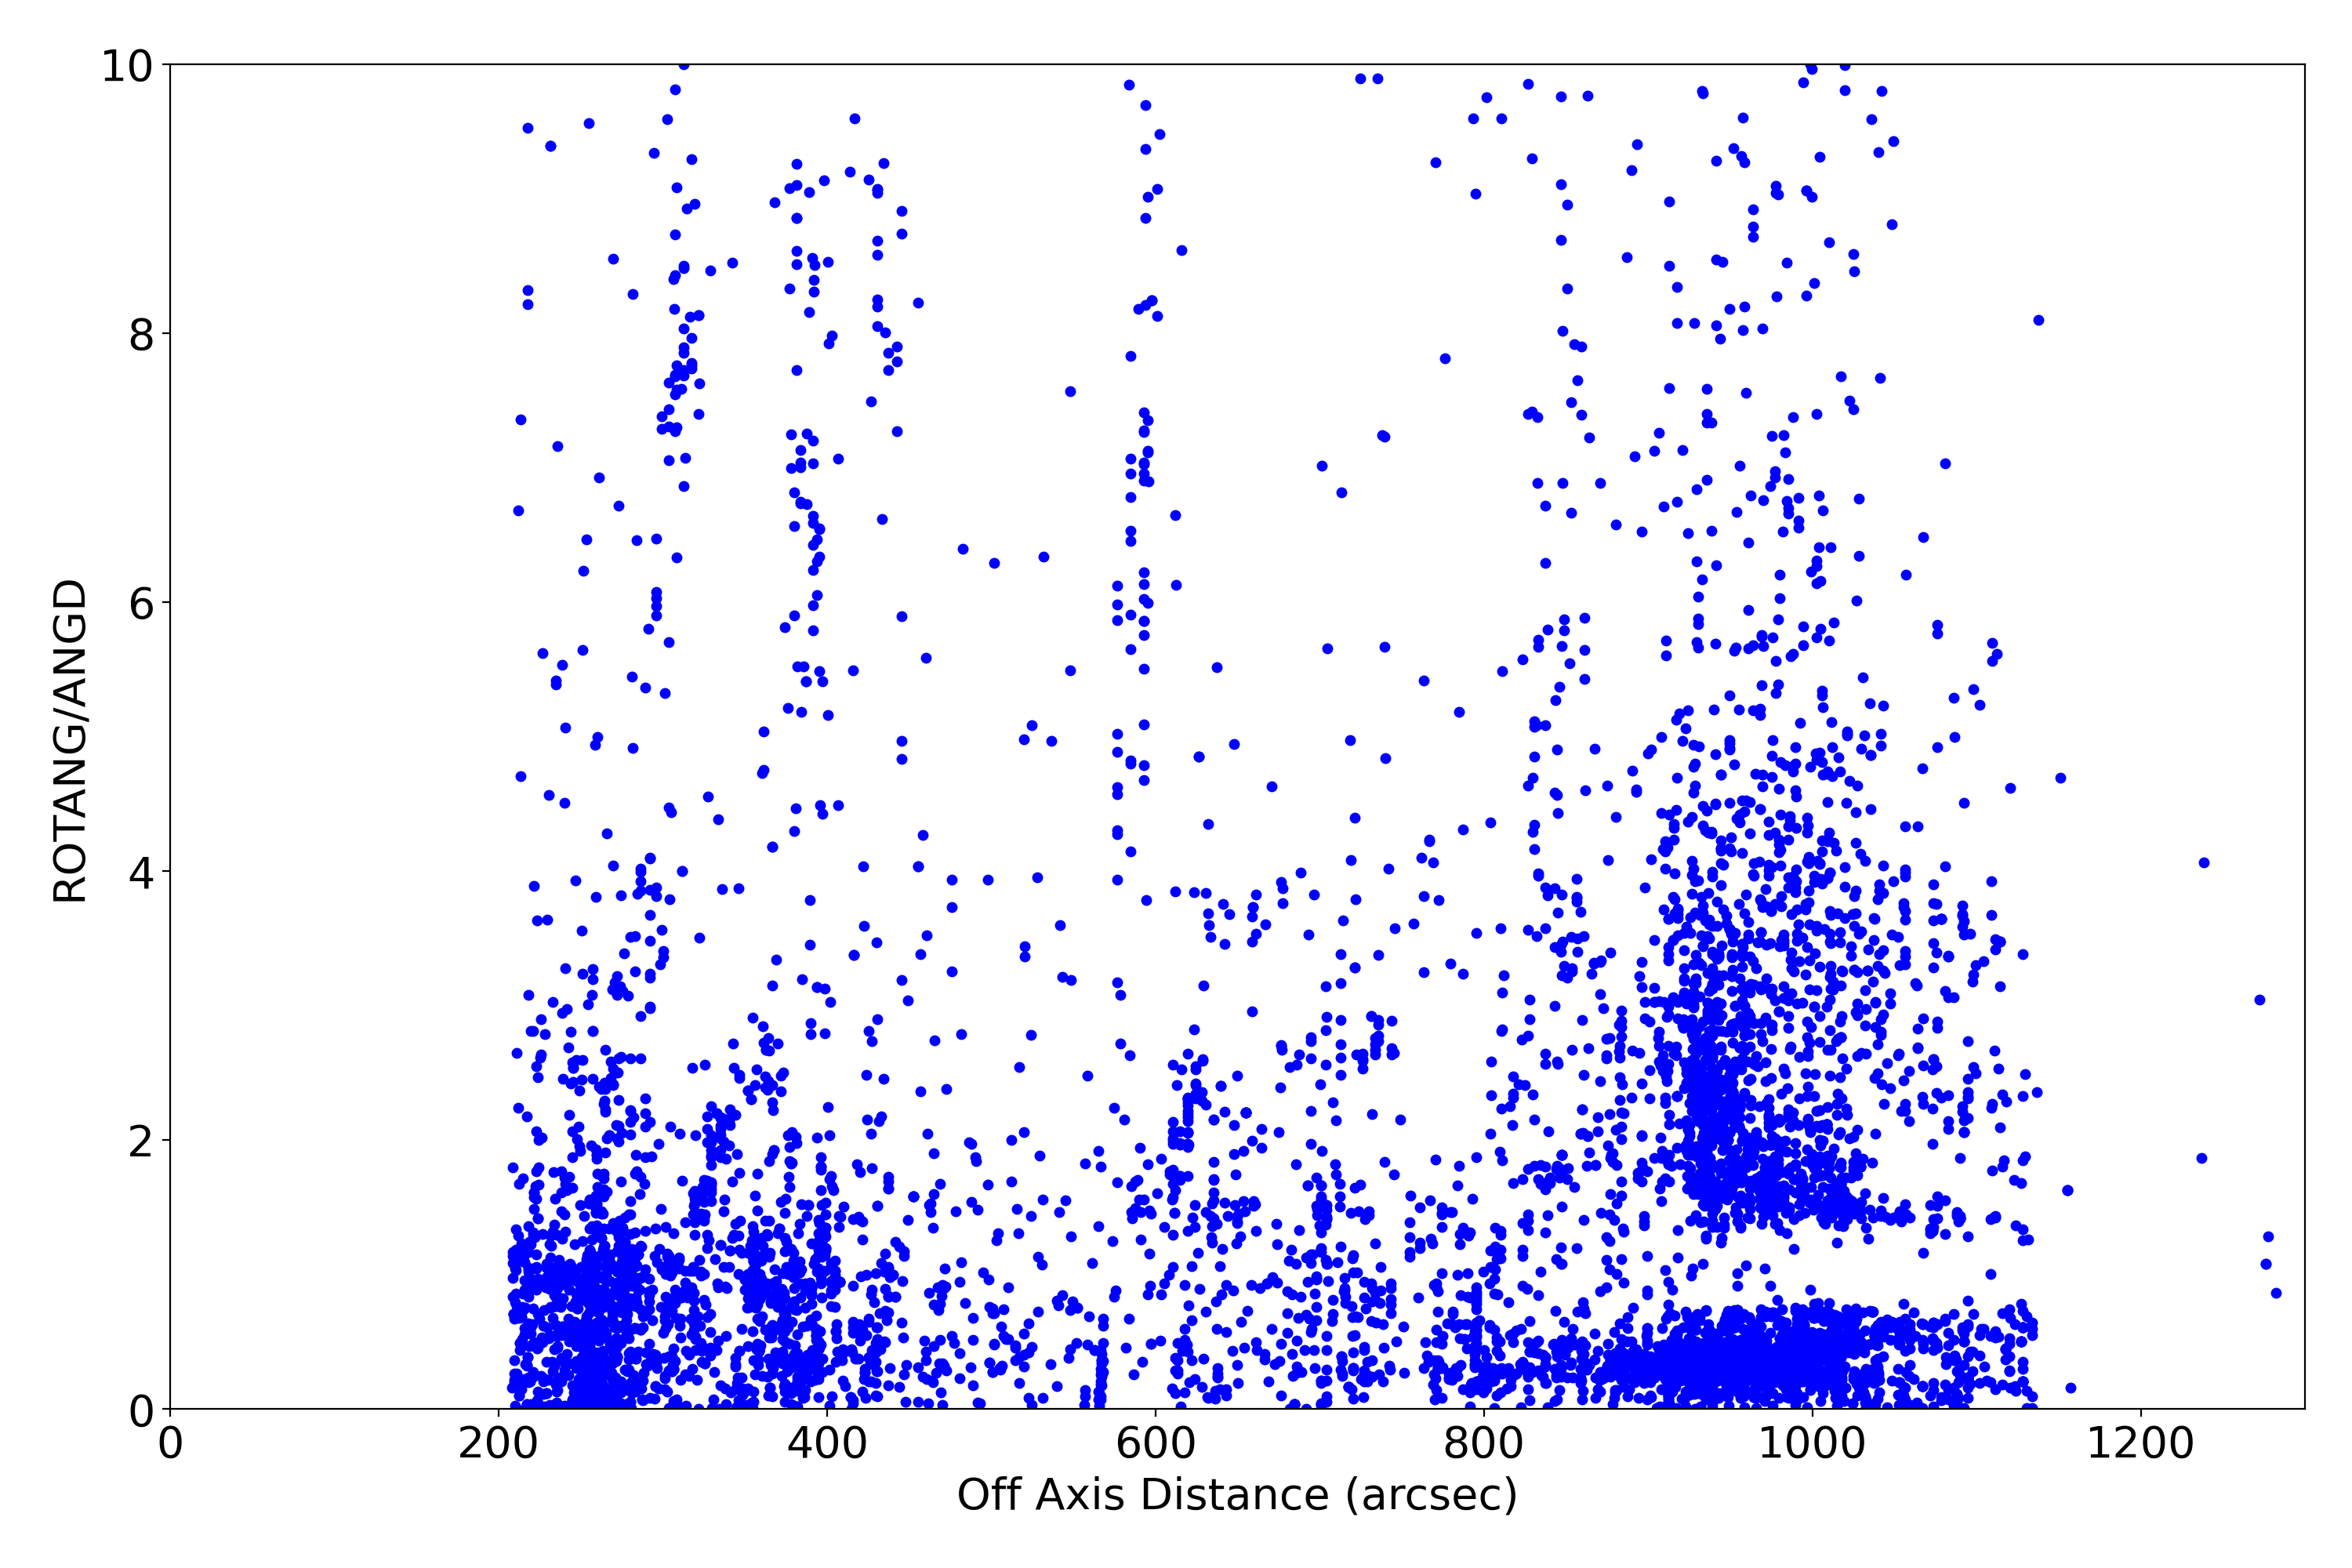
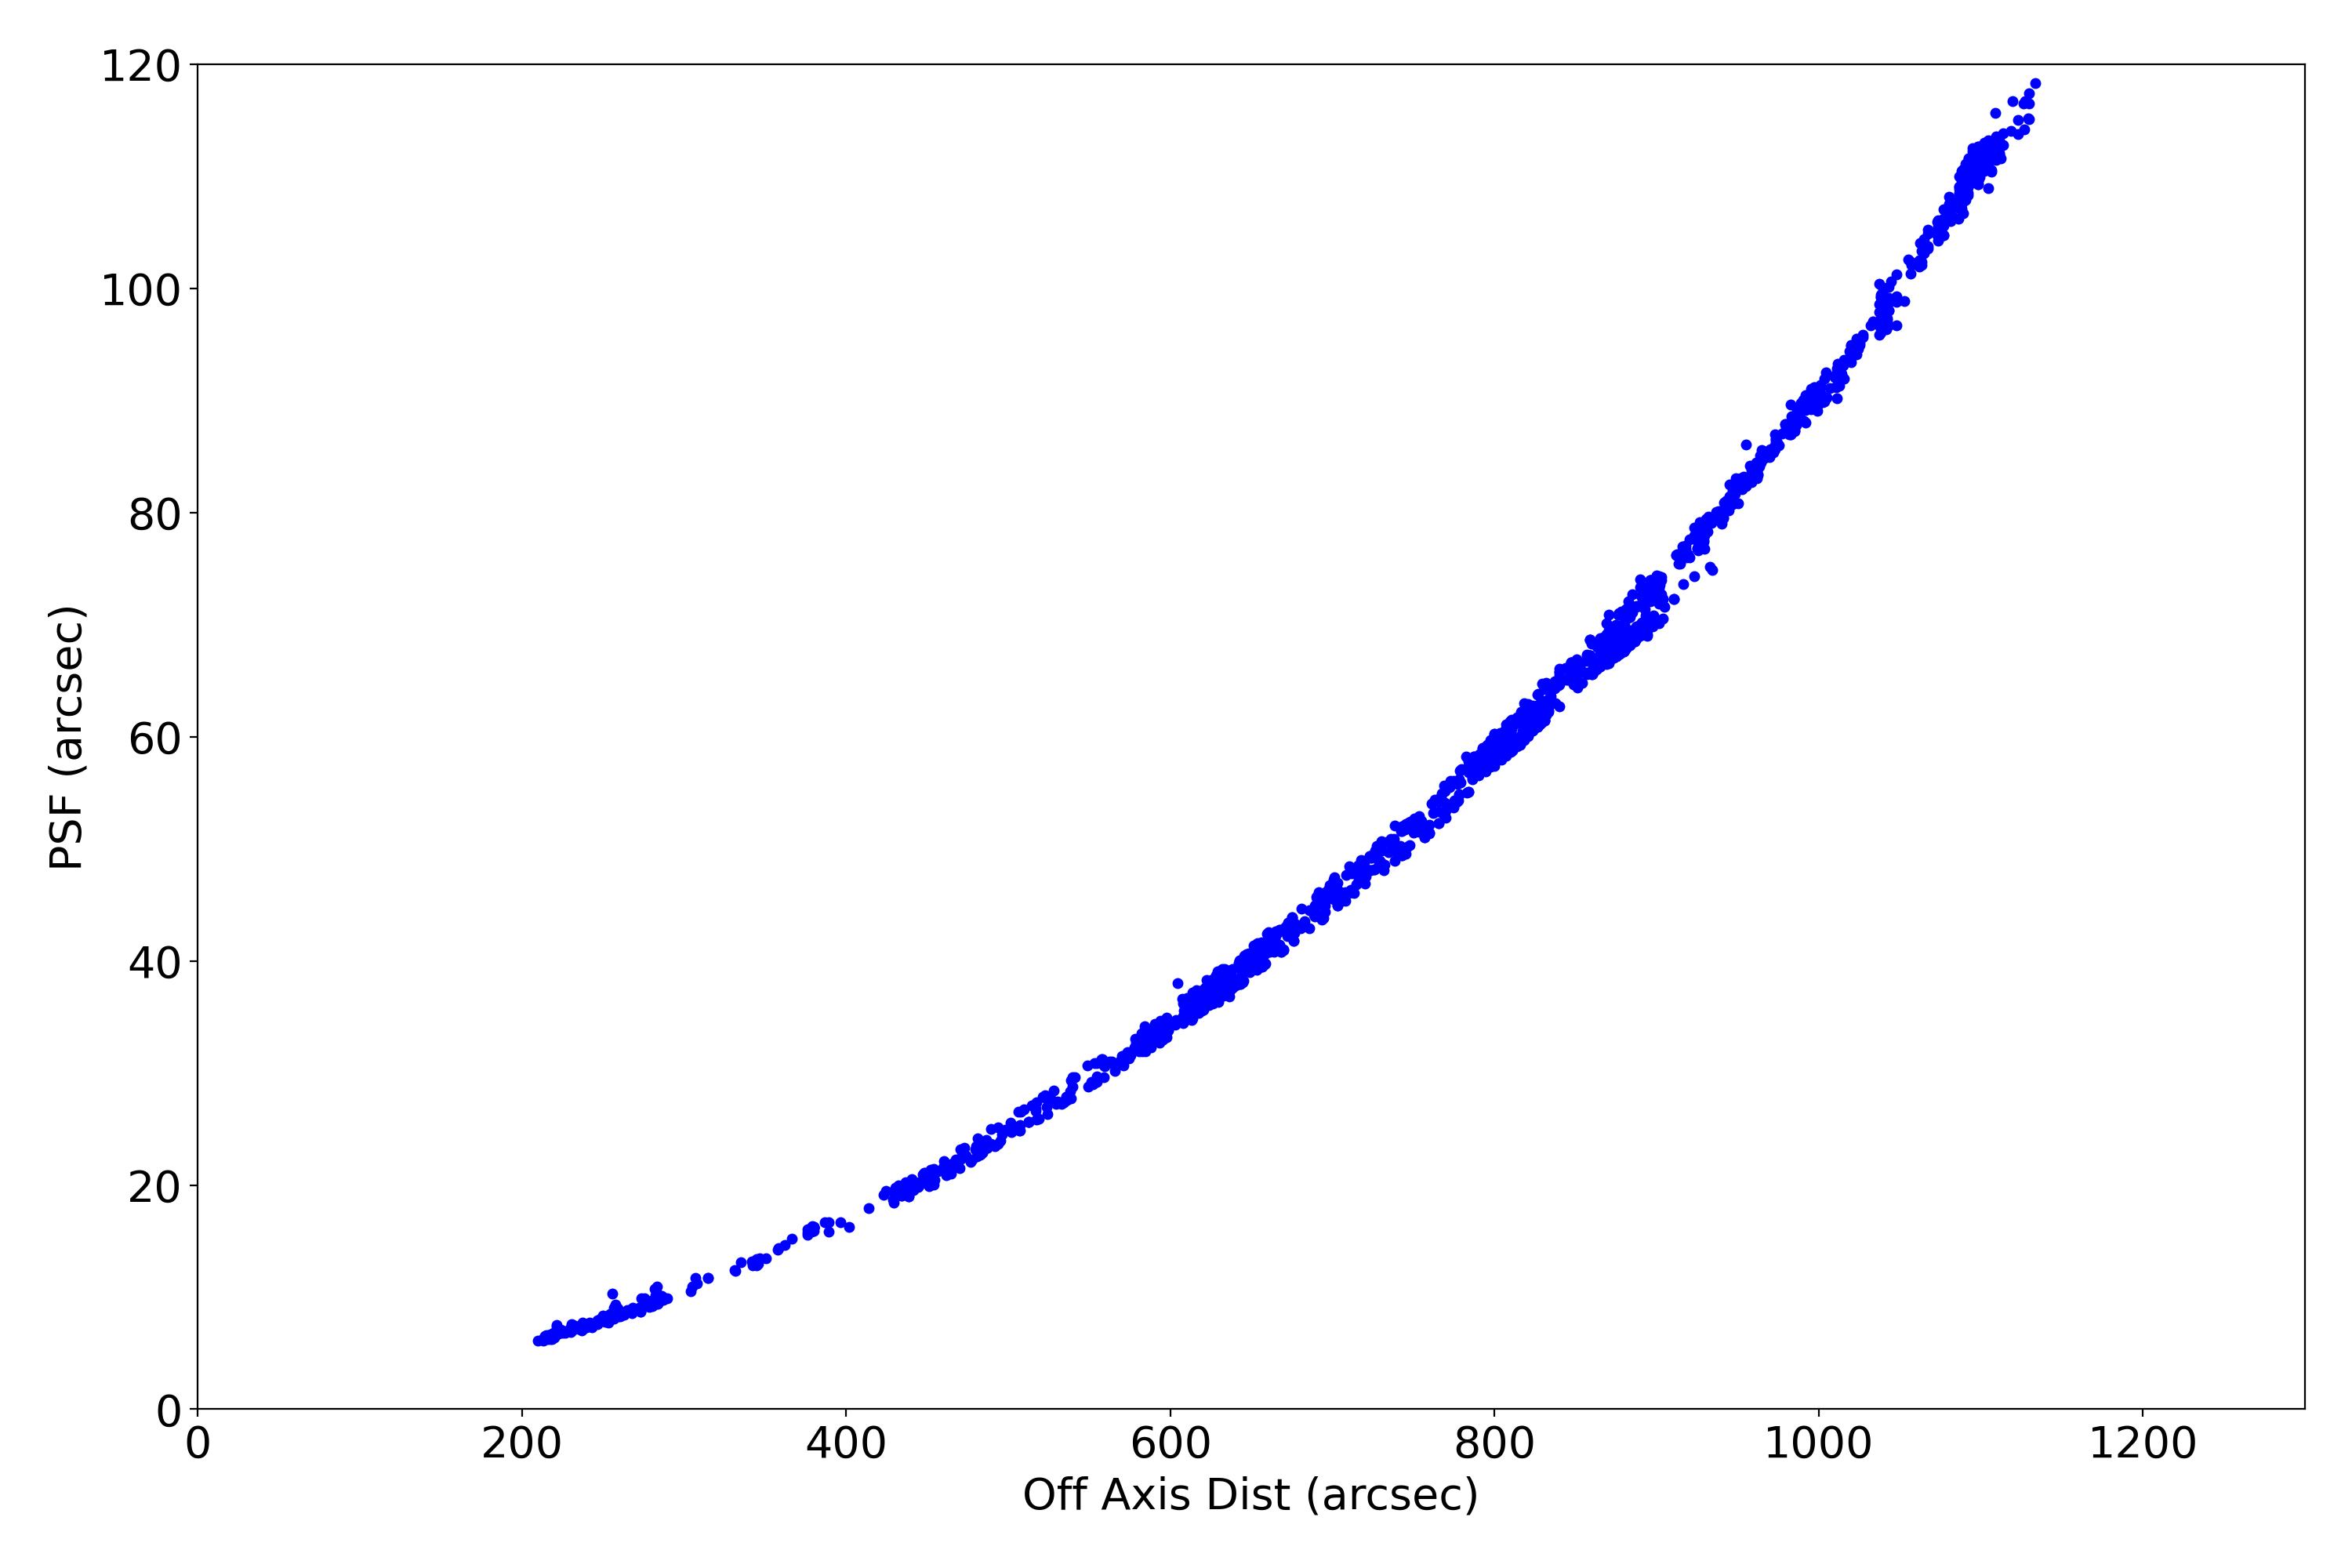
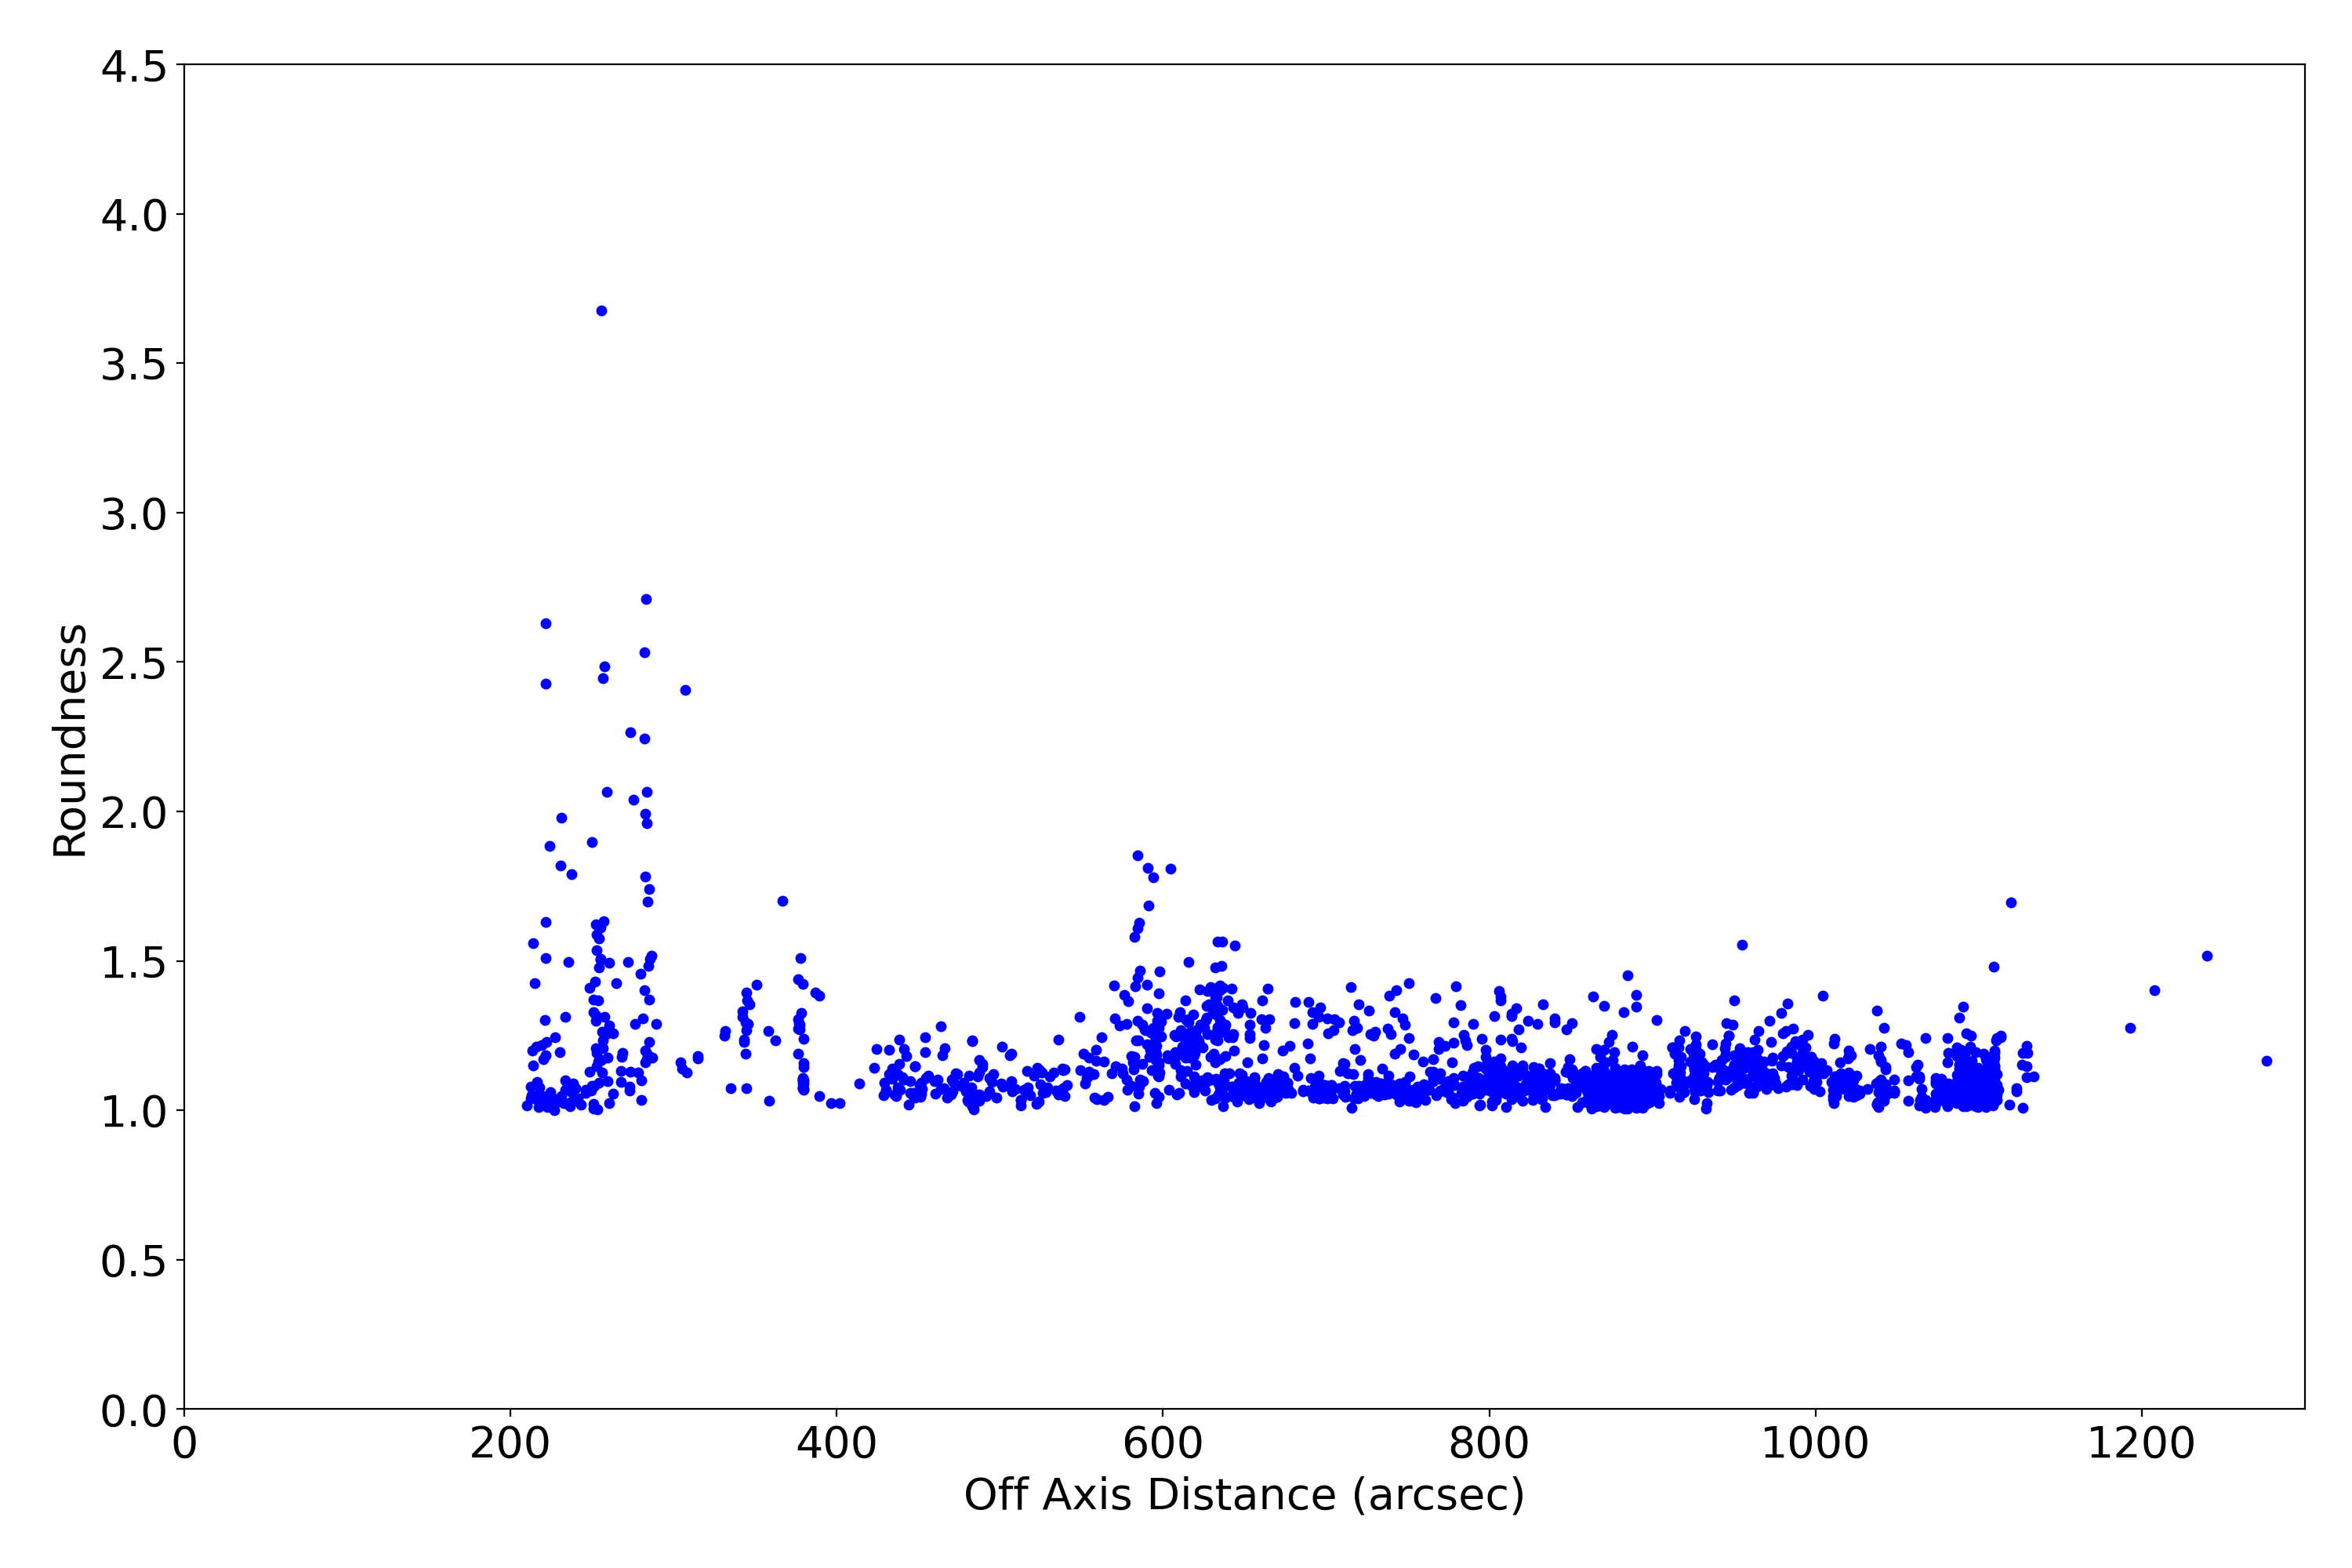
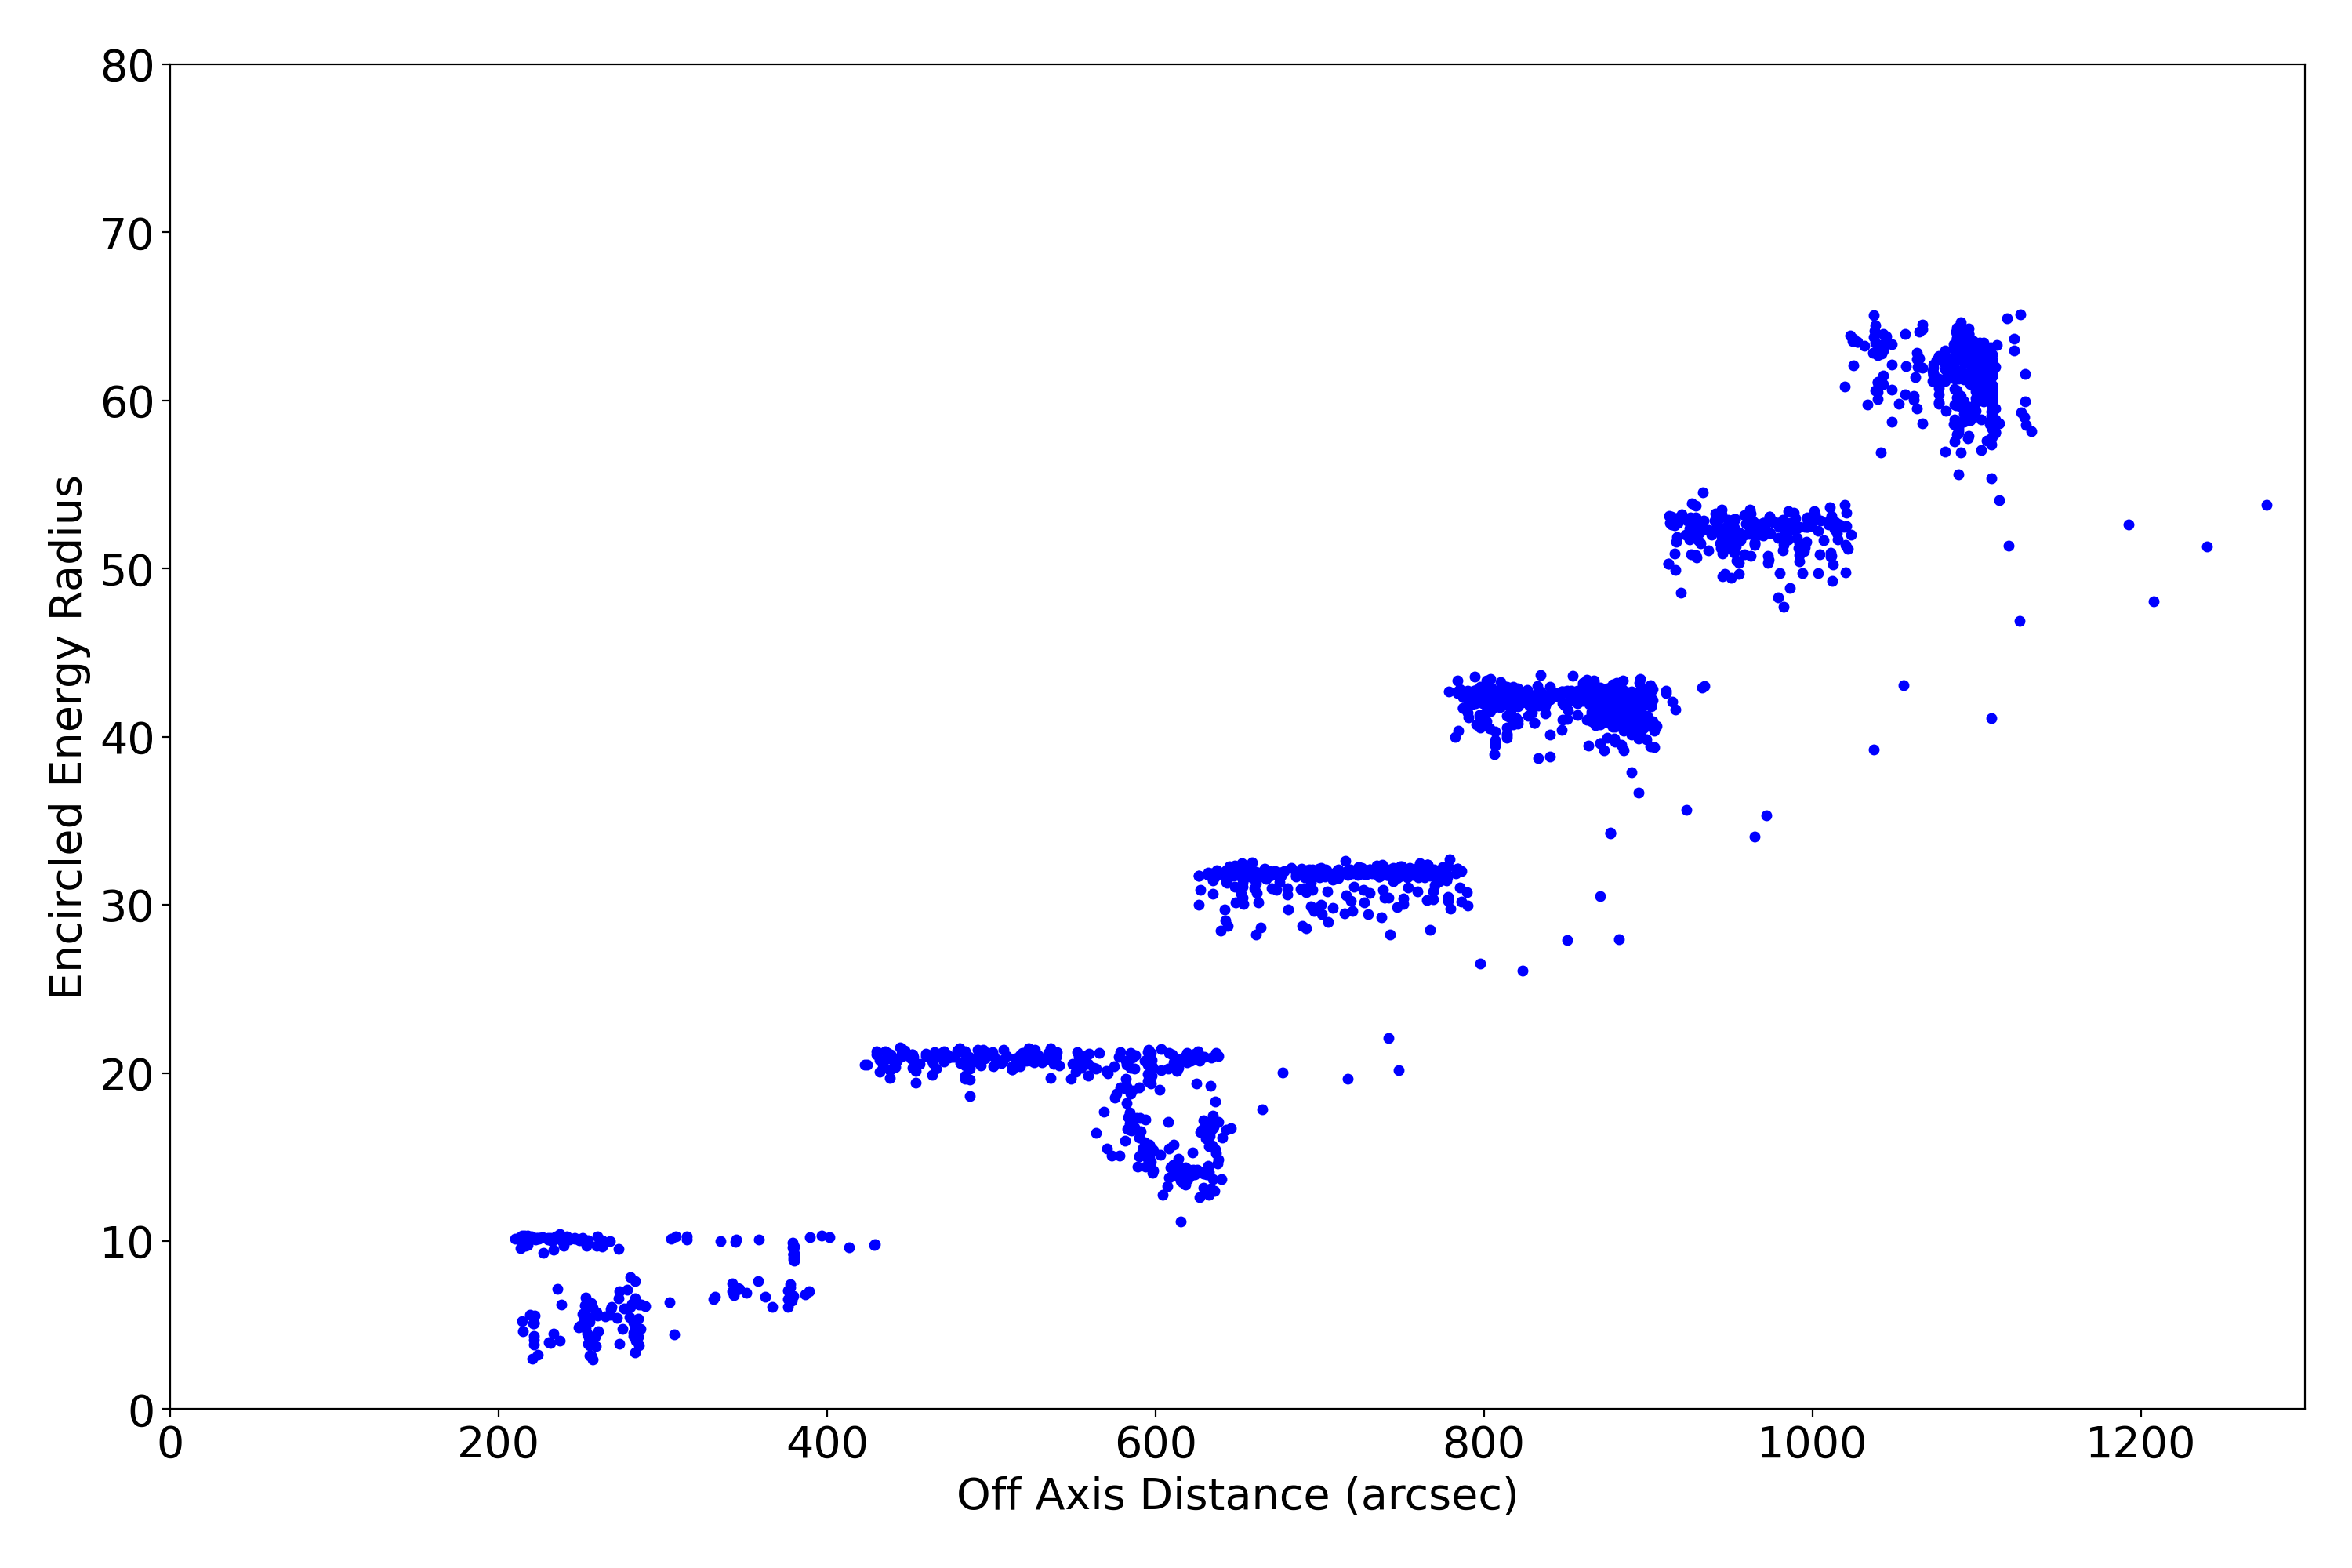
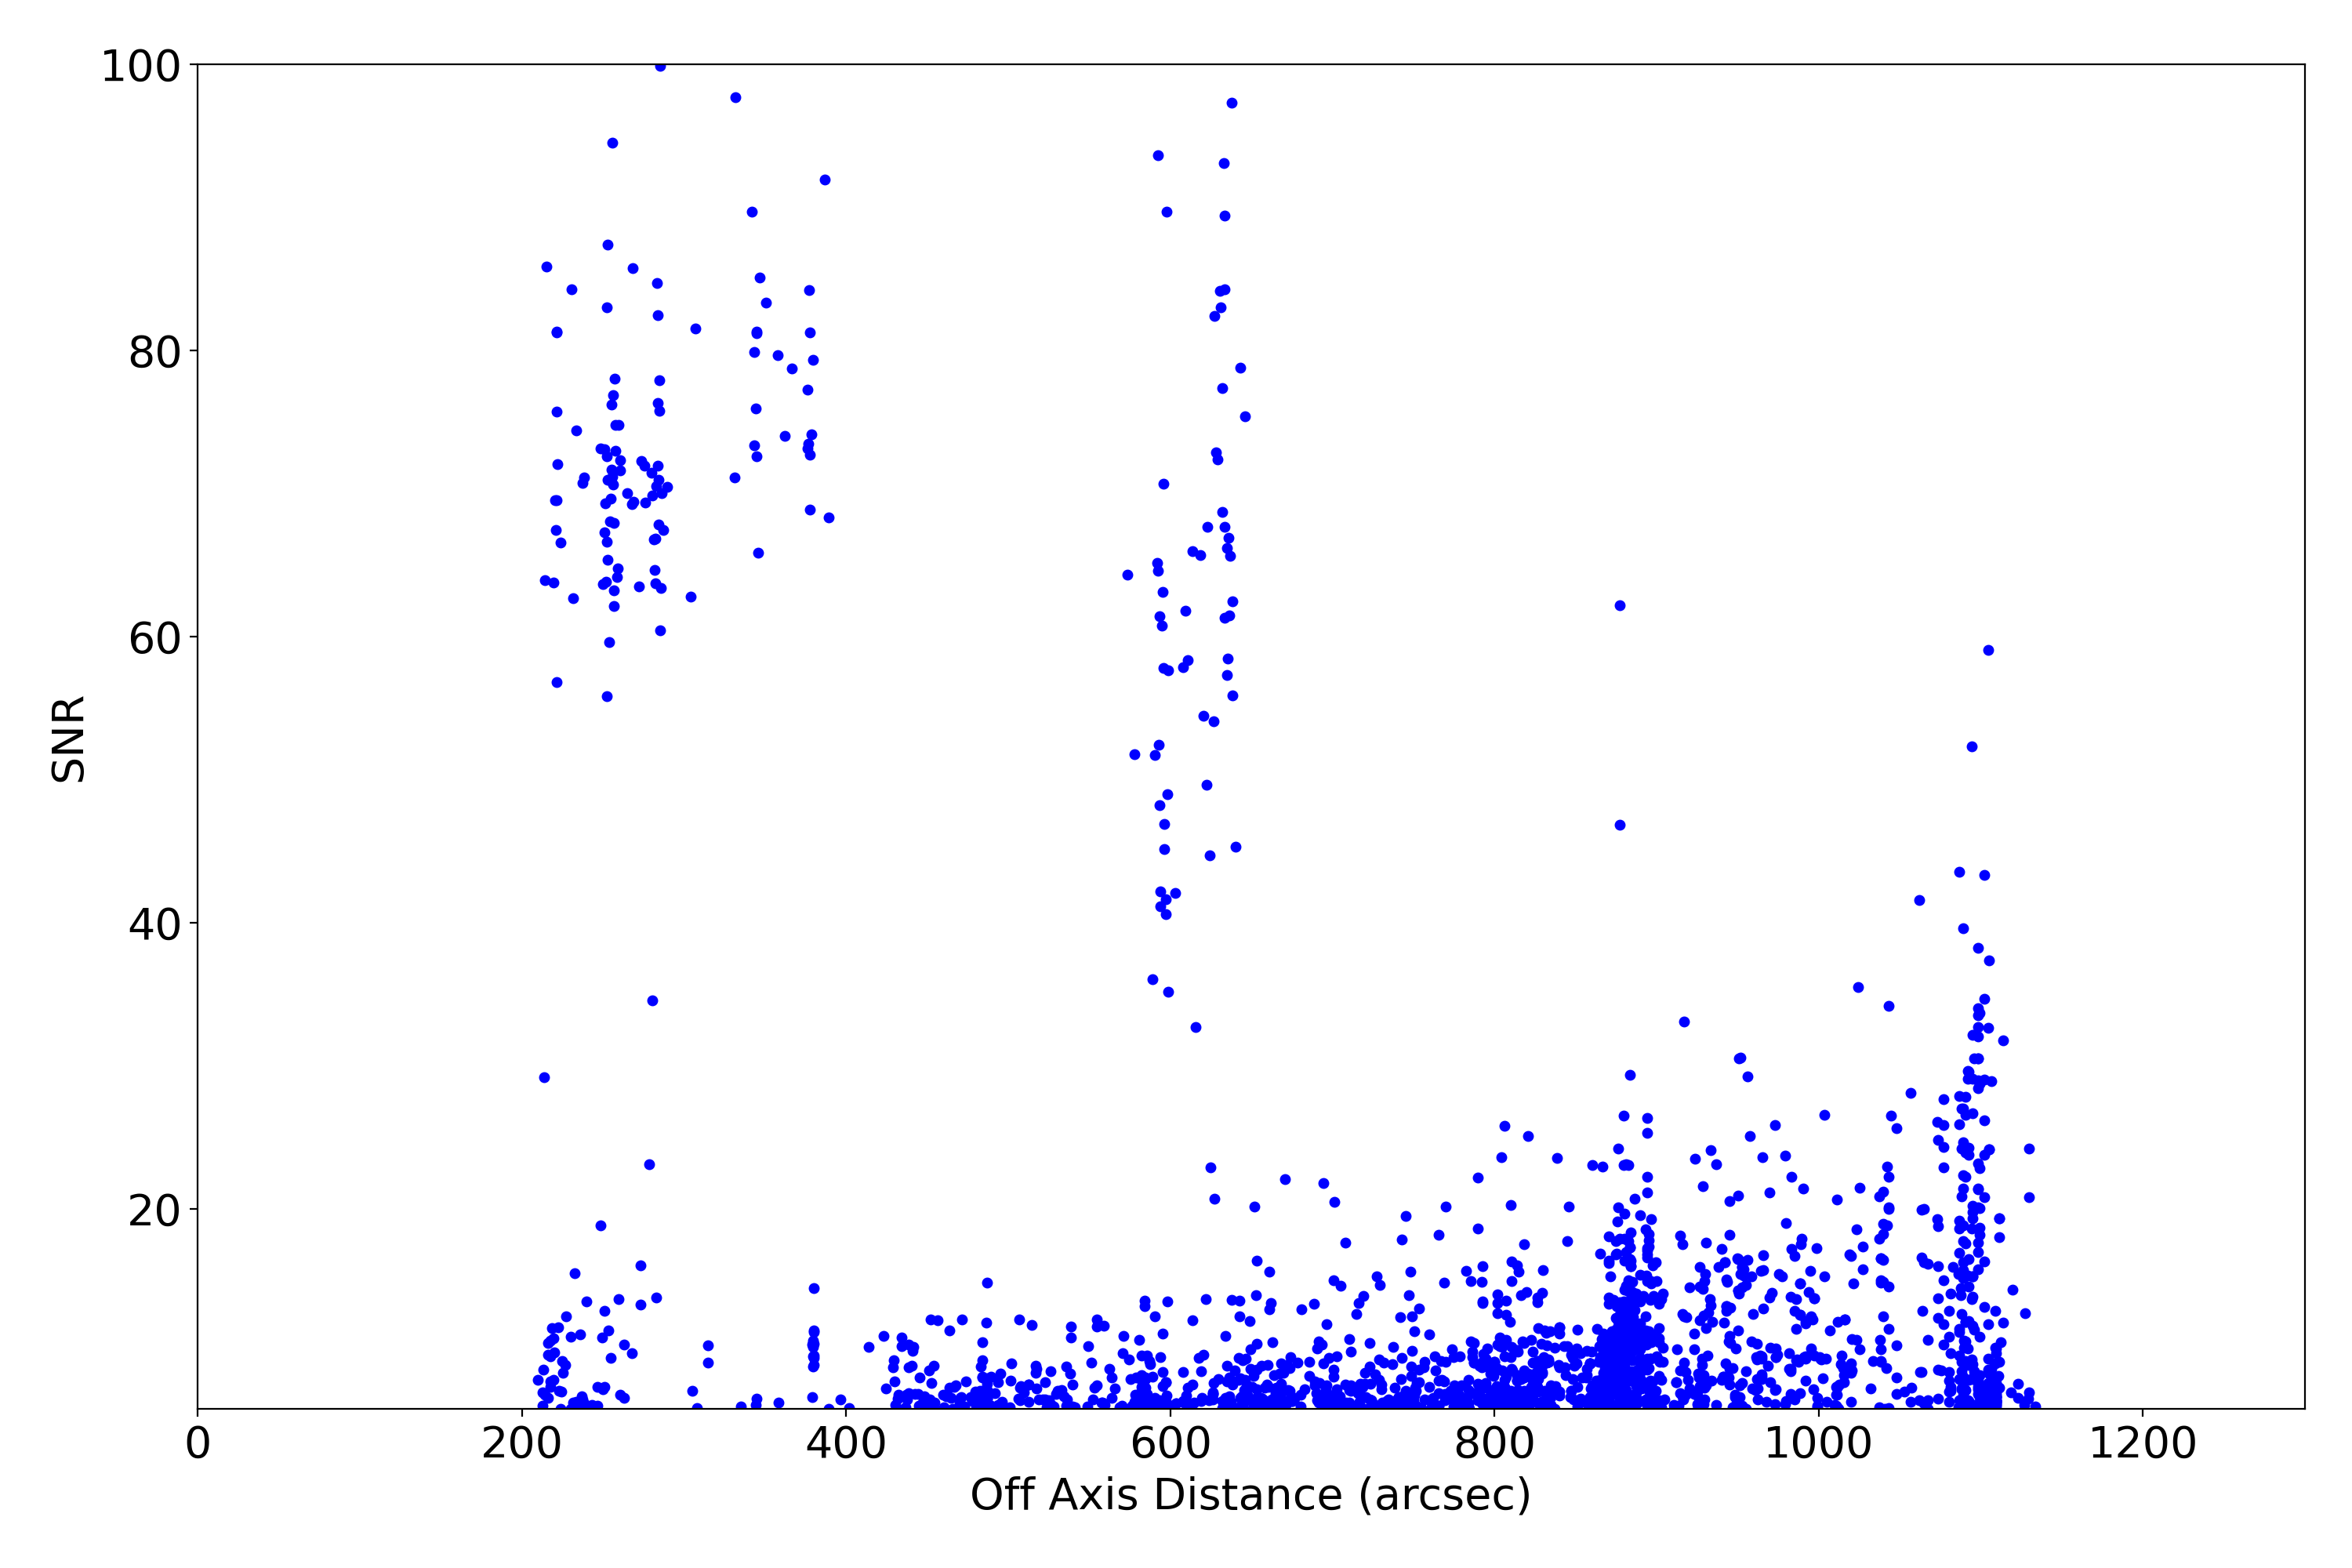
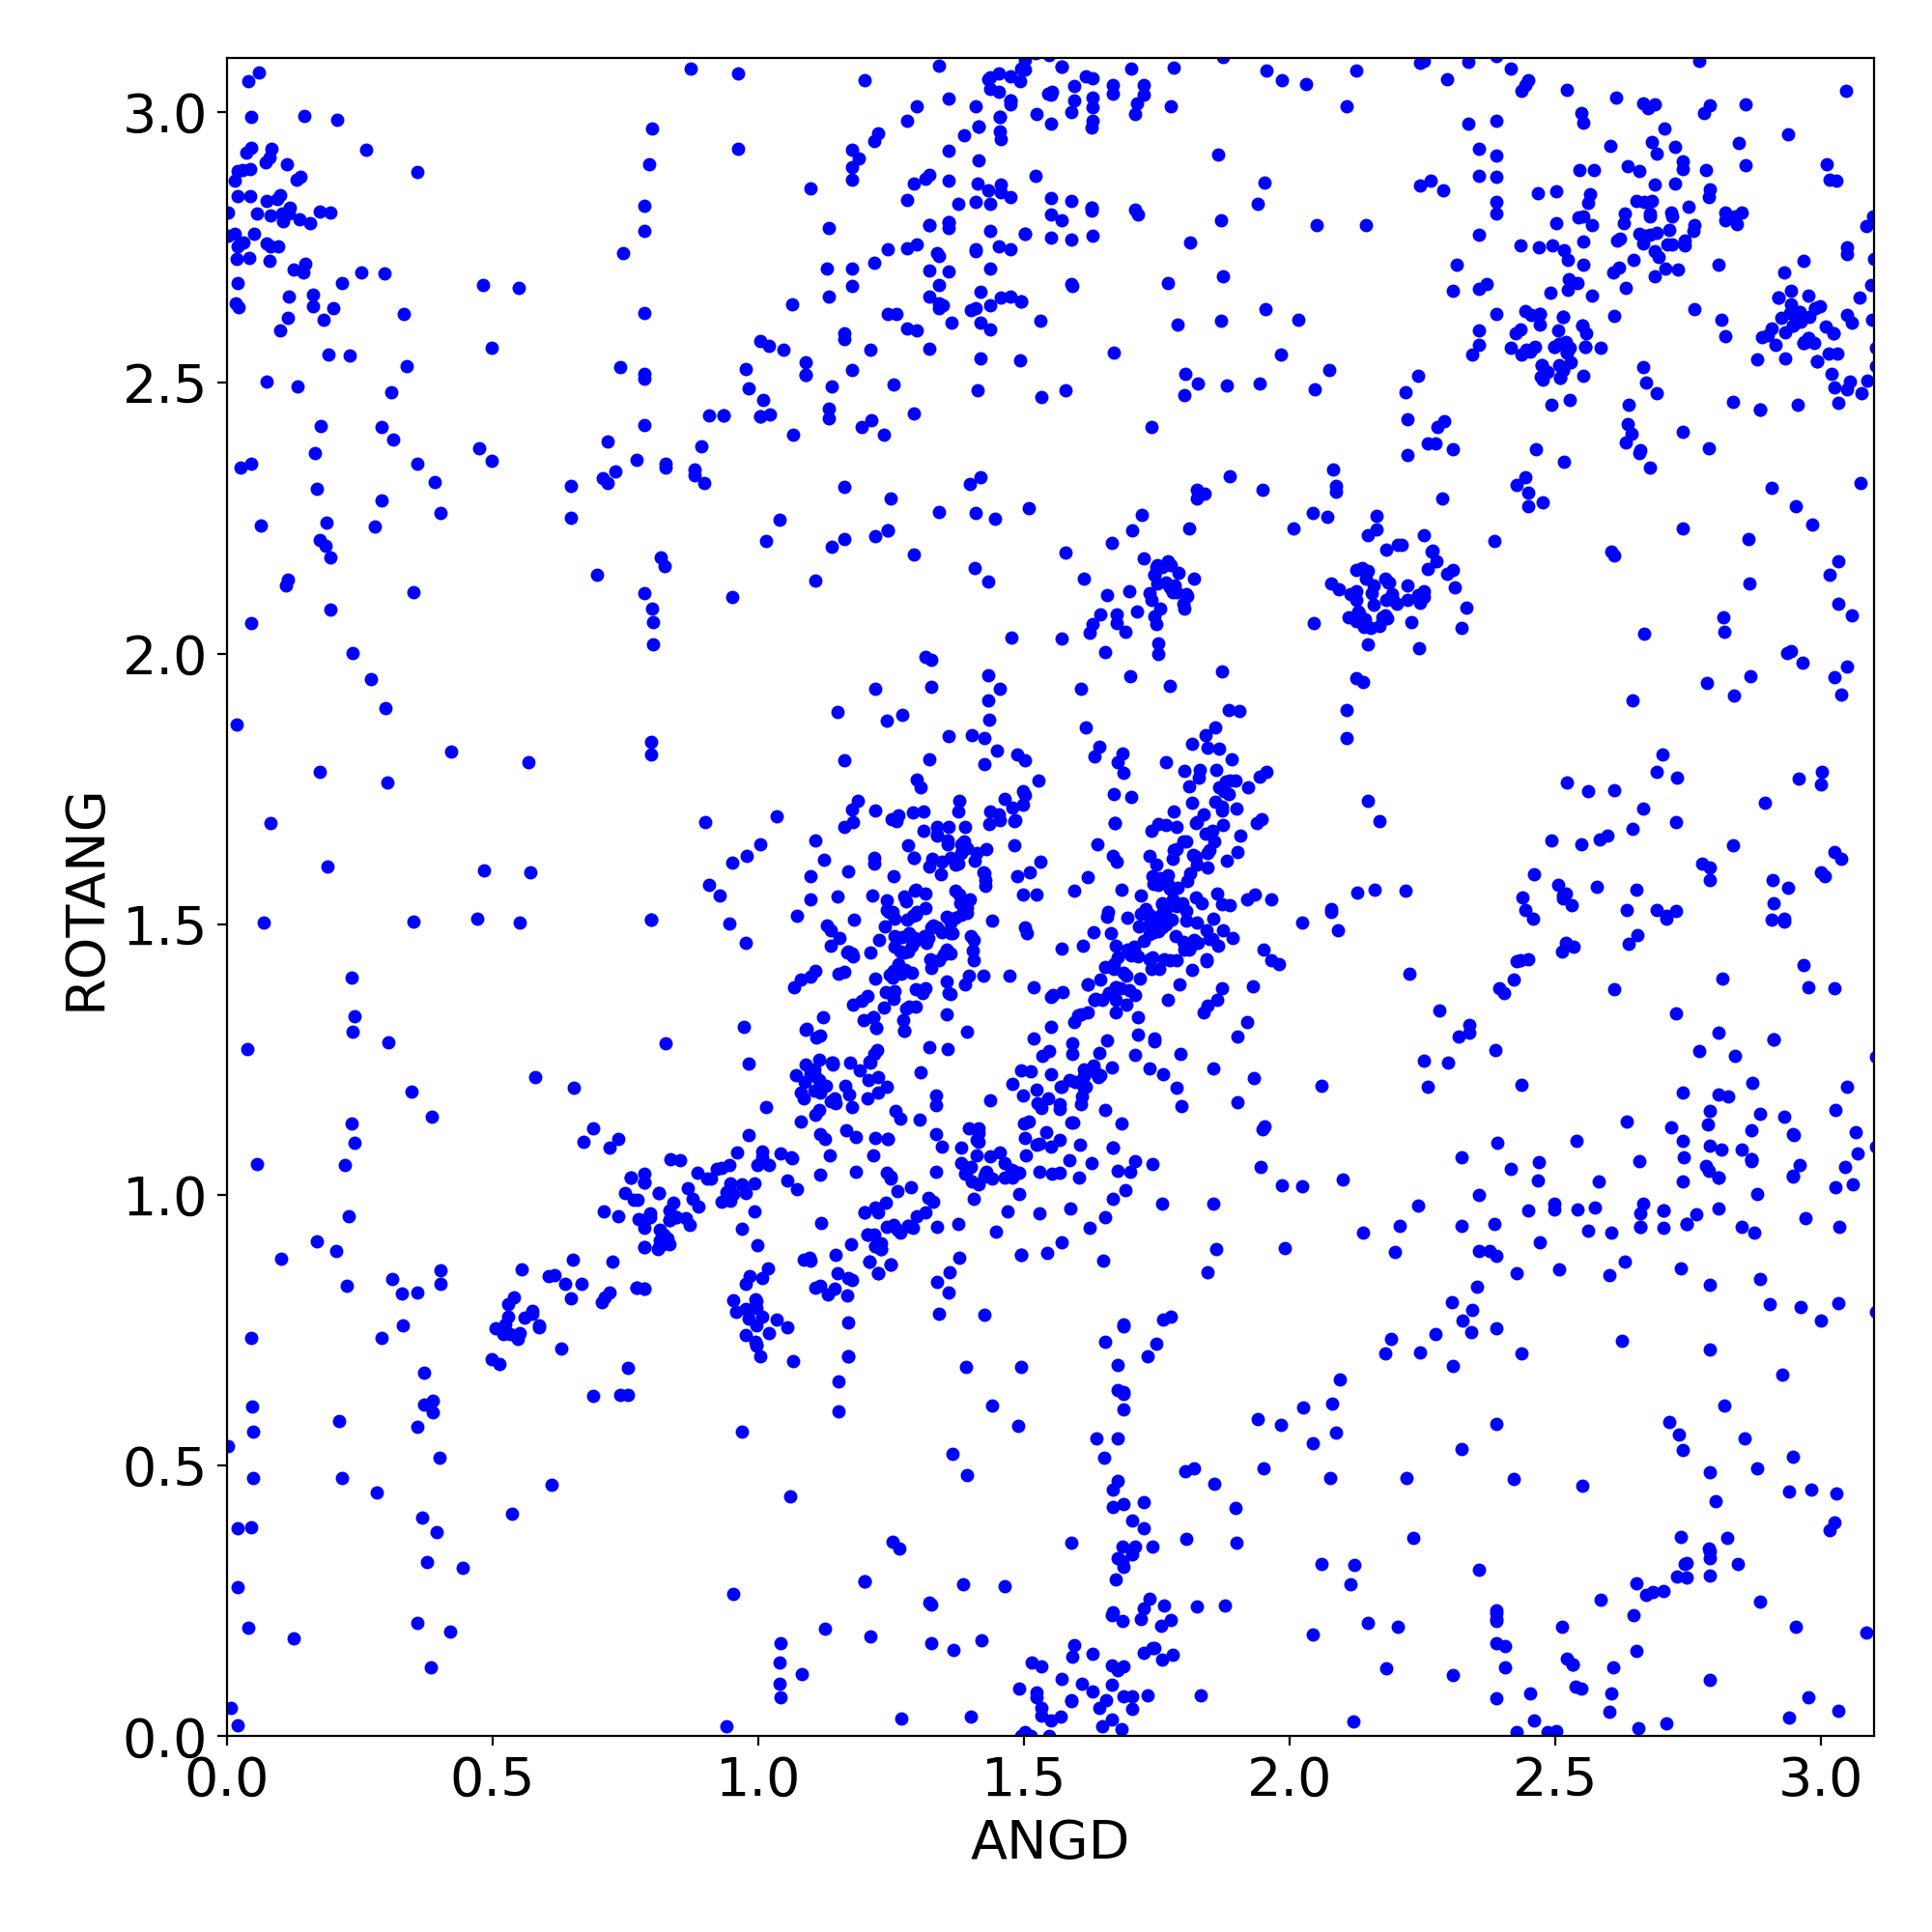
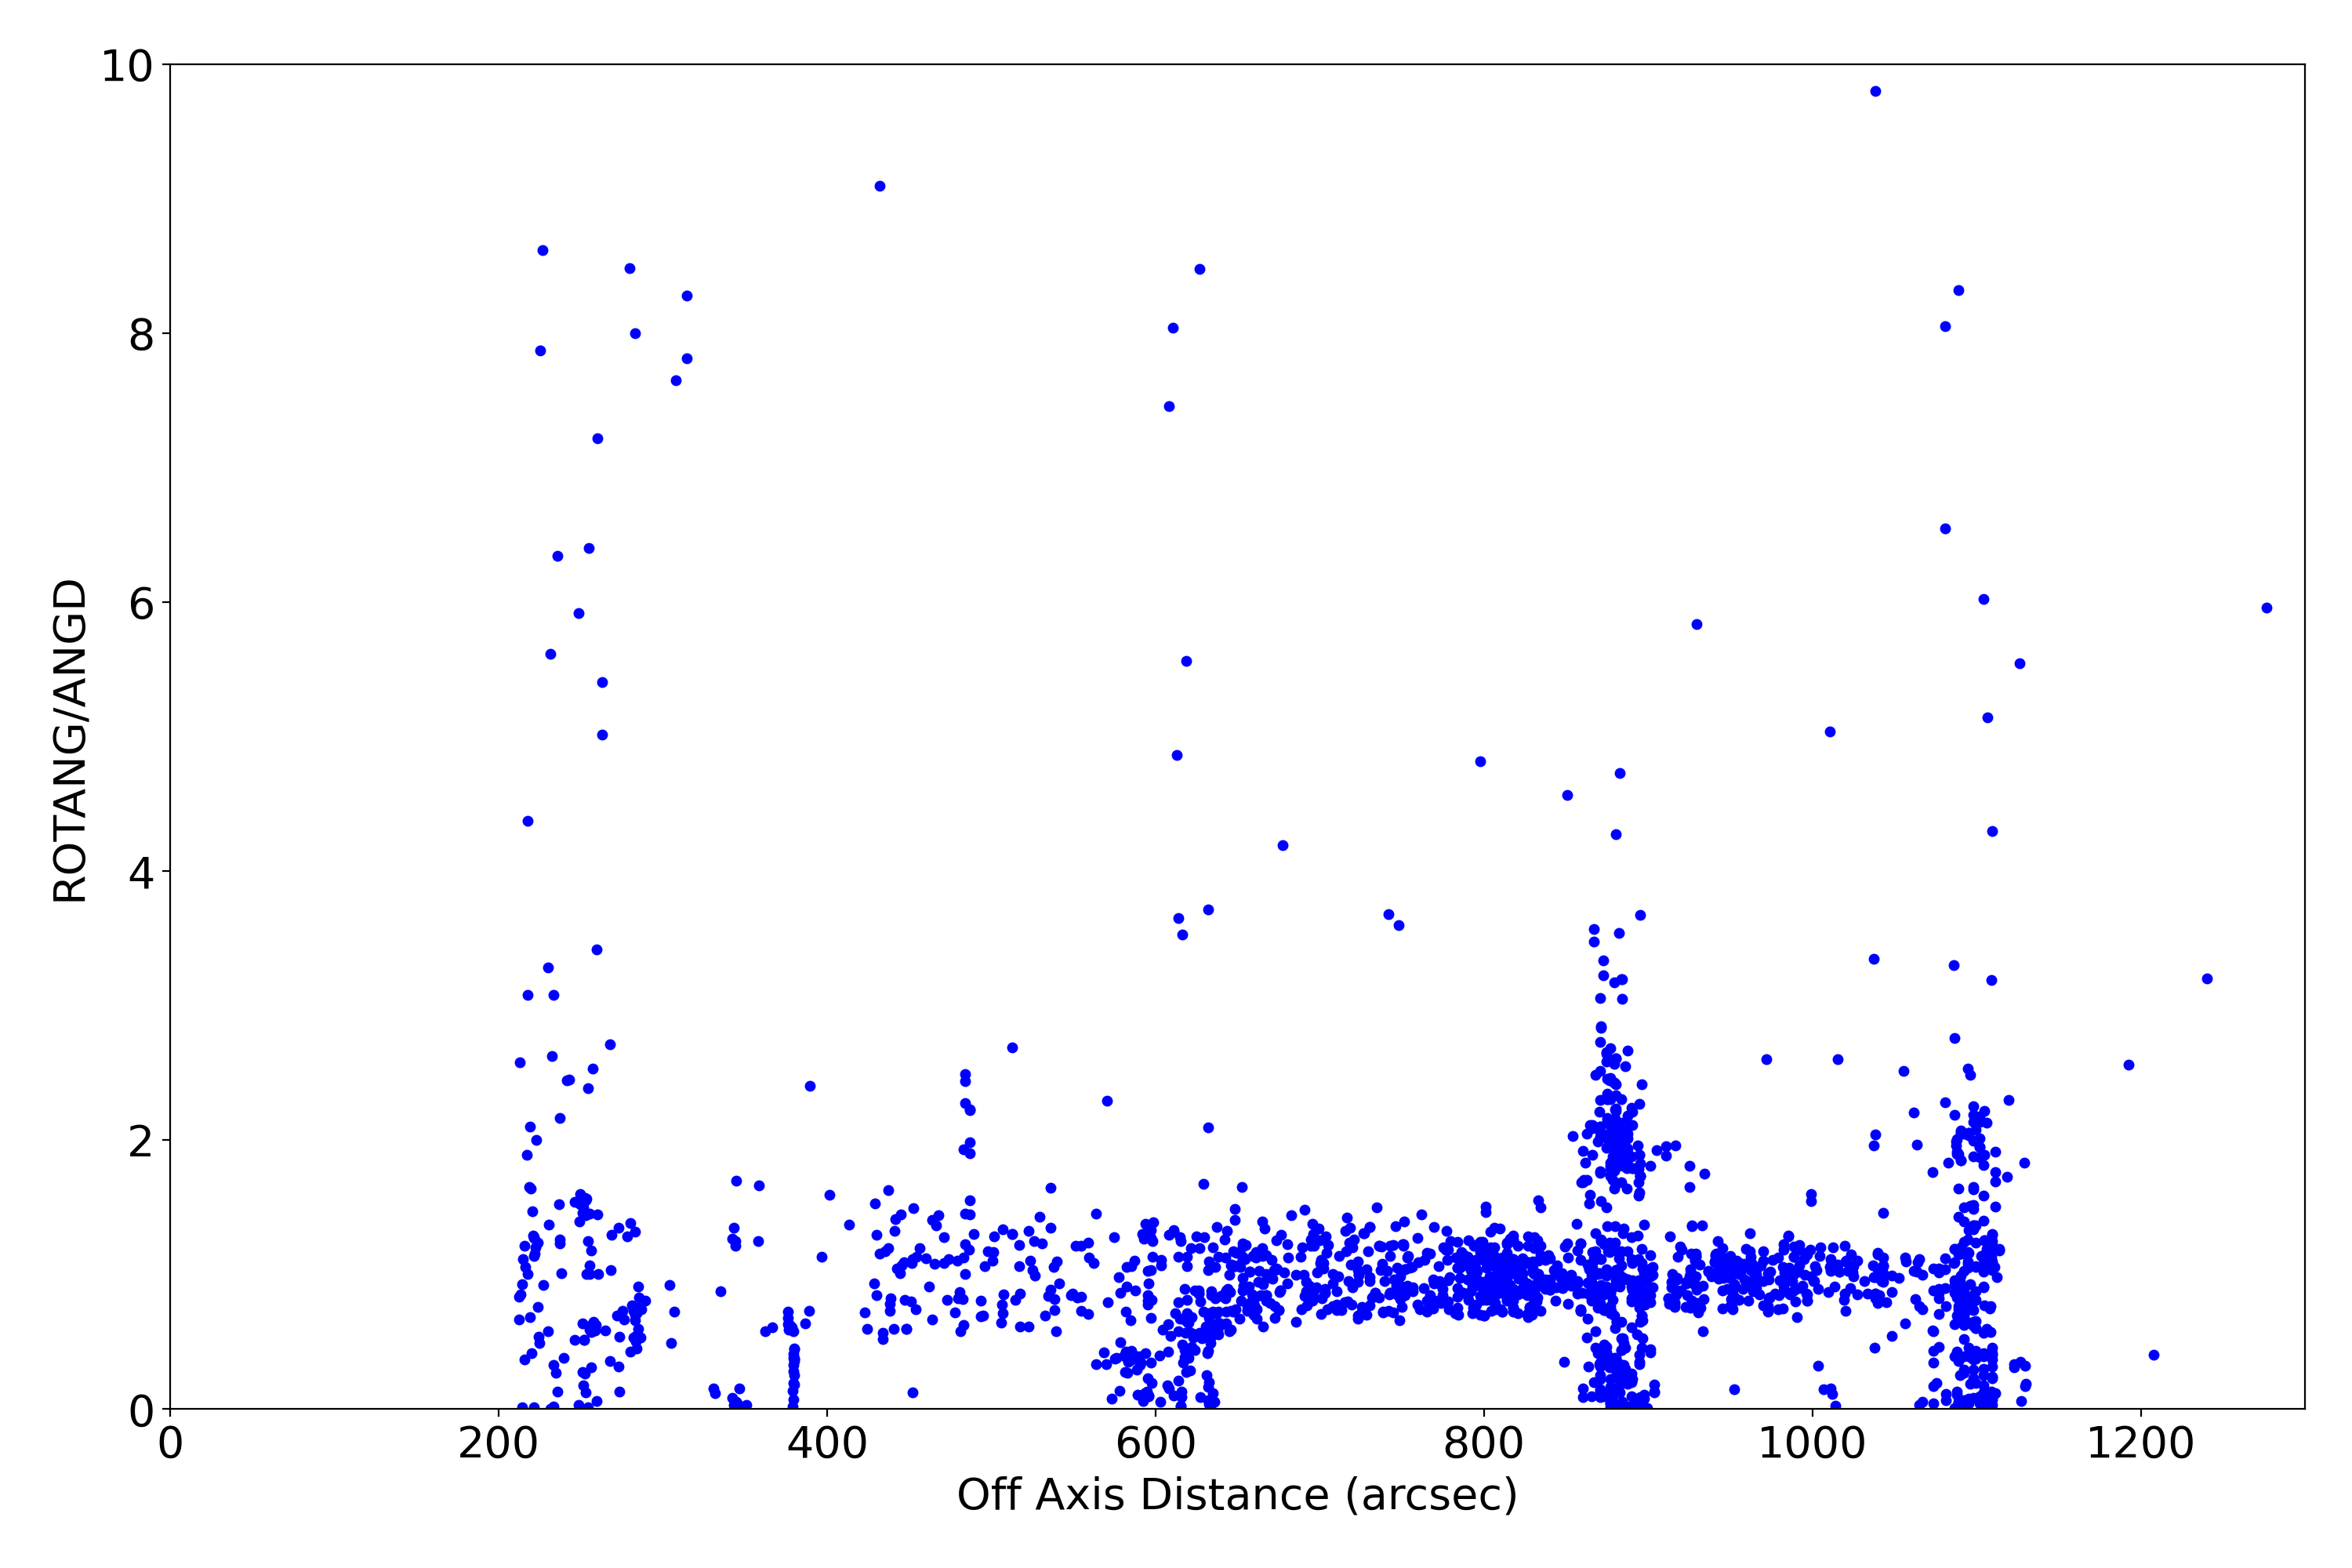
Plots below show various characteristics of detected imaging sources. Standard level 2 data products (*src2.fits) are used. Only observations with focus (sim_x) within 0.01 mm of nominal value for given SI configuration are used. Sources are also filtered for strength (SNR > 15).
| XY | PSF | Roundness | EE Radius | SNR | Rotation | Rotation2 | |
|---|---|---|---|---|---|---|---|
| ACIS I | 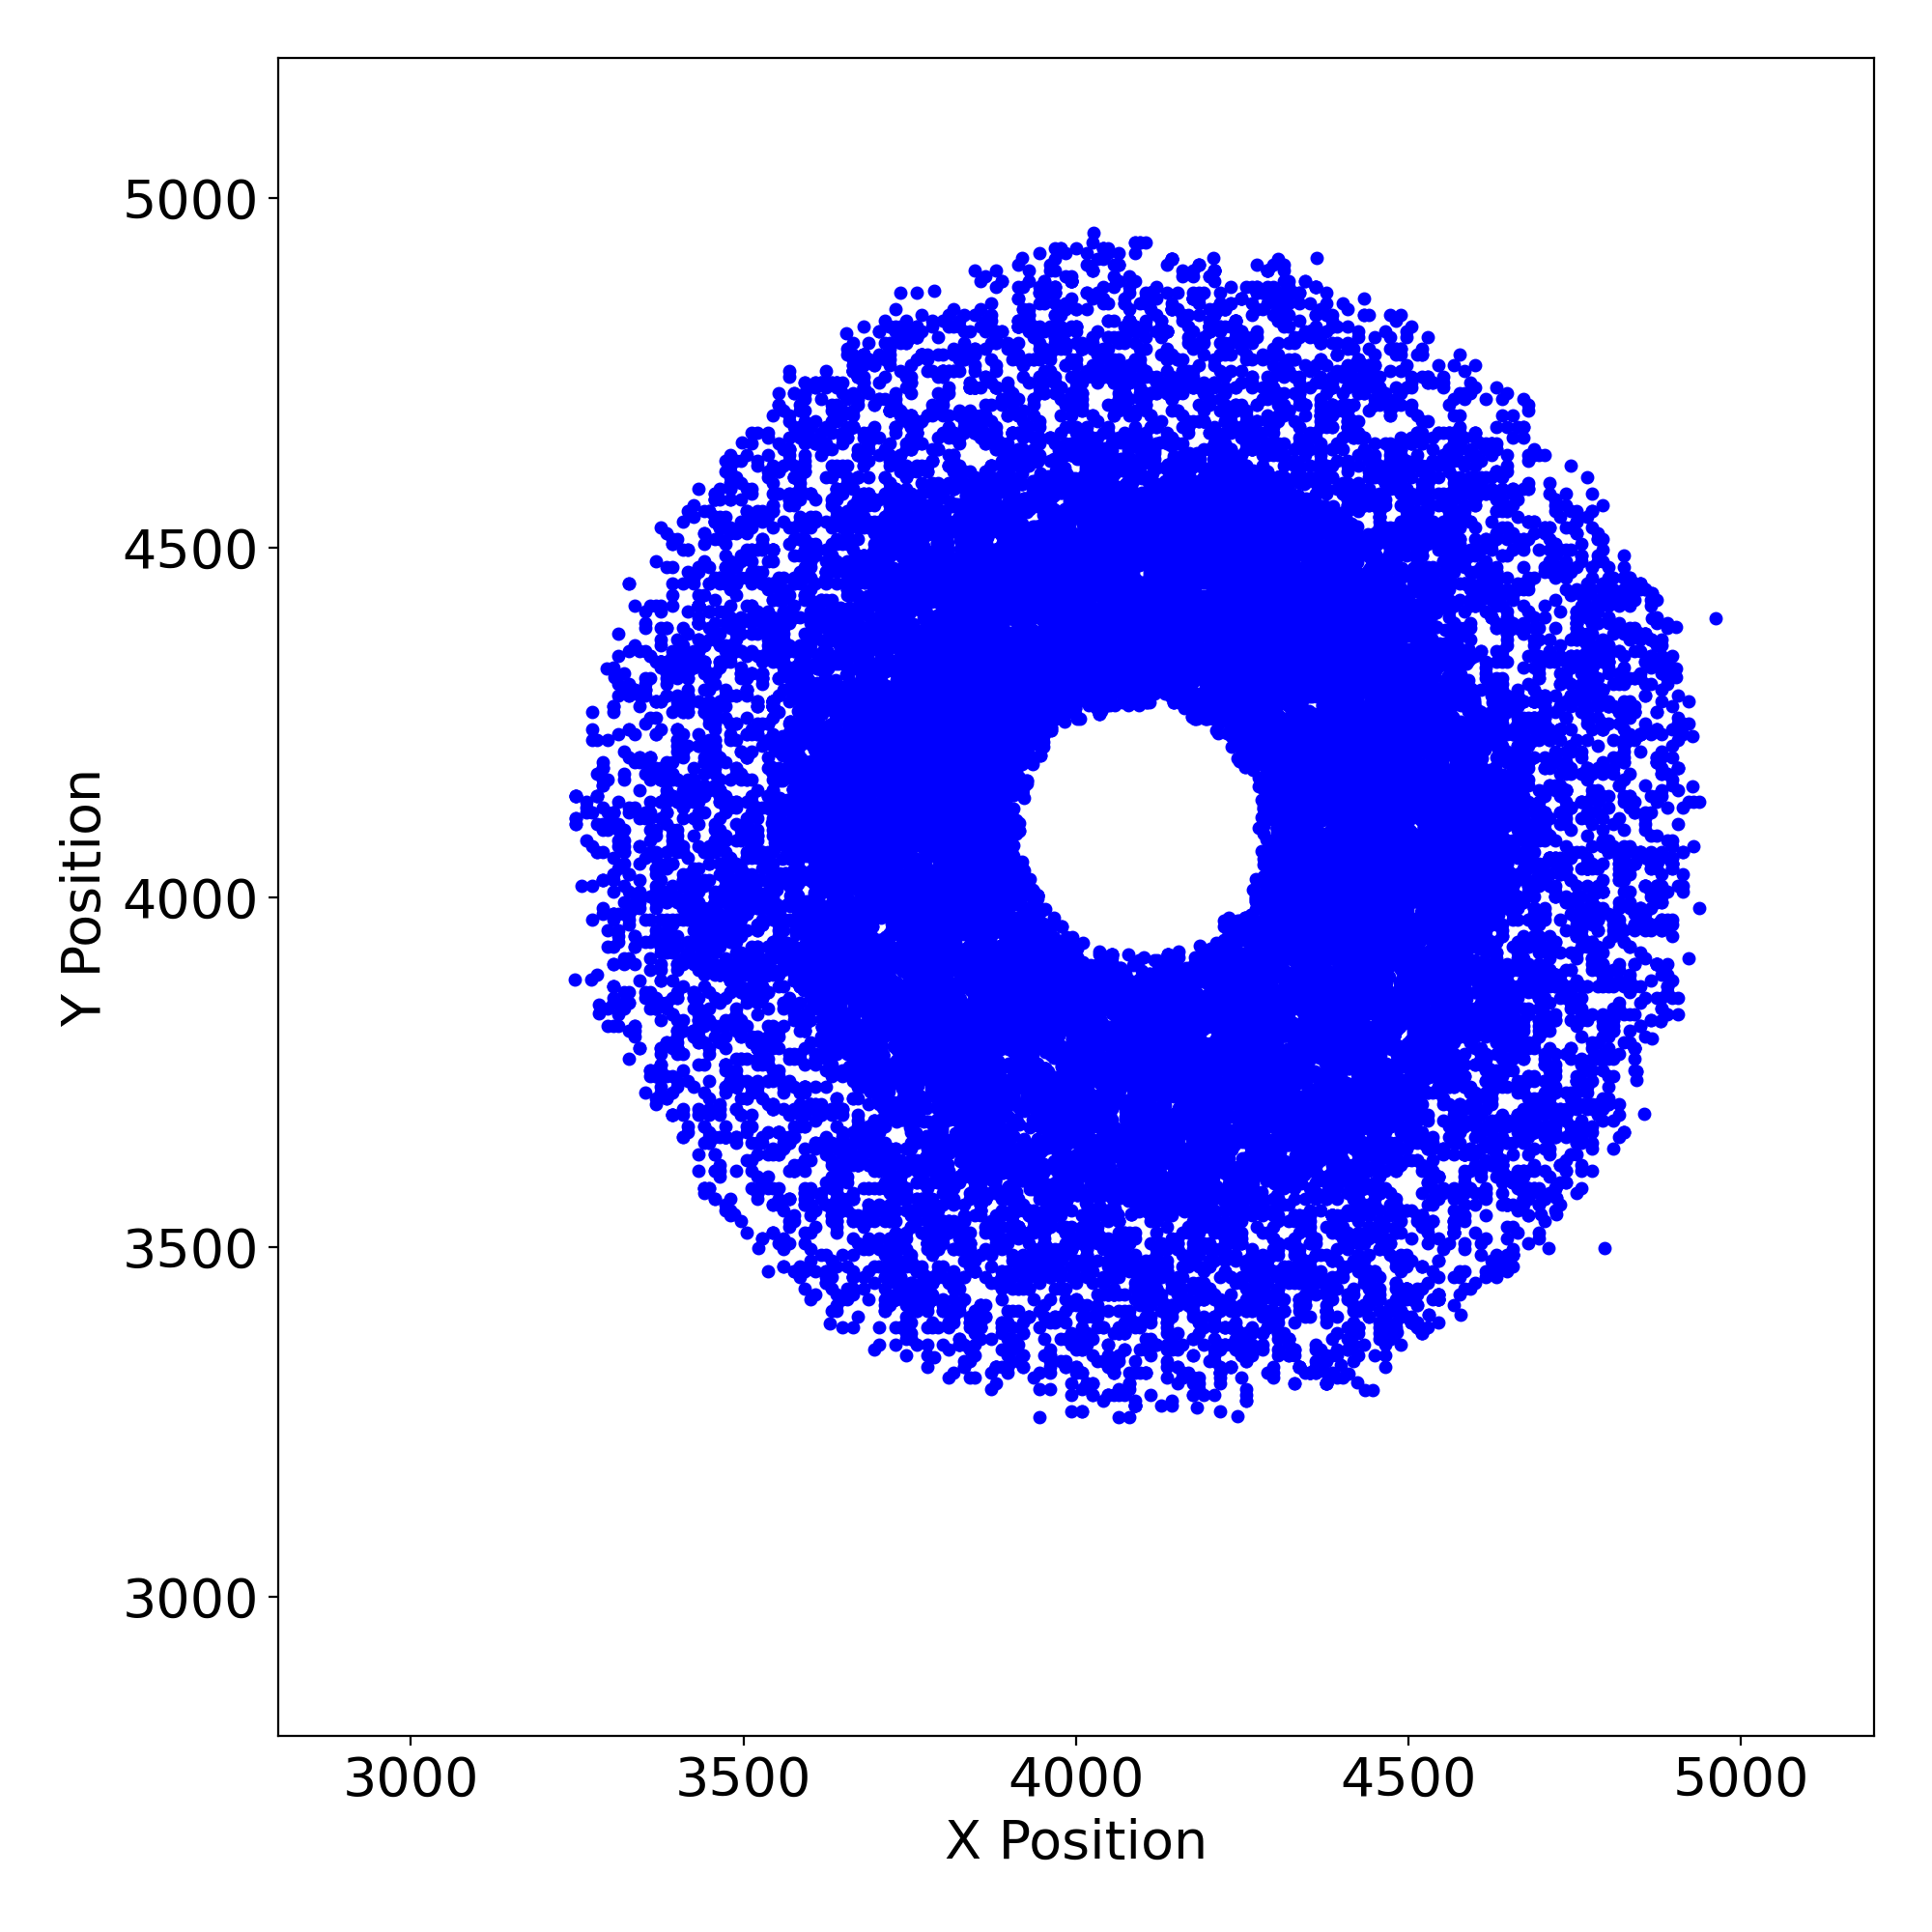 |
 |
 |
 |
 |
 |
 |
| ACIS S | 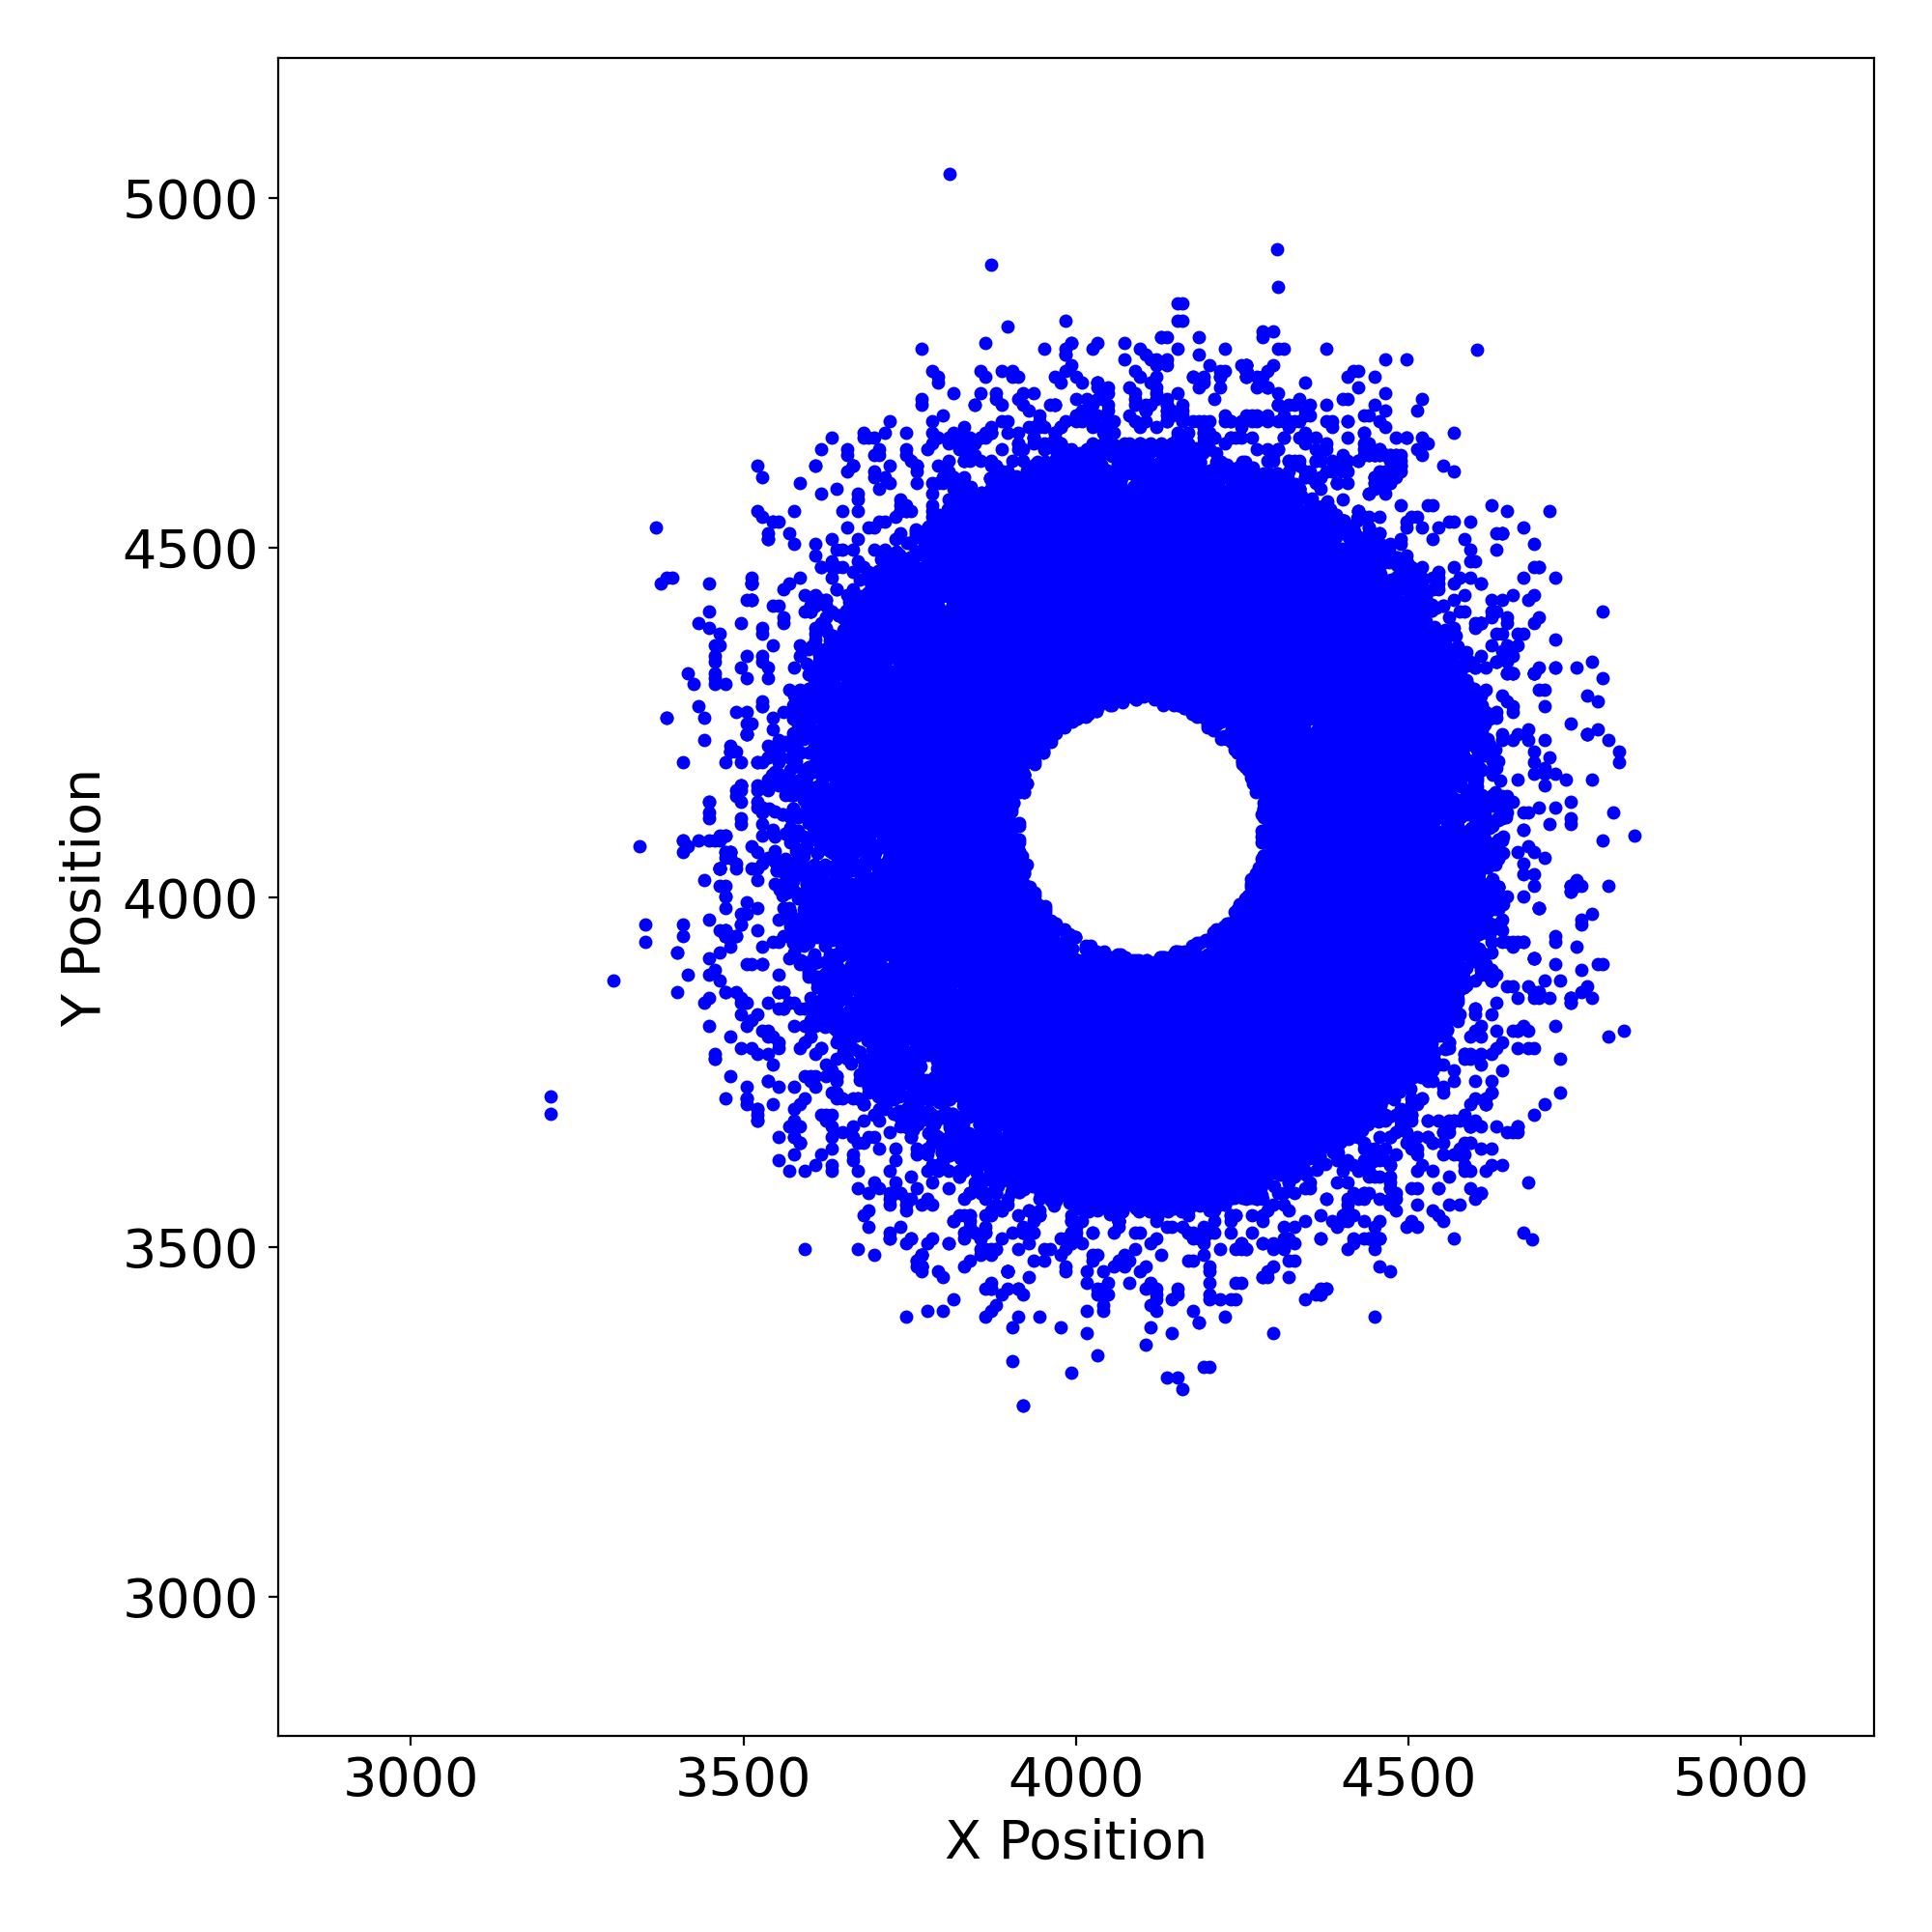 |
 |
 |
 |
 |
 |
 |
| HRC I | 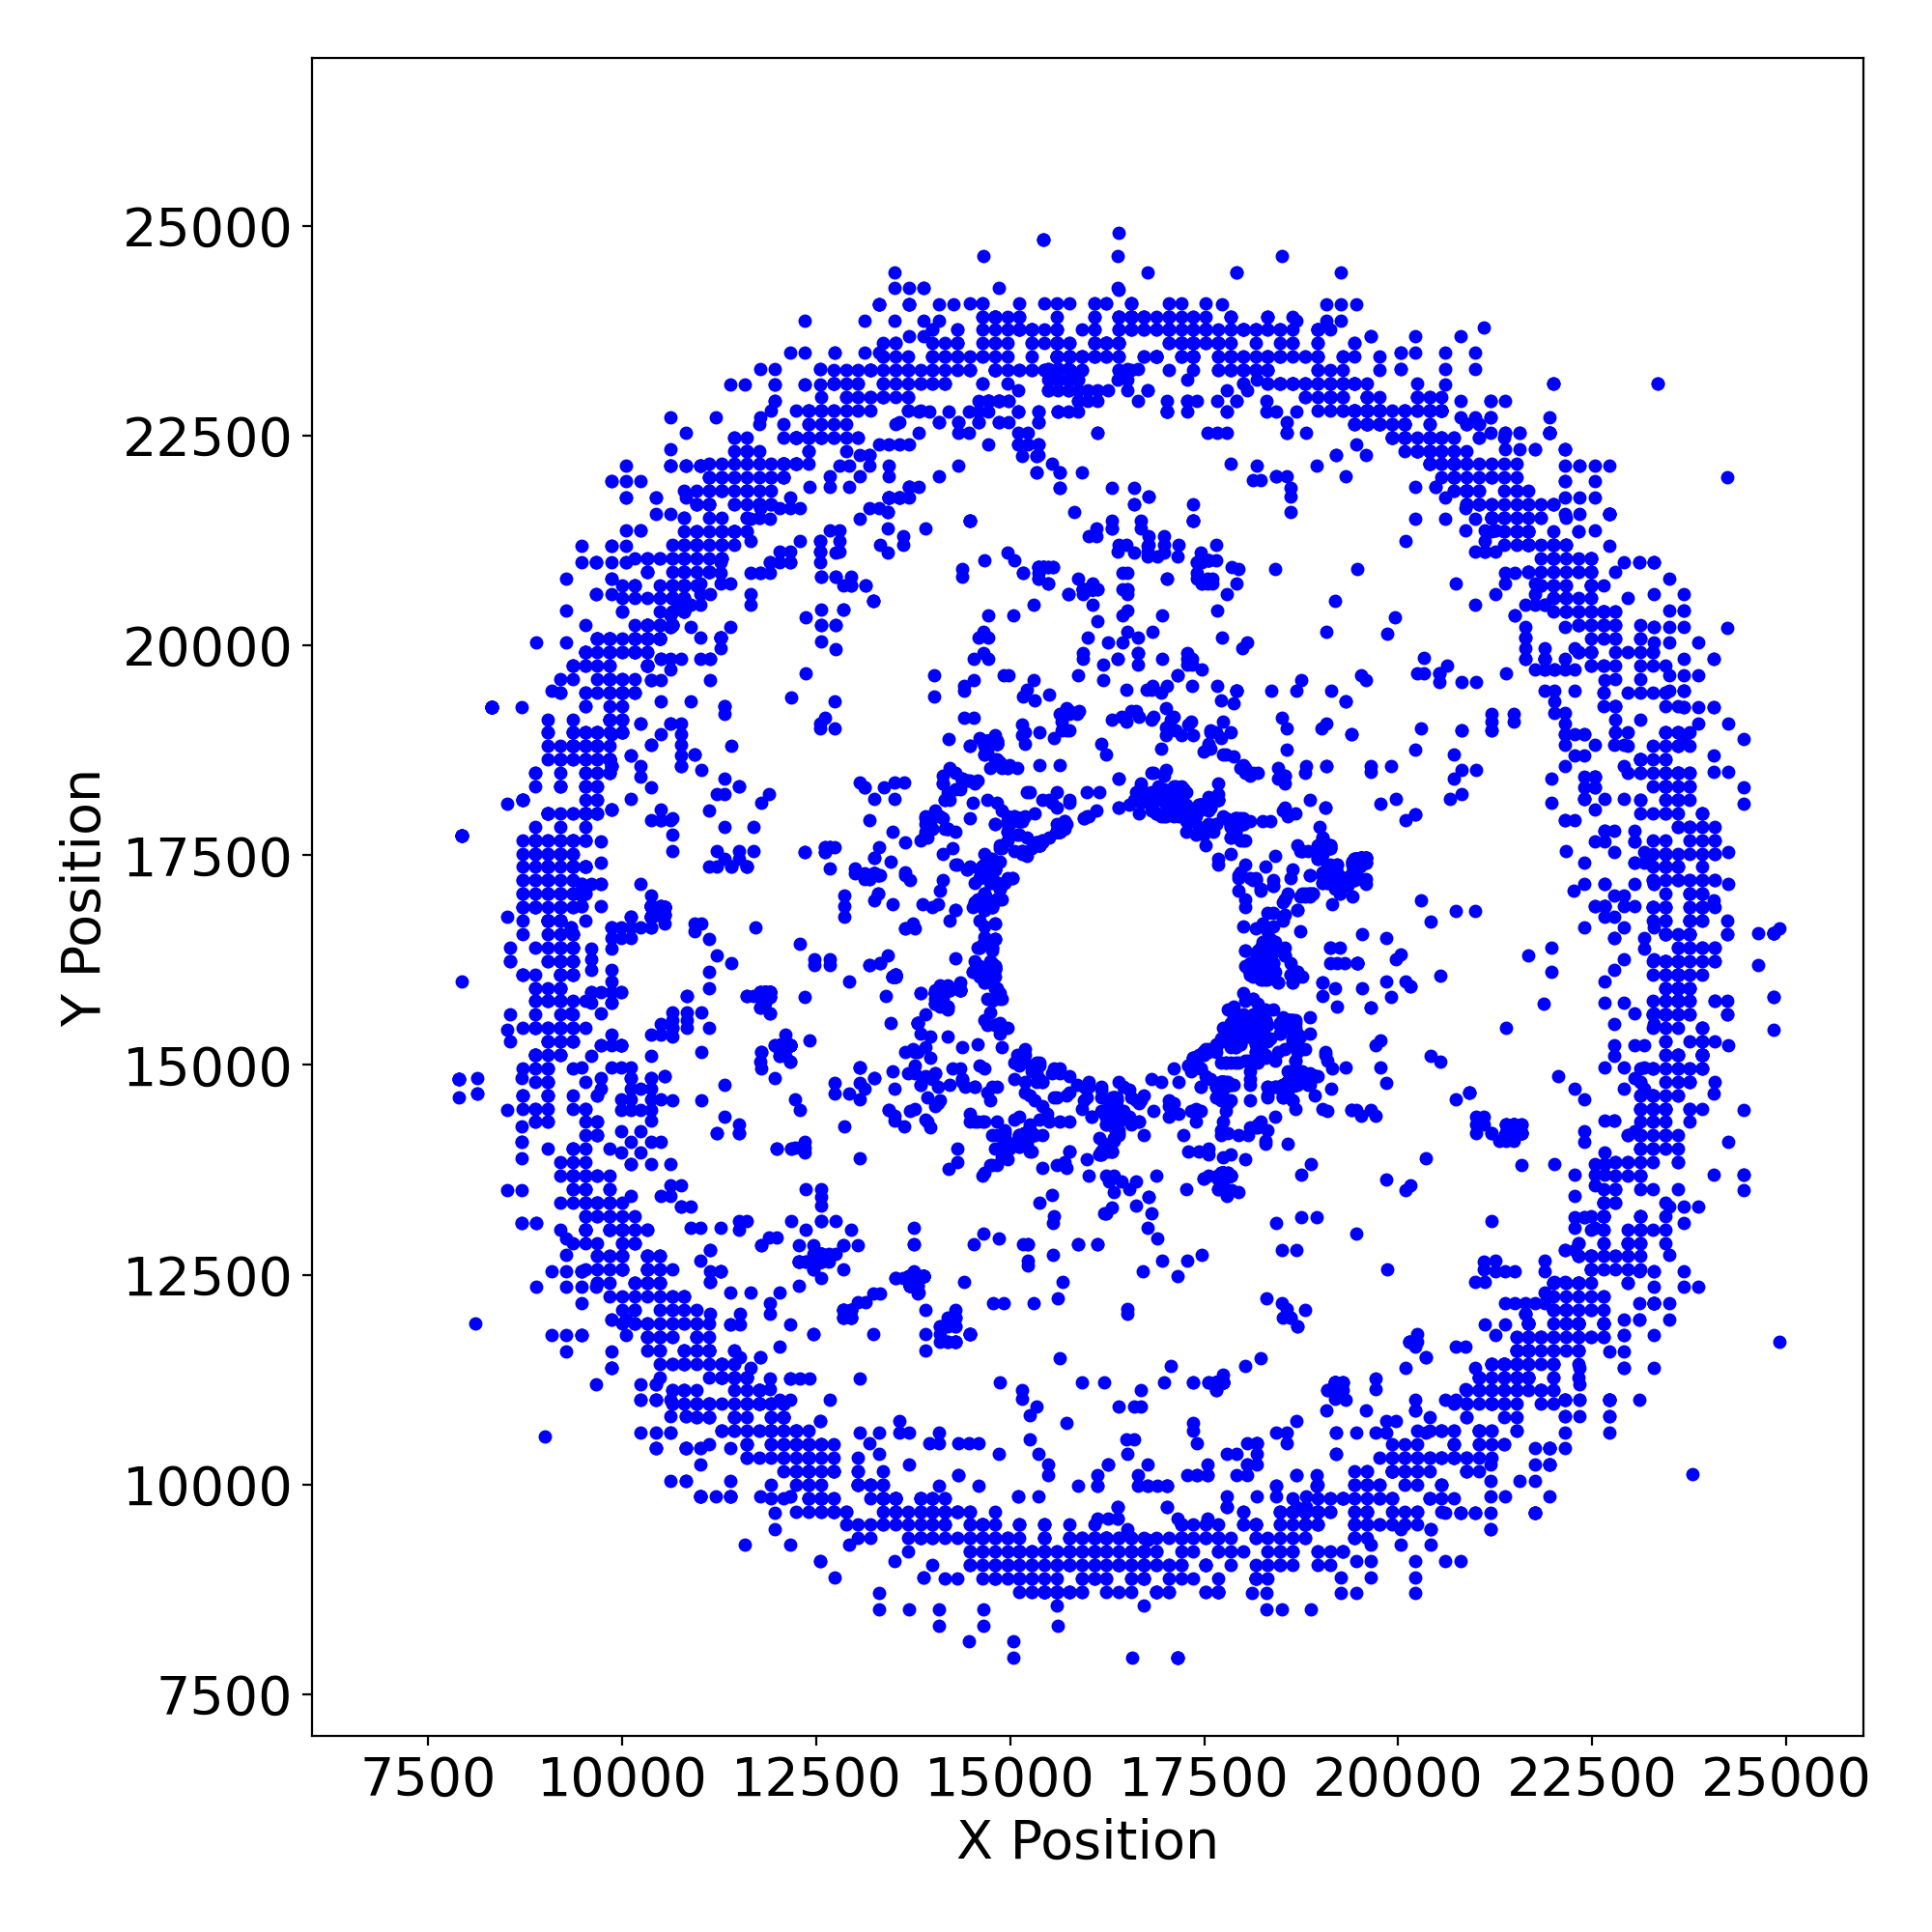 |
 |
 |
 |
 |
 |
 |
| HRC S | 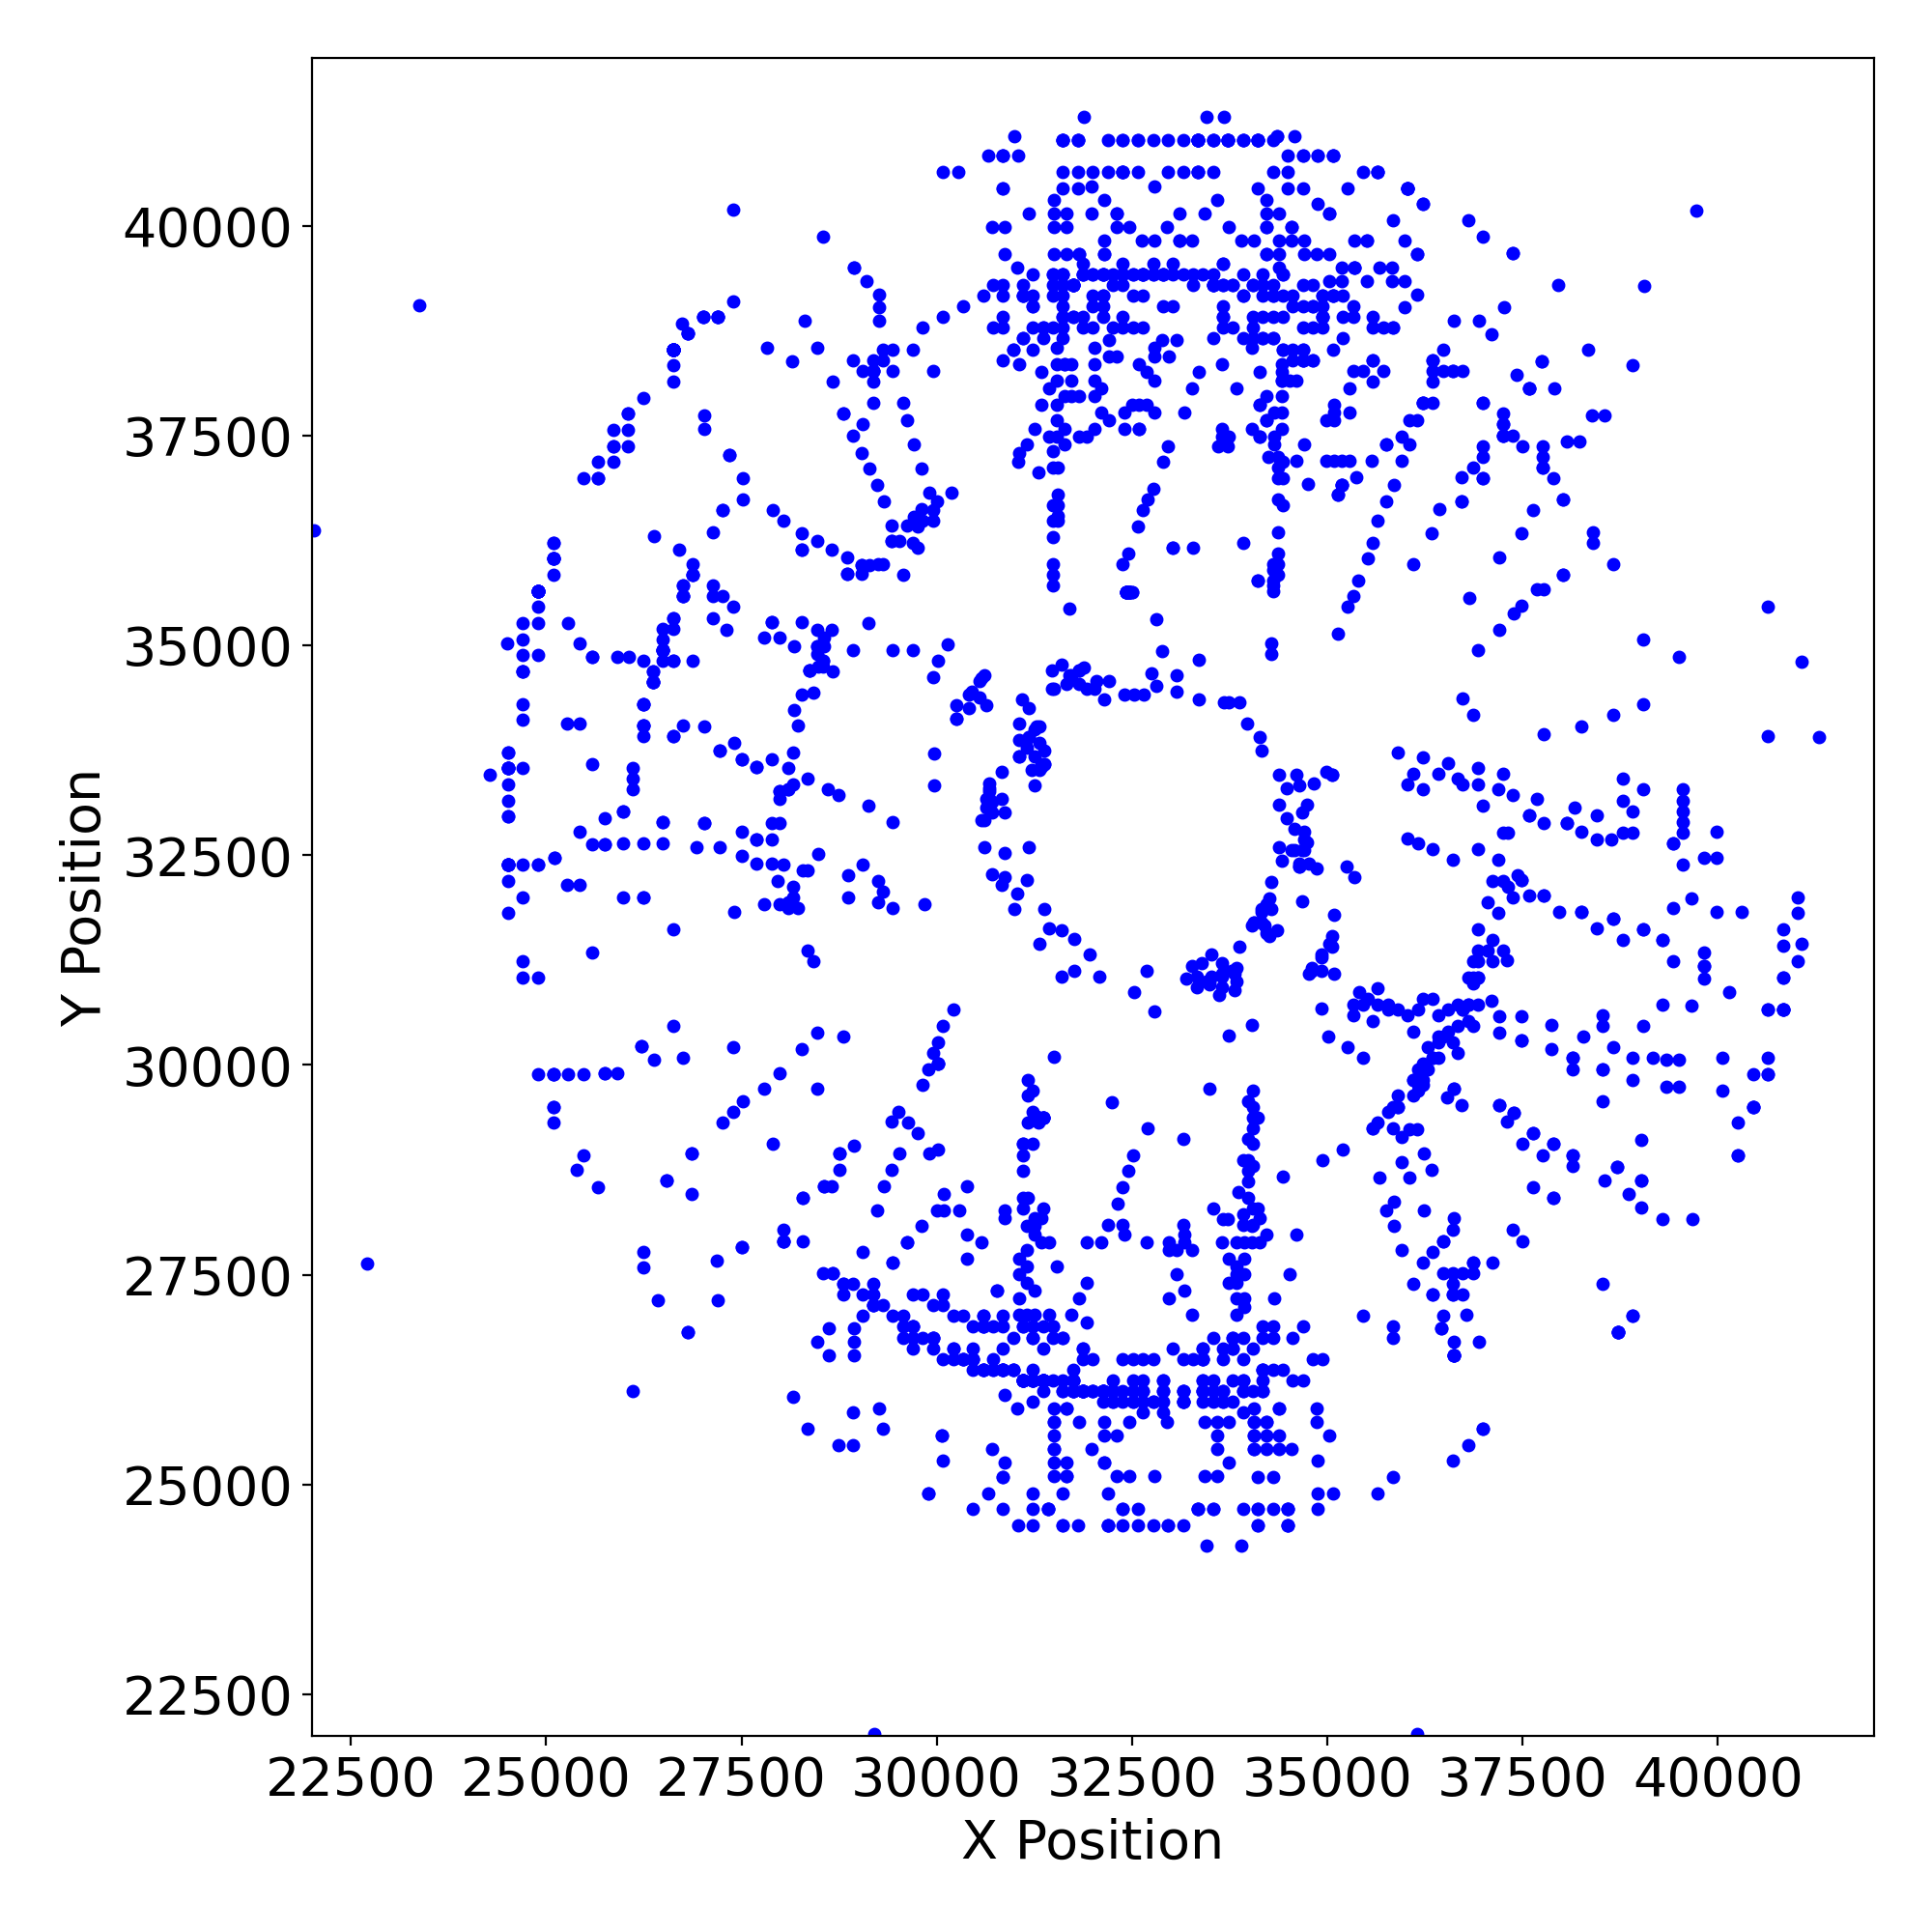 |
 |
 |
 |
 |
 |
 |
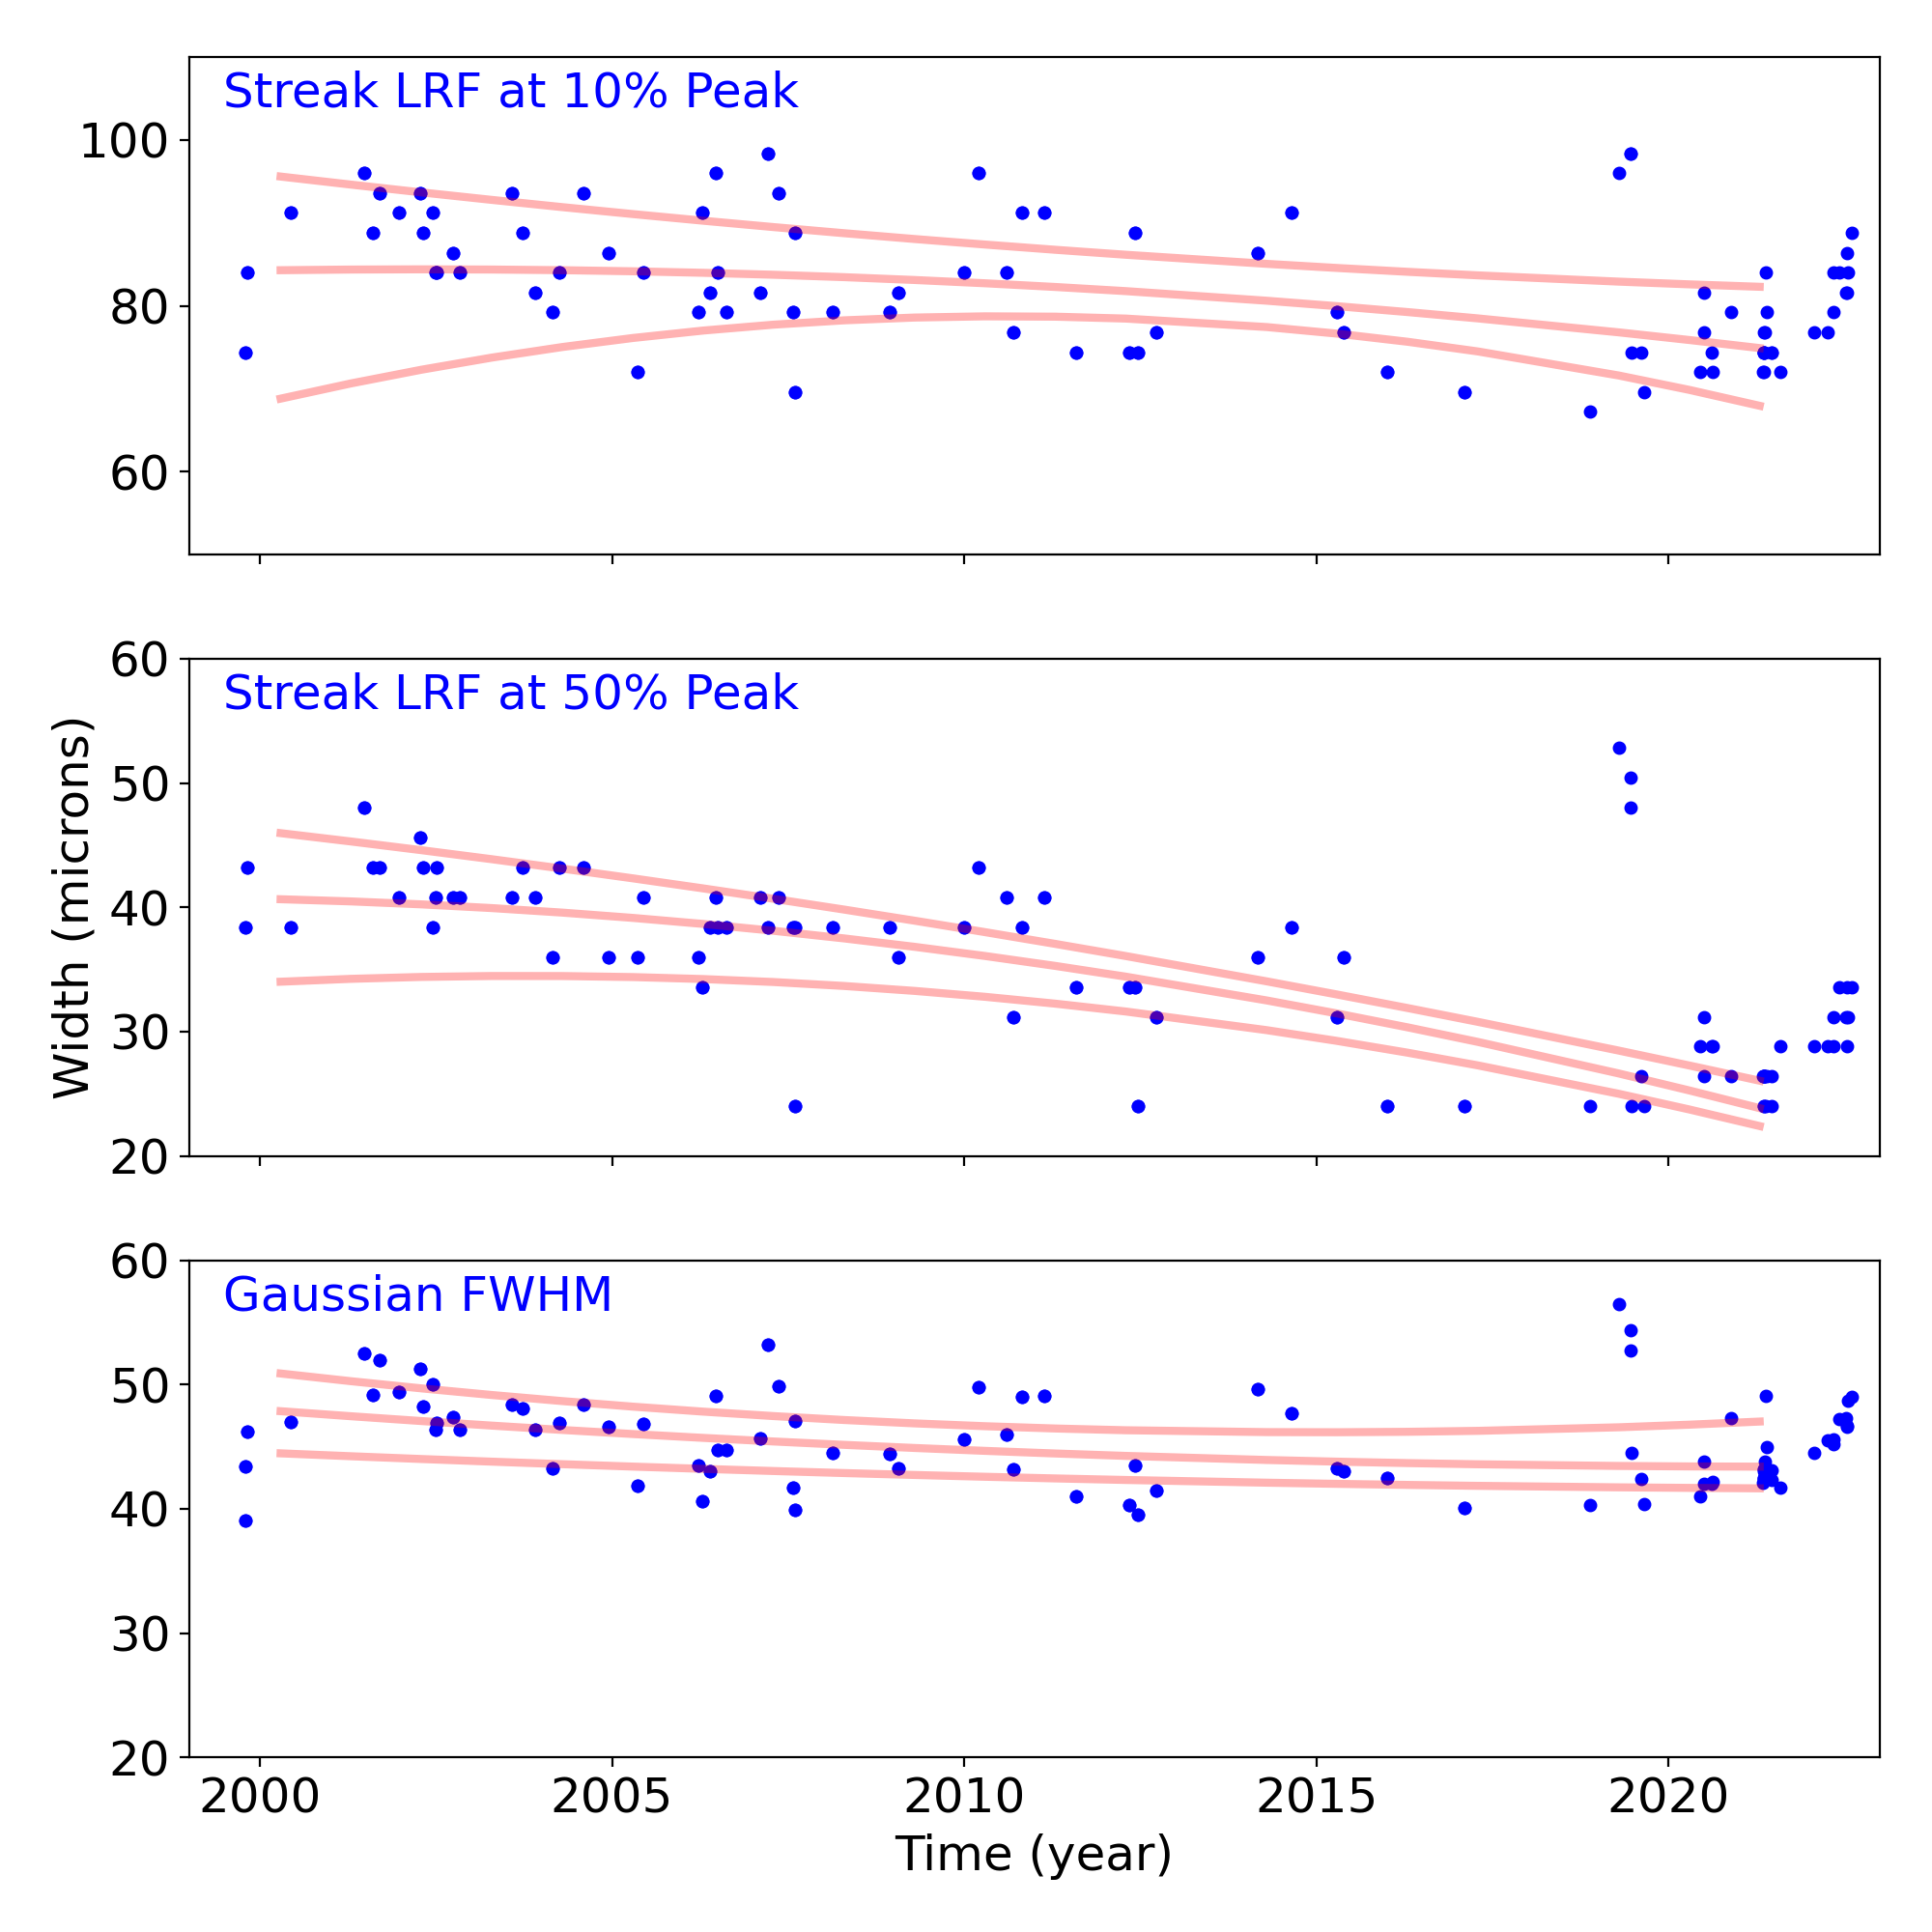
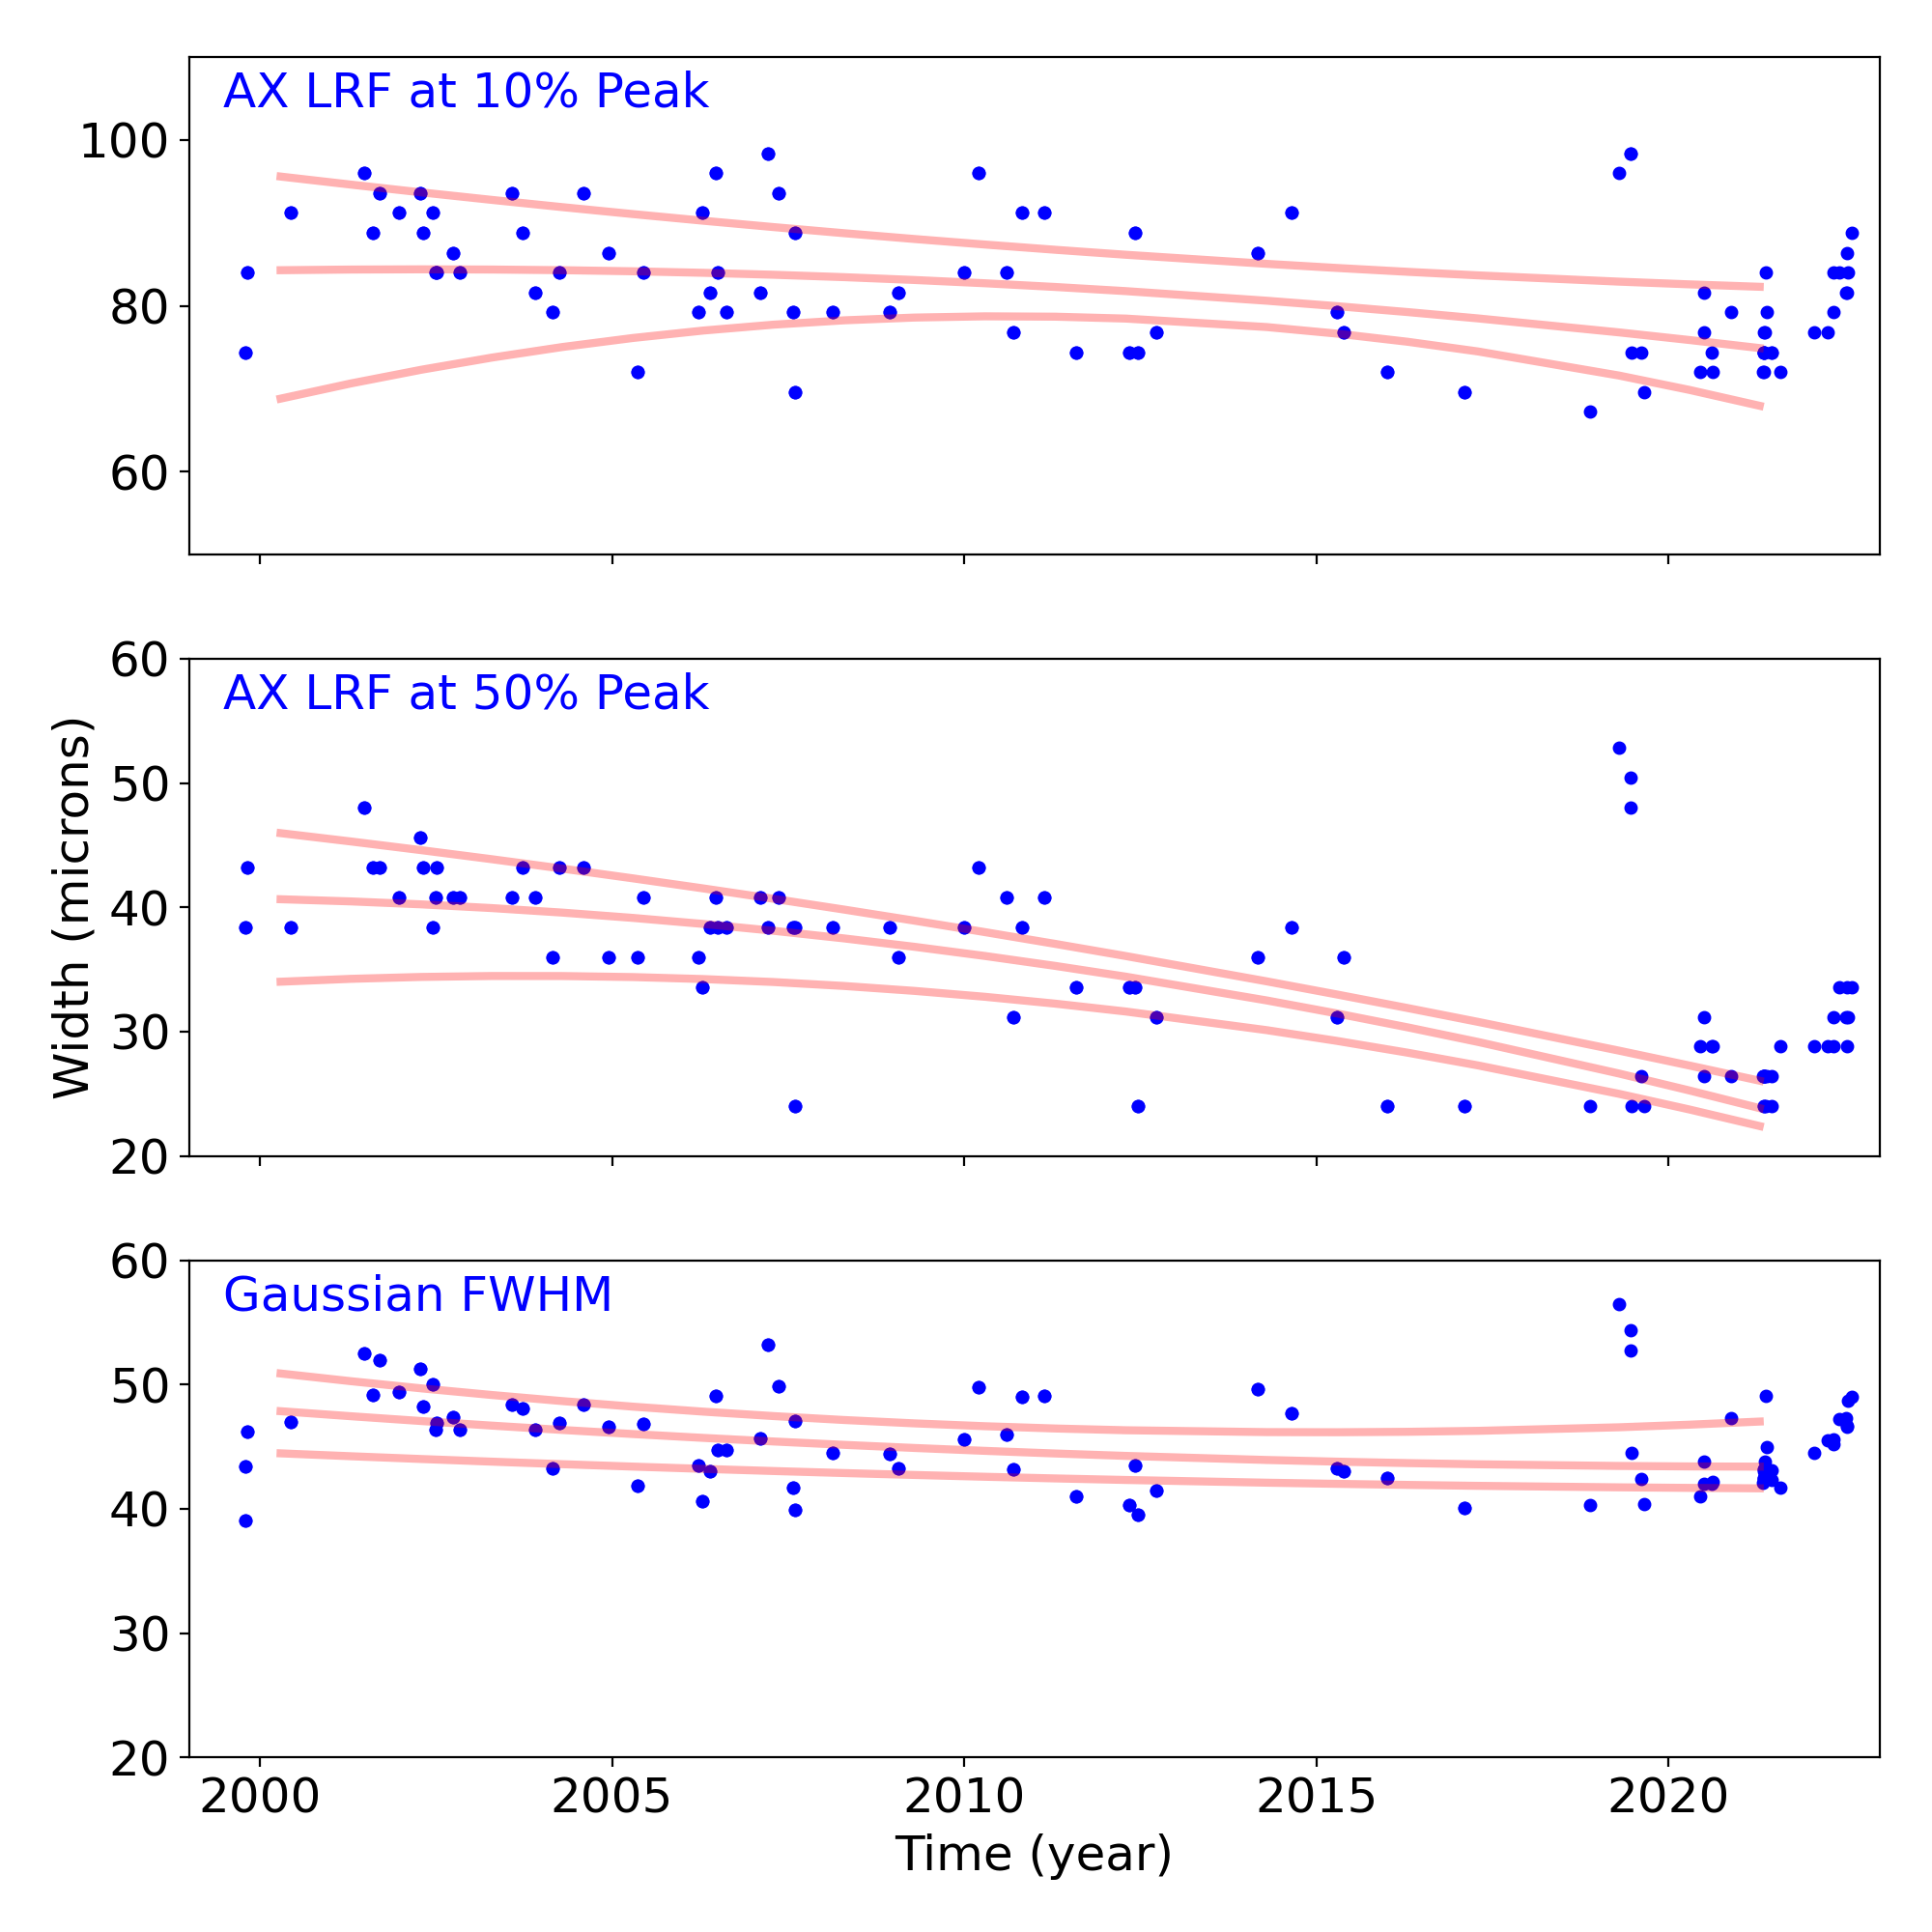
Gratings
Grating Trends/Focus
We plot the width of the zero order streak of ACIS/HETG observations and the width of the zero order image for HRC/LETG observations of point sources. No significant defocusing trend is seen at this time. See Gratings Trends pages.
PCAD
ACA Trending
| ACIS |
)
|
)
|
)
|
|
|---|---|---|---|---|
)
|
)
|
)
| ||
| HRCI |
)
|
)
|
)
|
)
|
| HRCI |
)
|
)
|
)
|
)
|
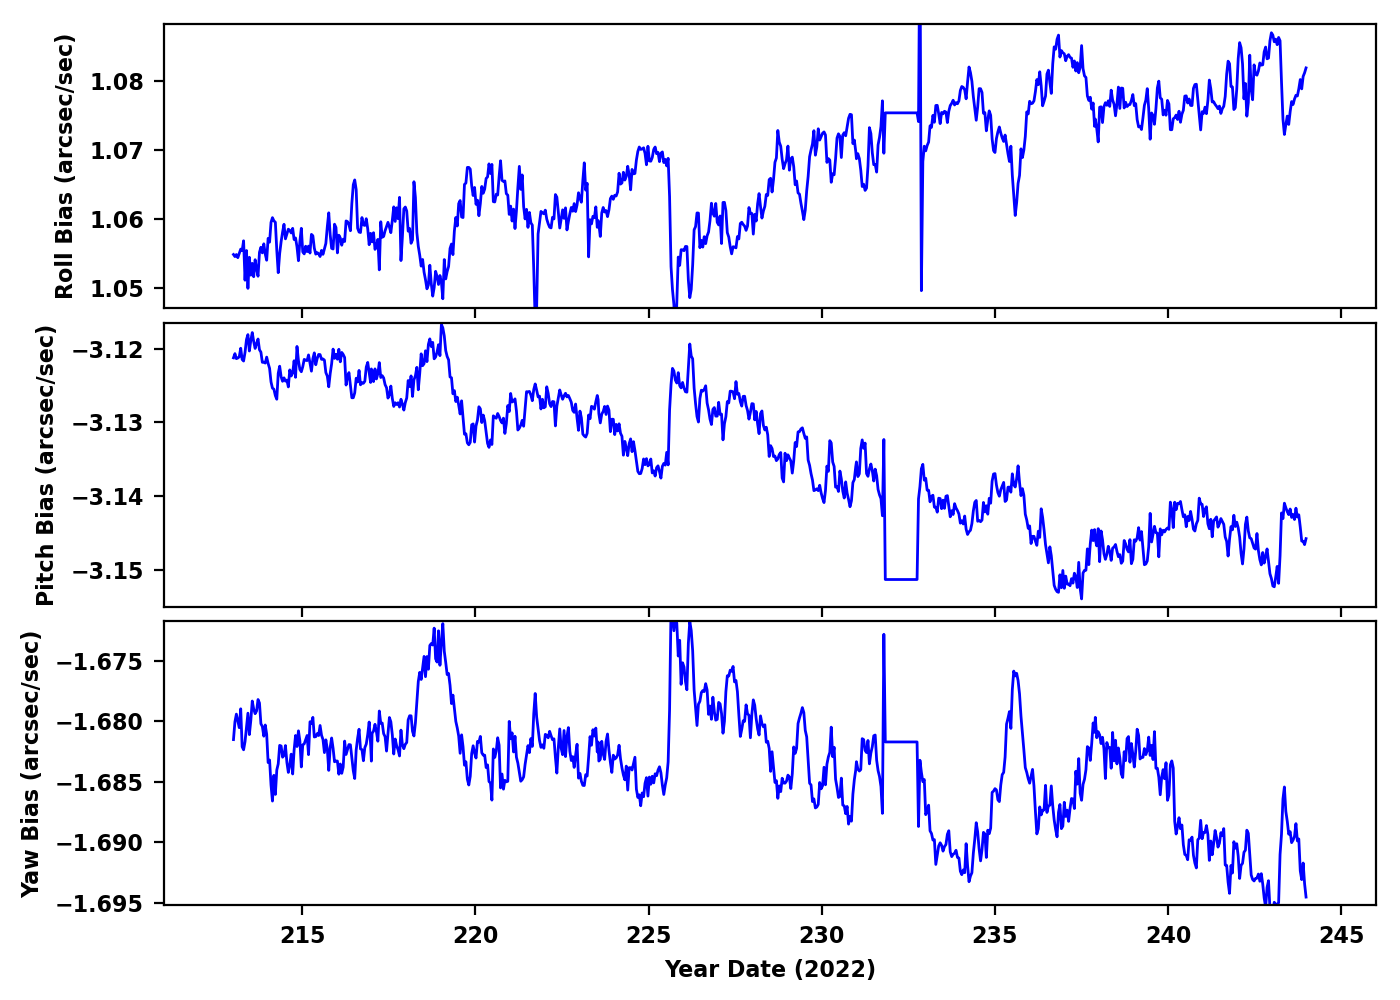
Gyro Bias Drift
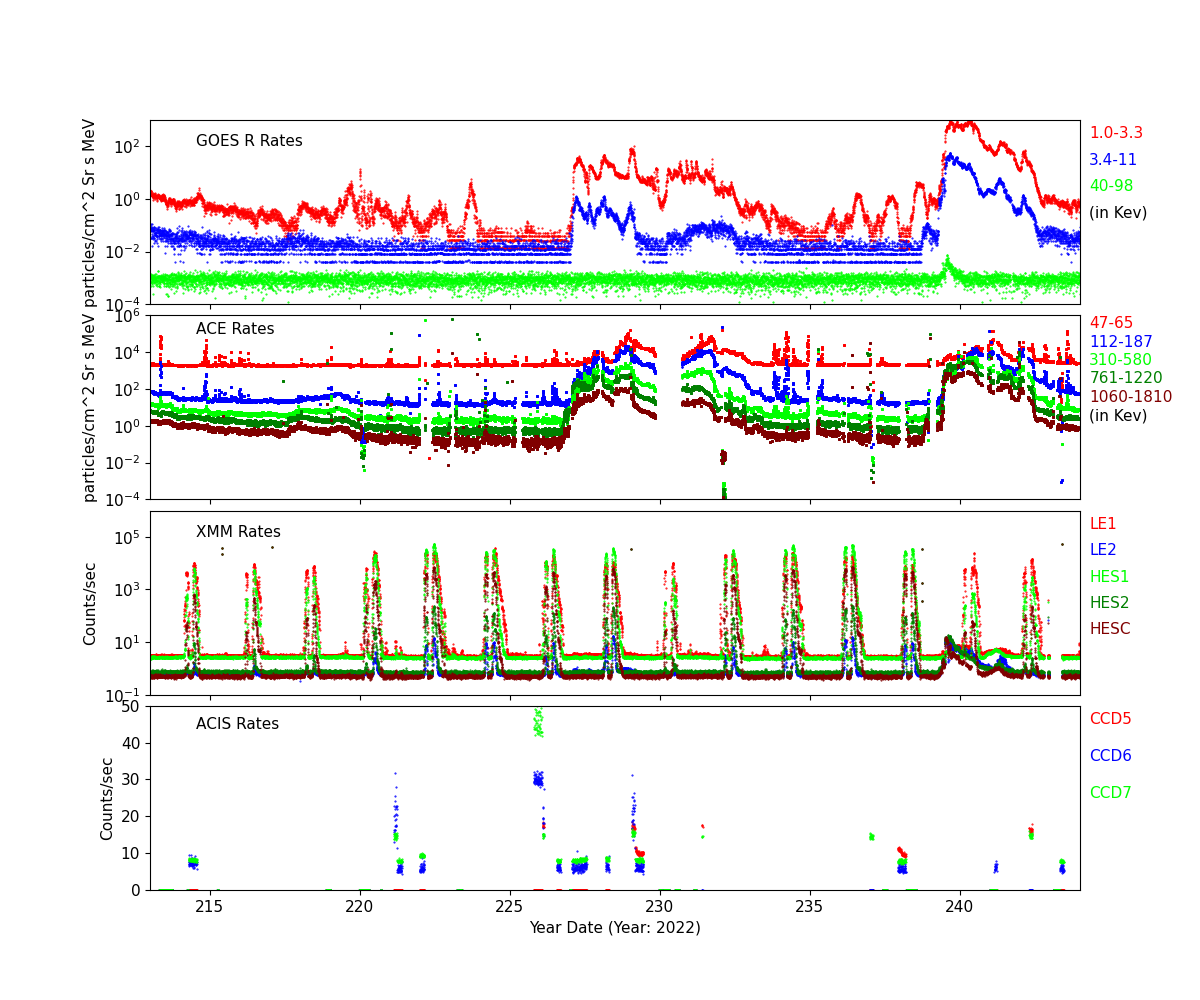
Radiation History
Radiation Count Rates of Aug 2022
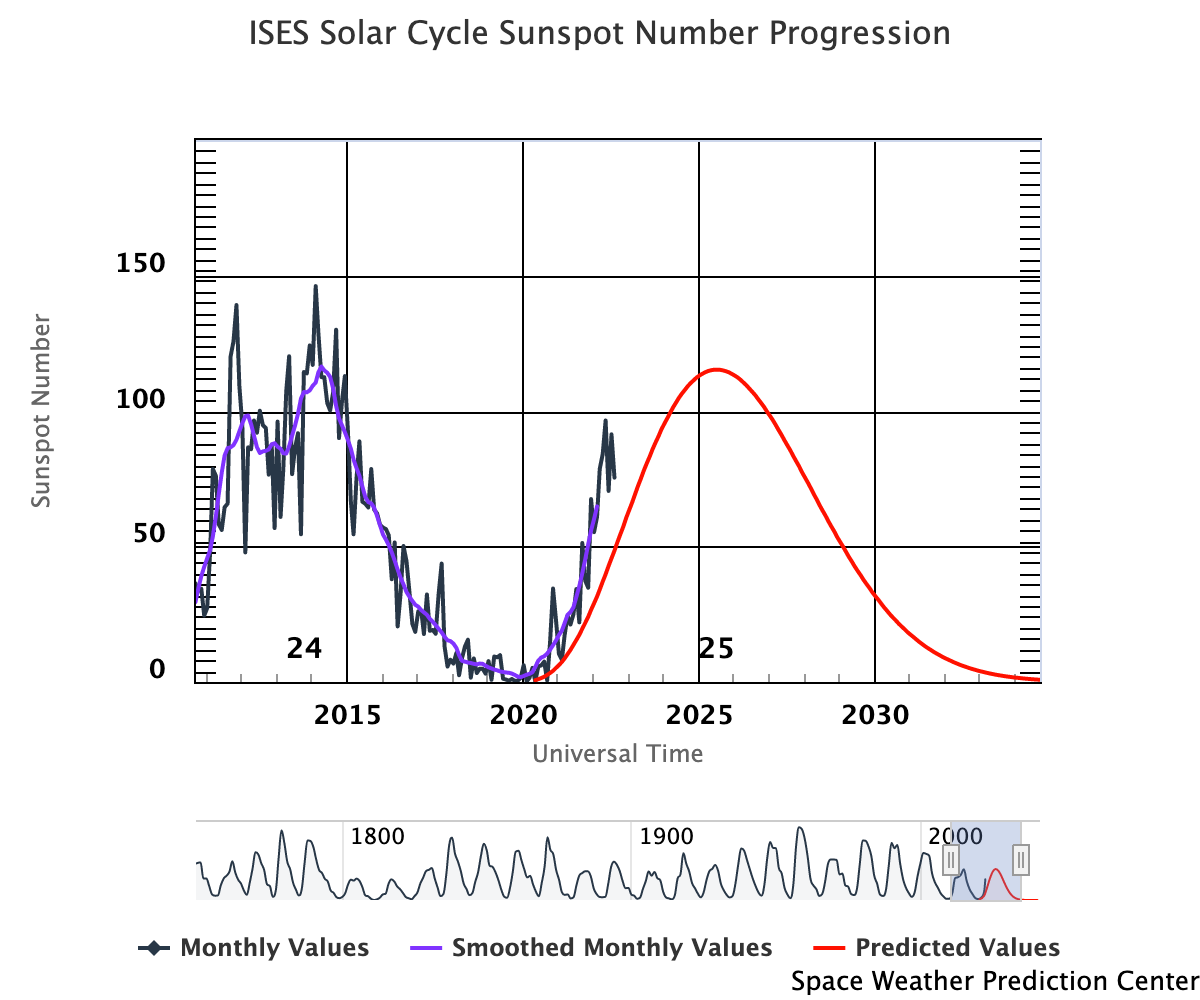
Sun Spot History (See:NOAA Page)
Trending
Quarterly Trends
- HRC Temperature
| Previous Quarter | |||||||
| MSID | MEAN | RMS | DELTA/YR | DELTA/YR/YR | UNITS | DESCRIPTION | |
| 2ceahvpt | 0.031 | 7.015e-04 | (2.78+/-0.02)e2 | 0.17 +/- 0.48 | K | CEA RADIATOR TEMPERATURE AT CENTER | |
|---|---|---|---|---|---|---|---|
| 2chtrpzt | 0.033 | 7.364e-04 | (2.75+/-0.02)e2 | 0.21 +/- 0.49 | K | CENTRAL ELECTRONICS BOX TEMP | |
| 2condmxt | 0.023 | 8.412e-04 | (2.70+/-0.02)e2 | 0.13 +/- 0.54 | K | CONDUIT -X FACE TEMPERATURE | |
| 2dcentrt | 0.011 | 3.344e-04 | (2.73+/-0.01)e2 | 0.30 +/- 0.23 | K | DETECTOR HOUSING TEMP 2 | |
| 2dtstatt | 0.003 | 3.467e-04 | (2.70+/-0.01)e2 | 0.36 +/- 0.20 | K | DETECTOR HOUSING TEMP 1 | |
| 2fhtrmzt | 0.019 | 7.843e-04 | (2.64+/-0.02)e2 | -0.80 +/- 0.64 | K | FRONT END ELECTRONICS BOX TEMPERATURE | |
| 2fradpyt | 0.017 | 8.869e-04 | (2.62+/-0.02)e2 | -1.19 +/- 0.71 | K | FRONT END ASSEMBLY +Y AT RADIATOR CENTER TEMP | |
| 2pmt1t | 0.011 | 9.344e-04 | (2.84+/-0.02)e2 | 0.23 +/- 0.69 | K | PMT 1 TEMPERATURE | |
| 2pmt2t | 0.011 | 9.205e-04 | (2.84+/-0.02)e2 | 0.28 +/- 0.68 | K | PMT 2 TEMPERATURE | |
| 2uvlspxt | 0.020 | 7.035e-04 | (2.75+/-0.02)e2 | 1.10 +/- 0.55 | K | UV LIGHT SHIELD NEXT TO SNOUT TEMP | |
- HRC HK
| Previous Quarter | |||||||
| MSID | MEAN | RMS | DELTA/YR | DELTA/YR/YR | UNITS | DESCRIPTION | |
| 2fe00atm | 0.005 | 0.018 | -3.13 +/- 2.56 | (0.00+/-0.00)e0 | C | Front end temperature | |
|---|---|---|---|---|---|---|---|
| 2fepratm | on | 0.075 | 0.004 | 25.19 +/- 1.89 | -2.48 +/- 1.79 | C | FE temp card temperature | off | 0.003 | 0.018 | -2.96 +/- 2.50 | (0.00+/-0.00)e0 |
| 2imhvatm | on | 0.046 | 0.003 | 31.71 +/- 1.25 | -1.31 +/- 1.13 | C | Imaging det HVPS temperature | off | 0.049 | 0.009 | 14.66 +/- 2.22 | (0.00+/-0.00)e0 |
| 2iminatm | on | 0.064 | 0.003 | 20.52 +/- 1.59 | -1.25 +/- 1.57 | C | Imaging det temperature | off | 0.020 | 0.002 | 0.72 +/- 0.82 | (0.00+/-0.00)e0 |
| 2lvplatm | on | 0.036 | 0.003 | 28.00 +/- 1.17 | -1.19 +/- 1.10 | C | LVPS plate temperature | off | 0.036 | 0.008 | 9.15 +/- 1.76 | (0.00+/-0.00)e0 |
| 2prbscr | on | 0.001 | 1.075e-04 | 1.76 +/- 0.05 | -0.03 +/- 0.05 | AMP | Primary bus current | off | 4.518e-04 | 1.217e-04 | 1.69 +/- 0.02 | (0.00+/-0.00)e0 |
| 2prbsvl | -0.004 | 6.260e-04 | 26.95 +/- 0.17 | (0.00+/-0.00)e0 | V | Primary bus voltage | |
| 2smtratm | on | 2.481e-13 | 2.768e-09 | 5.94 +/- 0.00 | (2.46+/-13.58)e-13 | C | Selected motor temperature | off | 1.597e-16 | 8.444e-10 | 5.66 +/- 0.00 | (0.00+/-0.00)e0 |
| 2sphvatm | on | -0.002 | 0.003 | 31.48 +/- 1.19 | -0.02 +/- 1.24 | C | Spect det HVPS temperature | off | 0.044 | 0.009 | 14.96 +/- 2.12 | (0.00+/-0.00)e0 |
| 2spinatm | on | 0.054 | 0.003 | 19.08 +/- 1.49 | -1.14 +/- 1.53 | C | Spect det temperature | off | 0.026 | 0.007 | 3.40 +/- 1.35 | (0.00+/-0.00)e0 |
- PCAD Temperature
| Previous Quarter | |||||||
| MSID | MEAN | RMS | DELTA/YR | DELTA/YR/YR | UNITS | DESCRIPTION | |
| aacccdpt | 0.006 | 8.926e-04 | (2.64+/-0.02)e2 | 0.65 +/- 0.55 | K | AC CCD TEMP (PRI) | |
|---|---|---|---|---|---|---|---|
| aacccdrt | 0.005 | 8.388e-04 | (3.08+/-0.02)e2 | 1.03 +/- 0.58 | K | AC CCD TEMP (RDNT) | |
| aach1t | 0.005 | 8.505e-04 | (3.06+/-0.02)e2 | 1.27 +/- 0.59 | K | AC HOUSING TEMP (ACH1) | |
| aach2t | 0.005 | 8.519e-04 | (3.06+/-0.02)e2 | 1.20 +/- 0.59 | K | AC HOUSING TEMP (ACH2) | |
Spacecraft Motions
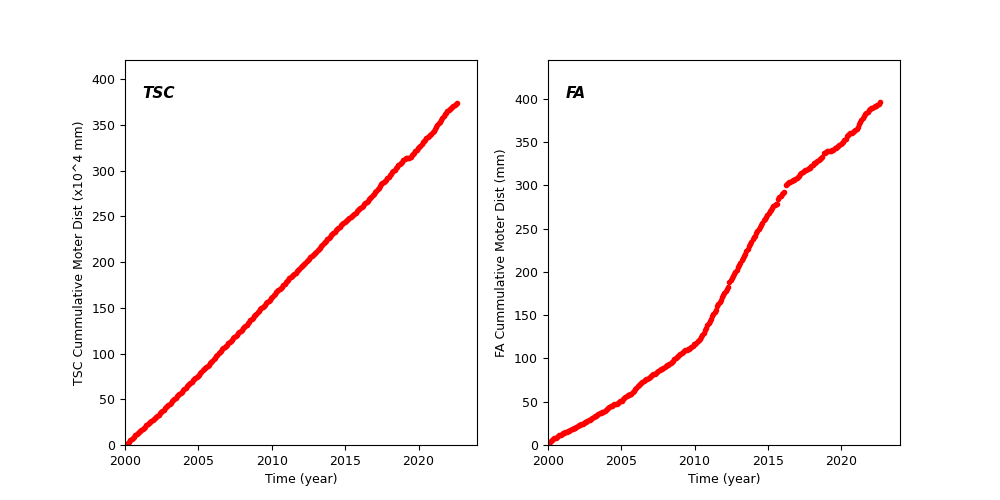
TSC and FA Cummulative Moter Distance
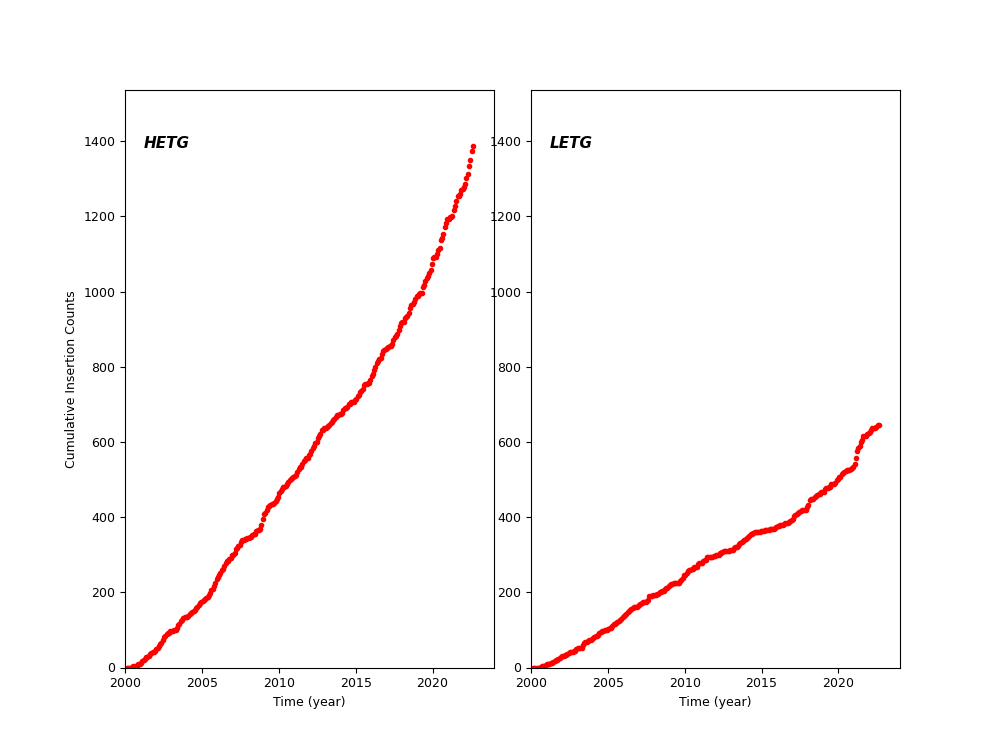
HETG and LETG Cummulative Insertion Counts
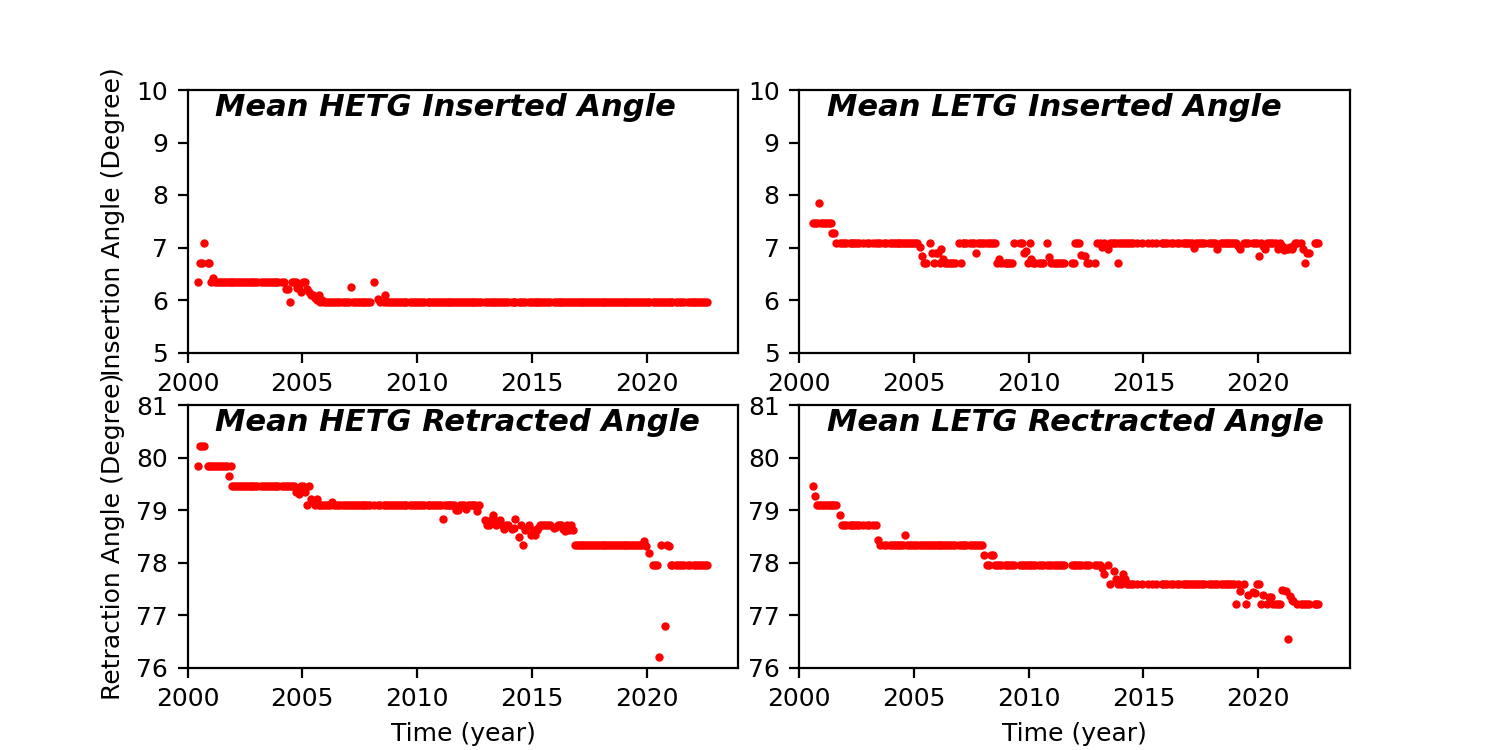
HETG/LETG Insertion/Retraction Angle
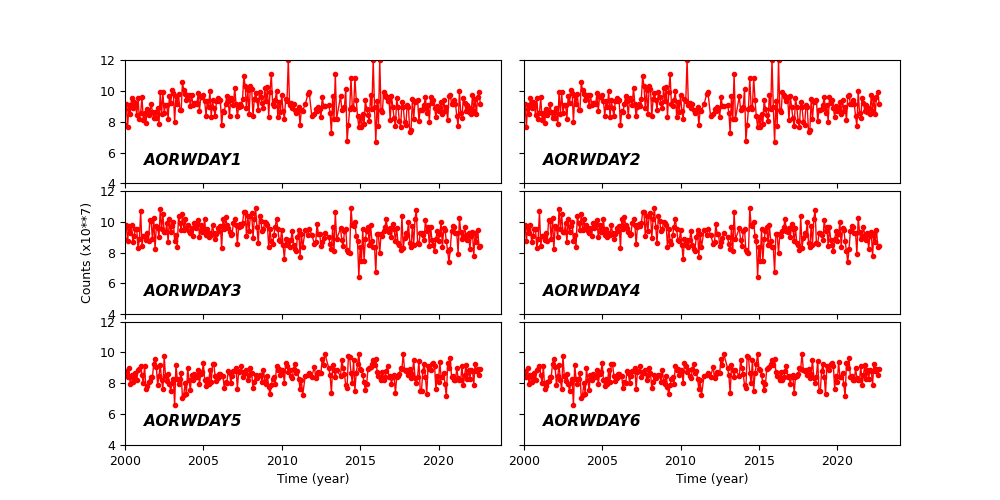
Reaction Wheel Rotations