ACIS
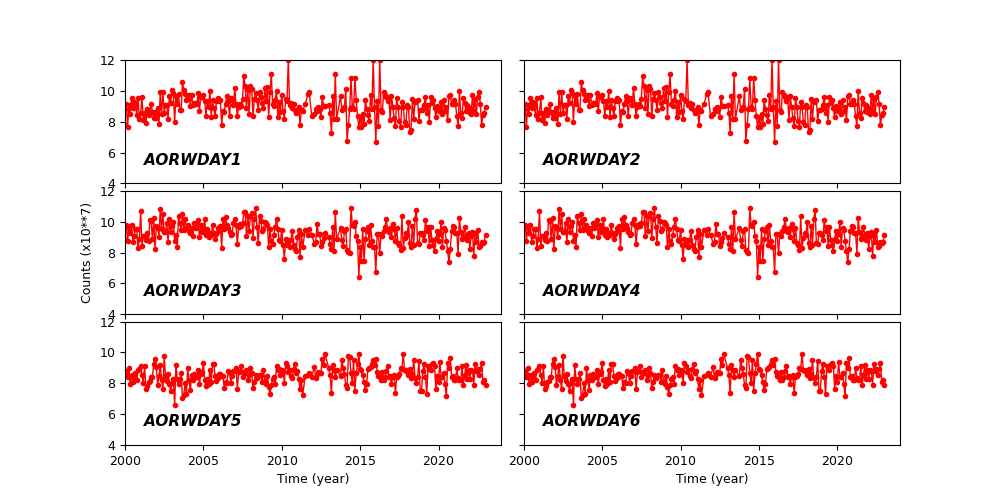
ACIS DOSE Registered-Photon-Map
The steps we took to compute the dose map are;
- Level 1 Event files for a specified month are obtained from archive.
- Image data including I2, I3, S2, S3 CCDs are extracted from all event files.
- All the extracted image data were merged to create a month long exposure map for the month.
- The exposure map is opened with ds9, and check a distribution of count rates against energy. From this, estimate the upper threshold value. Any events beyond this upper threshold are assumed erroneous events such as bad pixels.
- Using this upper threshold, the data is filtered, and create a cleaned exposure map for the month.
- The exposure map from each month from the Sep 1999 is added up to create a cumulative exposure map for each month.
- Using fimgstatistic, we compute count rate statistics for each CCDs.
- For observations with high data drop rates (e.g., Crab nebula, Cas A), we corrected the observations by adding events.
Please check more detail plots at Telemetered Photon Dose Trend page.
)
)
)
Statistics:
# IMAGE     NPIX     MEAN        RMS        MIN     MAX
ACIS_oct22 6004901       7.284         8.404           0.0     2103


I2 node 0  262654	8.046955	3.622568	0.0	 69.0
I2 node 1  262654	9.663972	5.882868	0.0	2076.0
I2 node 2  262654	9.740590	4.111169	0.0	 98.0
I2 node 3  262654	8.686652	3.810993	0.0	353.0

I3 node 0  262654	8.179915	3.631192	0.0	105.0
I3 node 1  262654	9.612314	3.961421	0.0	133.0
I3 node 2  262654	10.352460	4.412346	0.0	 75.0
I3 node 3  262654	9.075771	4.328087	0.0	1127.0

S2 node 0  262654	7.148204	4.314168	0.0	1428.0
S2 node 1  262654	8.436306	4.019968	0.0	260.0
S2 node 2  262654	10.119803	8.072787	0.0	2103.0
S2 node 3  262654	9.388743	6.027057	0.0	445.0

S3 node 0  262654	11.071764	6.618271	0.0	101.0
S3 node 1  262654	12.345911	6.077827	0.0	1445.0
S3 node 2  262654	13.591180	6.109185	0.0	 78.0
S3 node 3  262654	11.606843	6.581761	0.0	 88.0
)
)
)
Statistics:
 IMAGE     NPIX      MEAN        RMS           MIN      MAX
ACIS_total   6004901       2600.151         3326.335           0.0   142719


I2 node 0  262654	2260.195649	455.736645	483.0	13897.0
I2 node 1  262654	2379.405391	652.114902	499.0	138606.0
I2 node 2  262654	2408.178736	509.653840	520.0	14611.0
I2 node 3  262654	2413.212903	622.785736	485.0	28899.0

I3 node 0  262654	2592.406094	636.778511	485.0	14015.0
I3 node 1  262654	2673.648847	1741.309894	512.0	55883.0
I3 node 2  262654	2387.490887	448.095117	483.0	14247.0
I3 node 3  262654	2371.373353	480.154402	451.0	35064.0

S2 node 0  262654	3026.320171	491.279213	1643.0	22409.0
S2 node 1  262654	3208.763305	729.452824	1827.0	17332.0
S2 node 2  262654	3550.315759	731.430362	2242.0	30604.0
S2 node 3  262654	3512.046707	586.887867	1976.0	74008.0

S3 node 0  262654	5380.022886	2942.379751	2361.0	54356.0
S3 node 1  262654	6585.250323	2366.320629	0.0	48928.0
S3 node 2  262654	5316.517084	1343.260460	2445.0	27300.0
S3 node 3  262654	4166.734395	760.471026	2515.0	26499.0
)
|
)
|
)
|
)
|
| Jul 2022 | Apr 2022 | Jan 2022 | Oct 2021 |
|---|
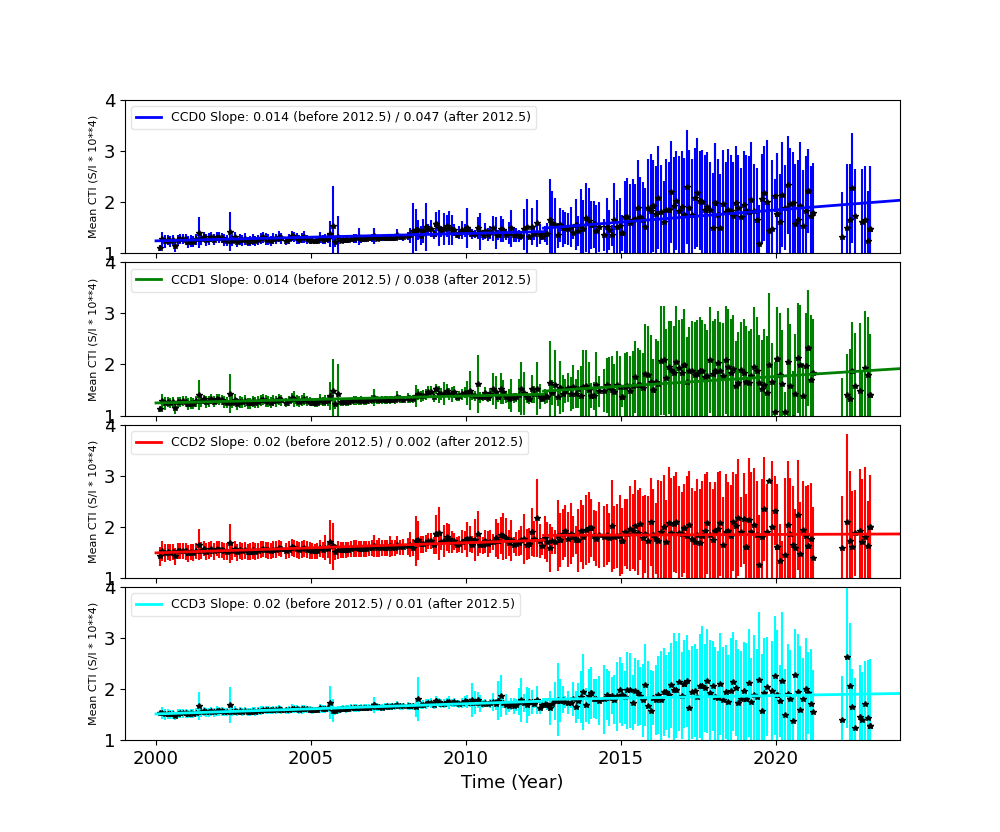
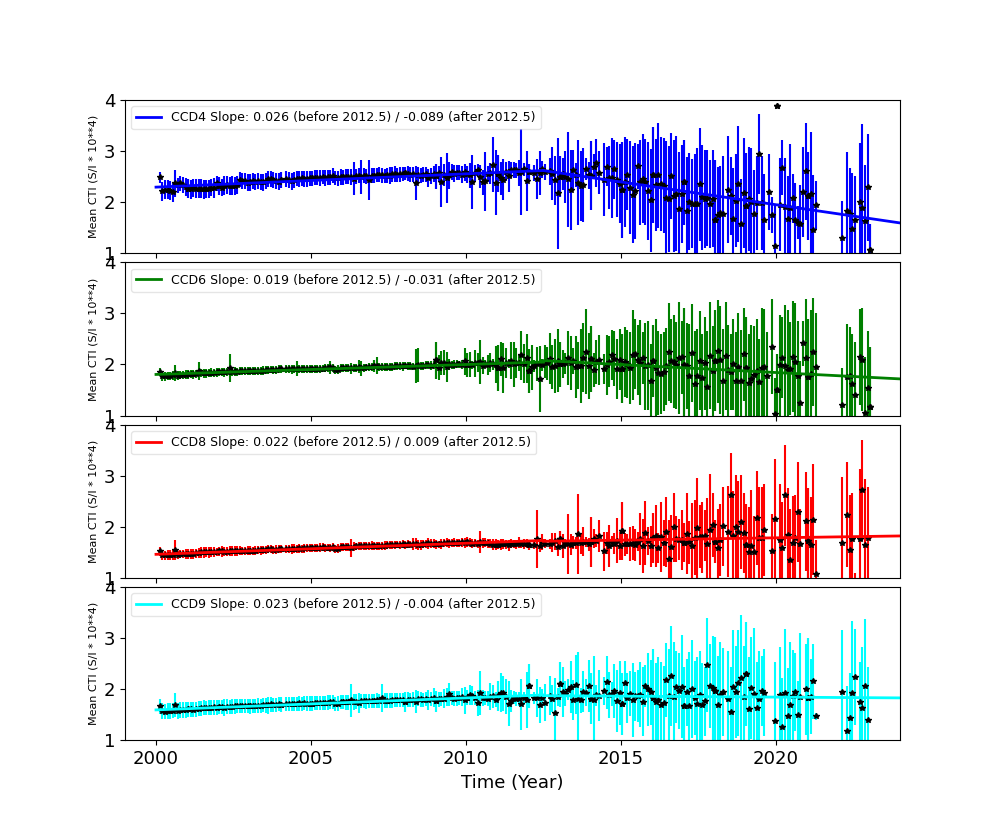
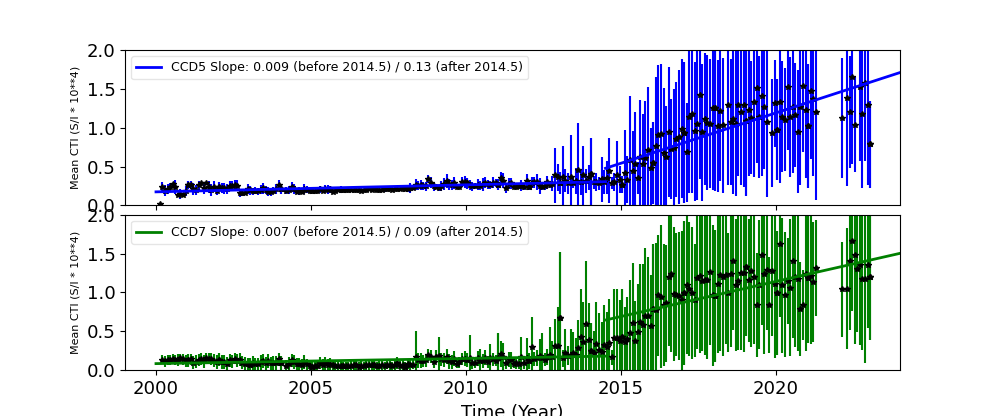
The Mean Detrended CTI
We report CTIs with a refined data definition. CTIs were computed for the temperature dependency corrected data. Please see CTI page for detailed explanation. CTI's are computed for Mn K alpha, and defined as slope/intercept x10^4 of row # vs ADU. Data file: here
Imaging CCDs
Spectral CCDs
Backside CCDs
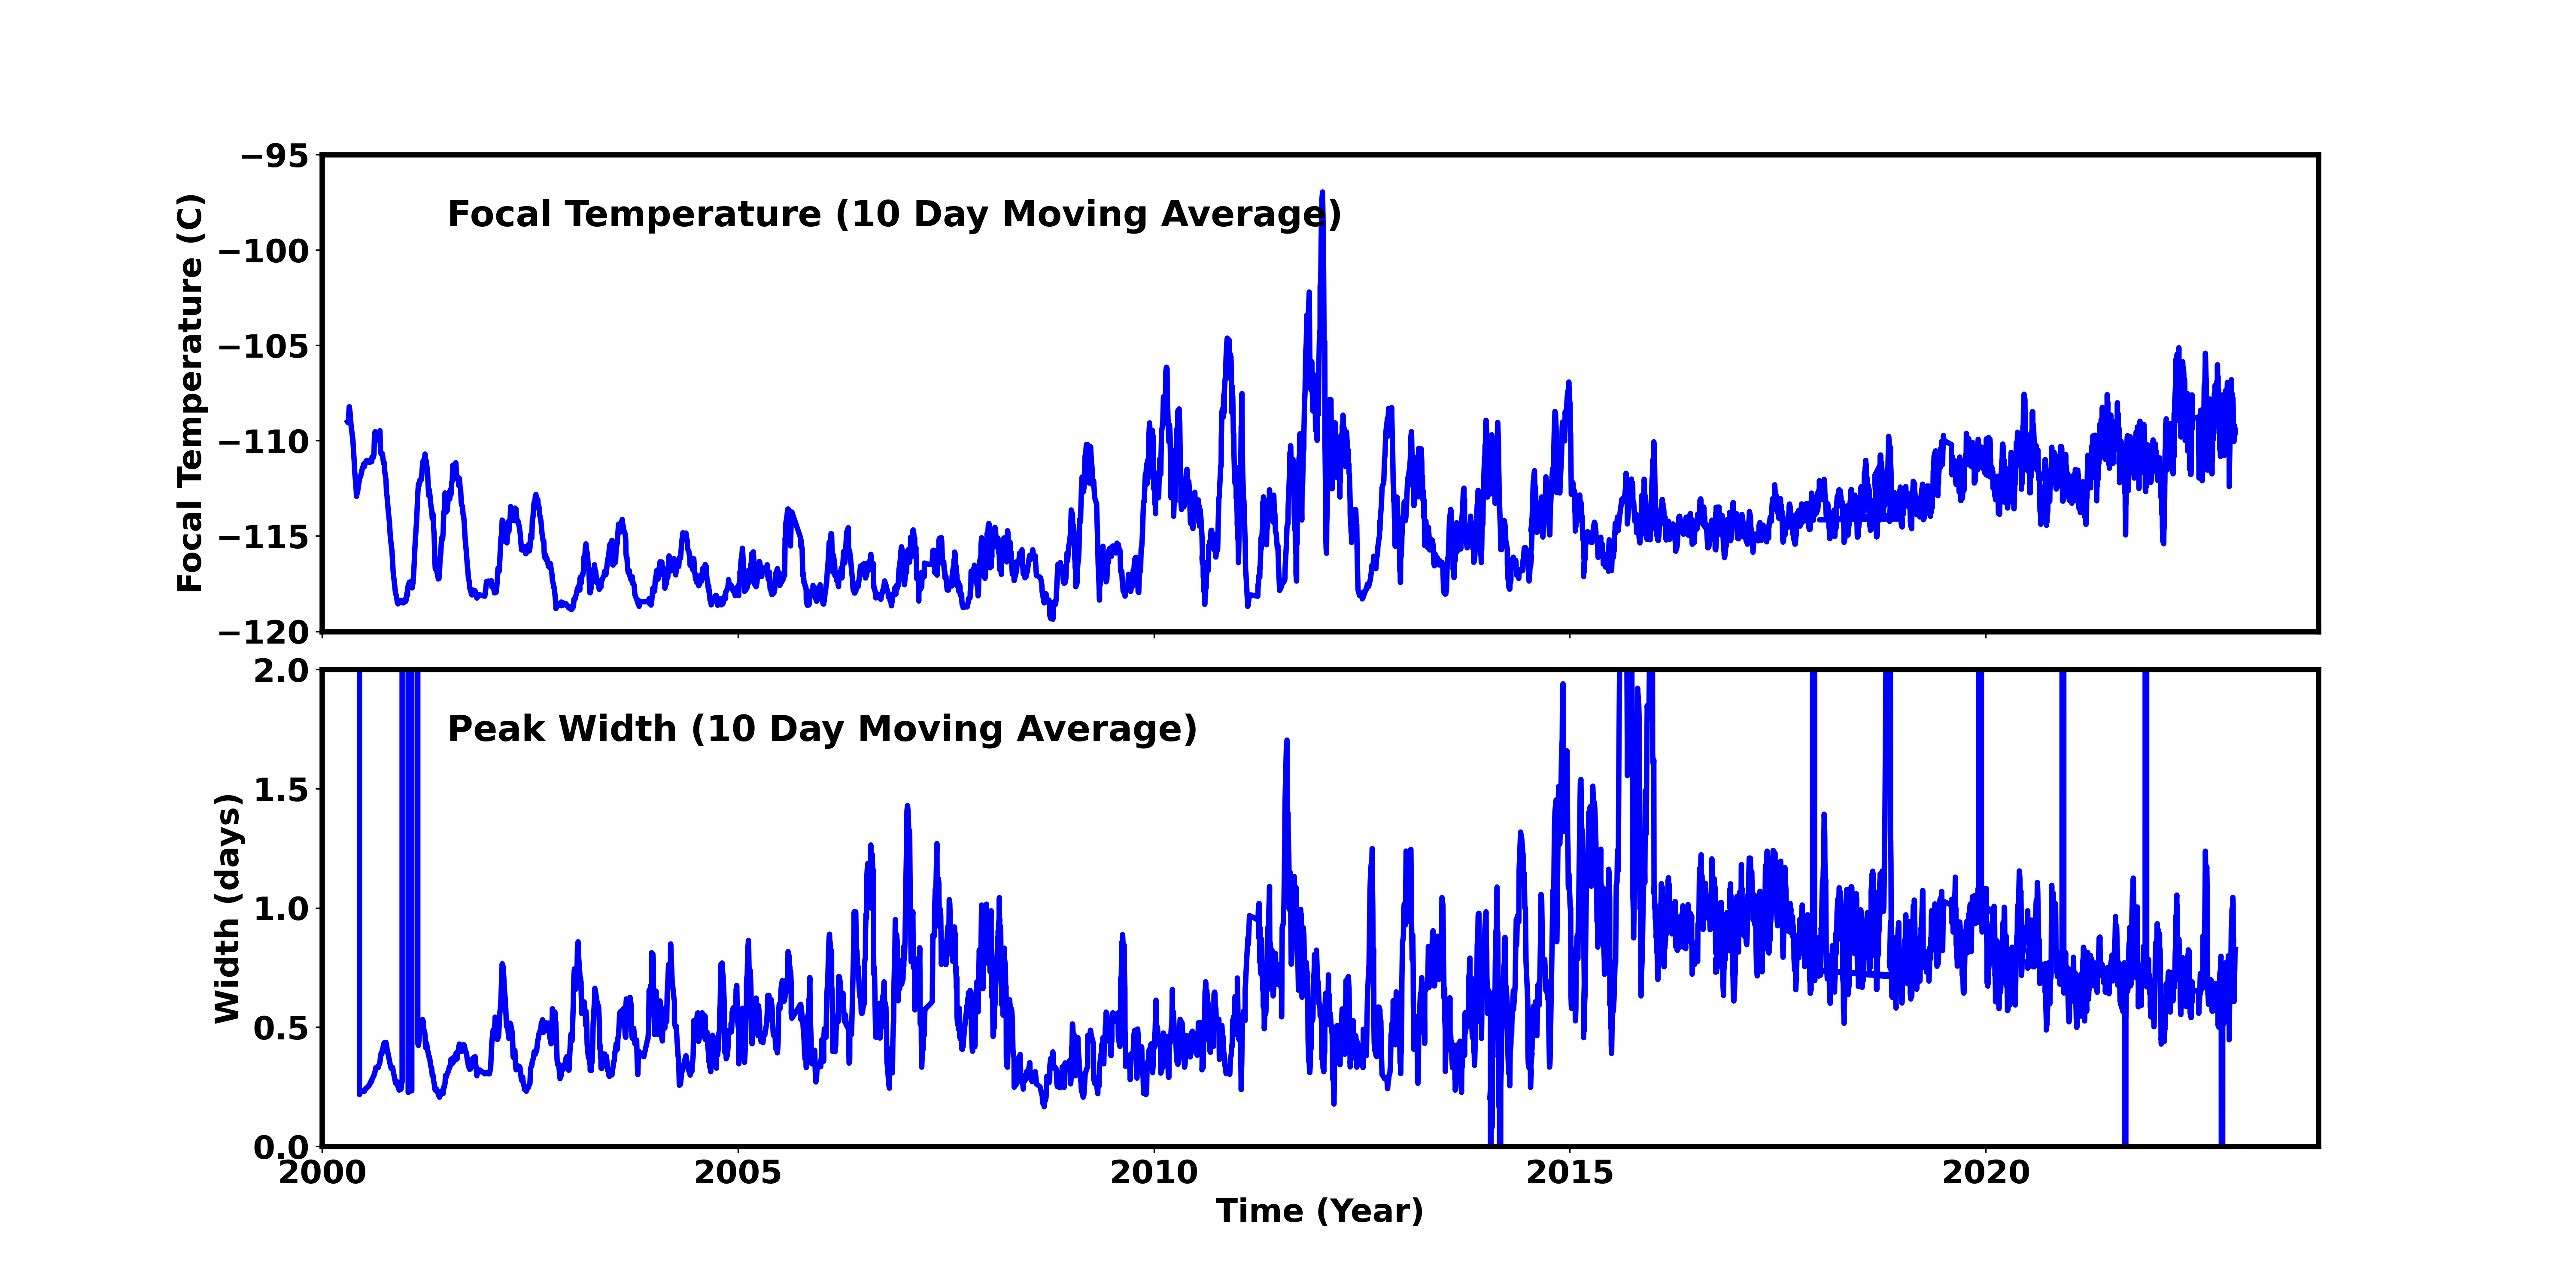
Focal Plane Temperature
Oct 2022 Focal Temperature
| The Mean (max) FPT: | |
|---|---|
| -109.35 | +/- 3.84 C |
| Mean Width: | |
| 0.78 | +/- 0.48 days |
Averaged Focal Plane Temperature
We are using 10 period moving averages to show trends of peak temperatures and peak widths. Note, the gaps in the width plot are due to missing/corrupted data.
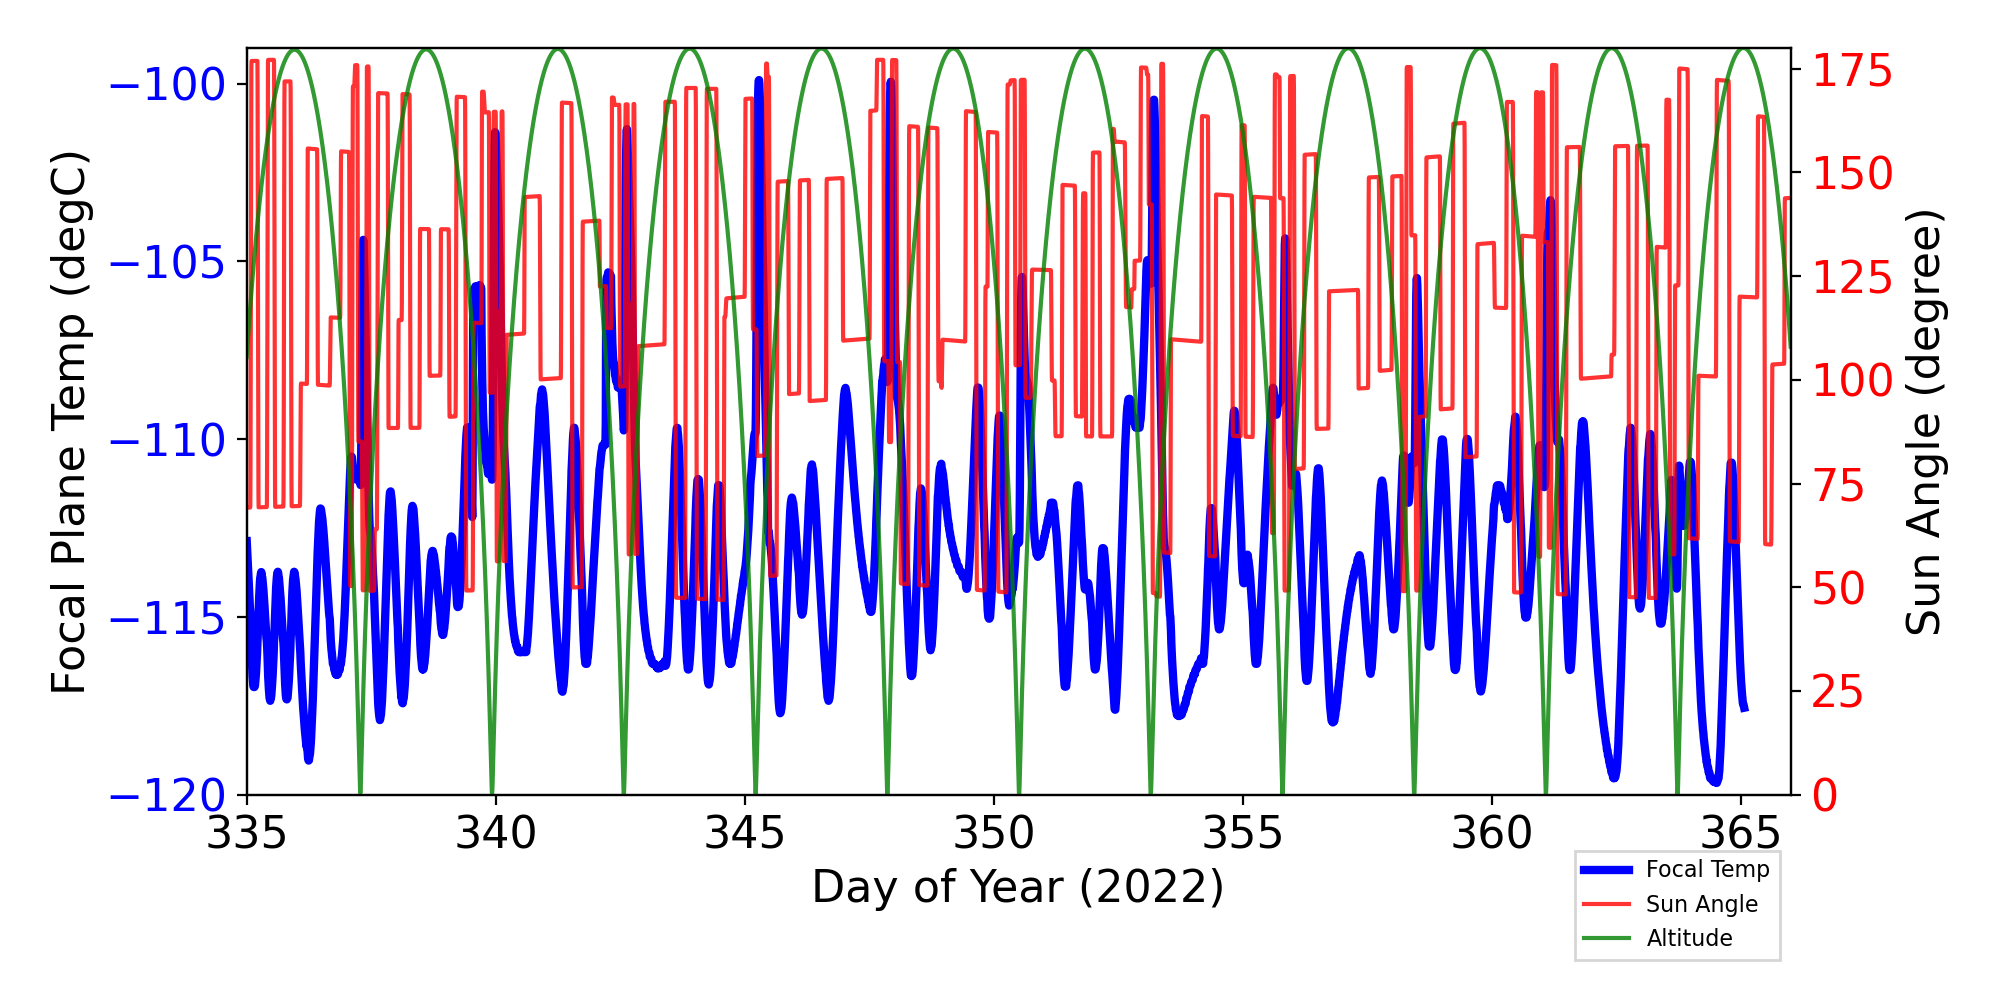
Focal Plane Temperature, Sun Angle and Altitude
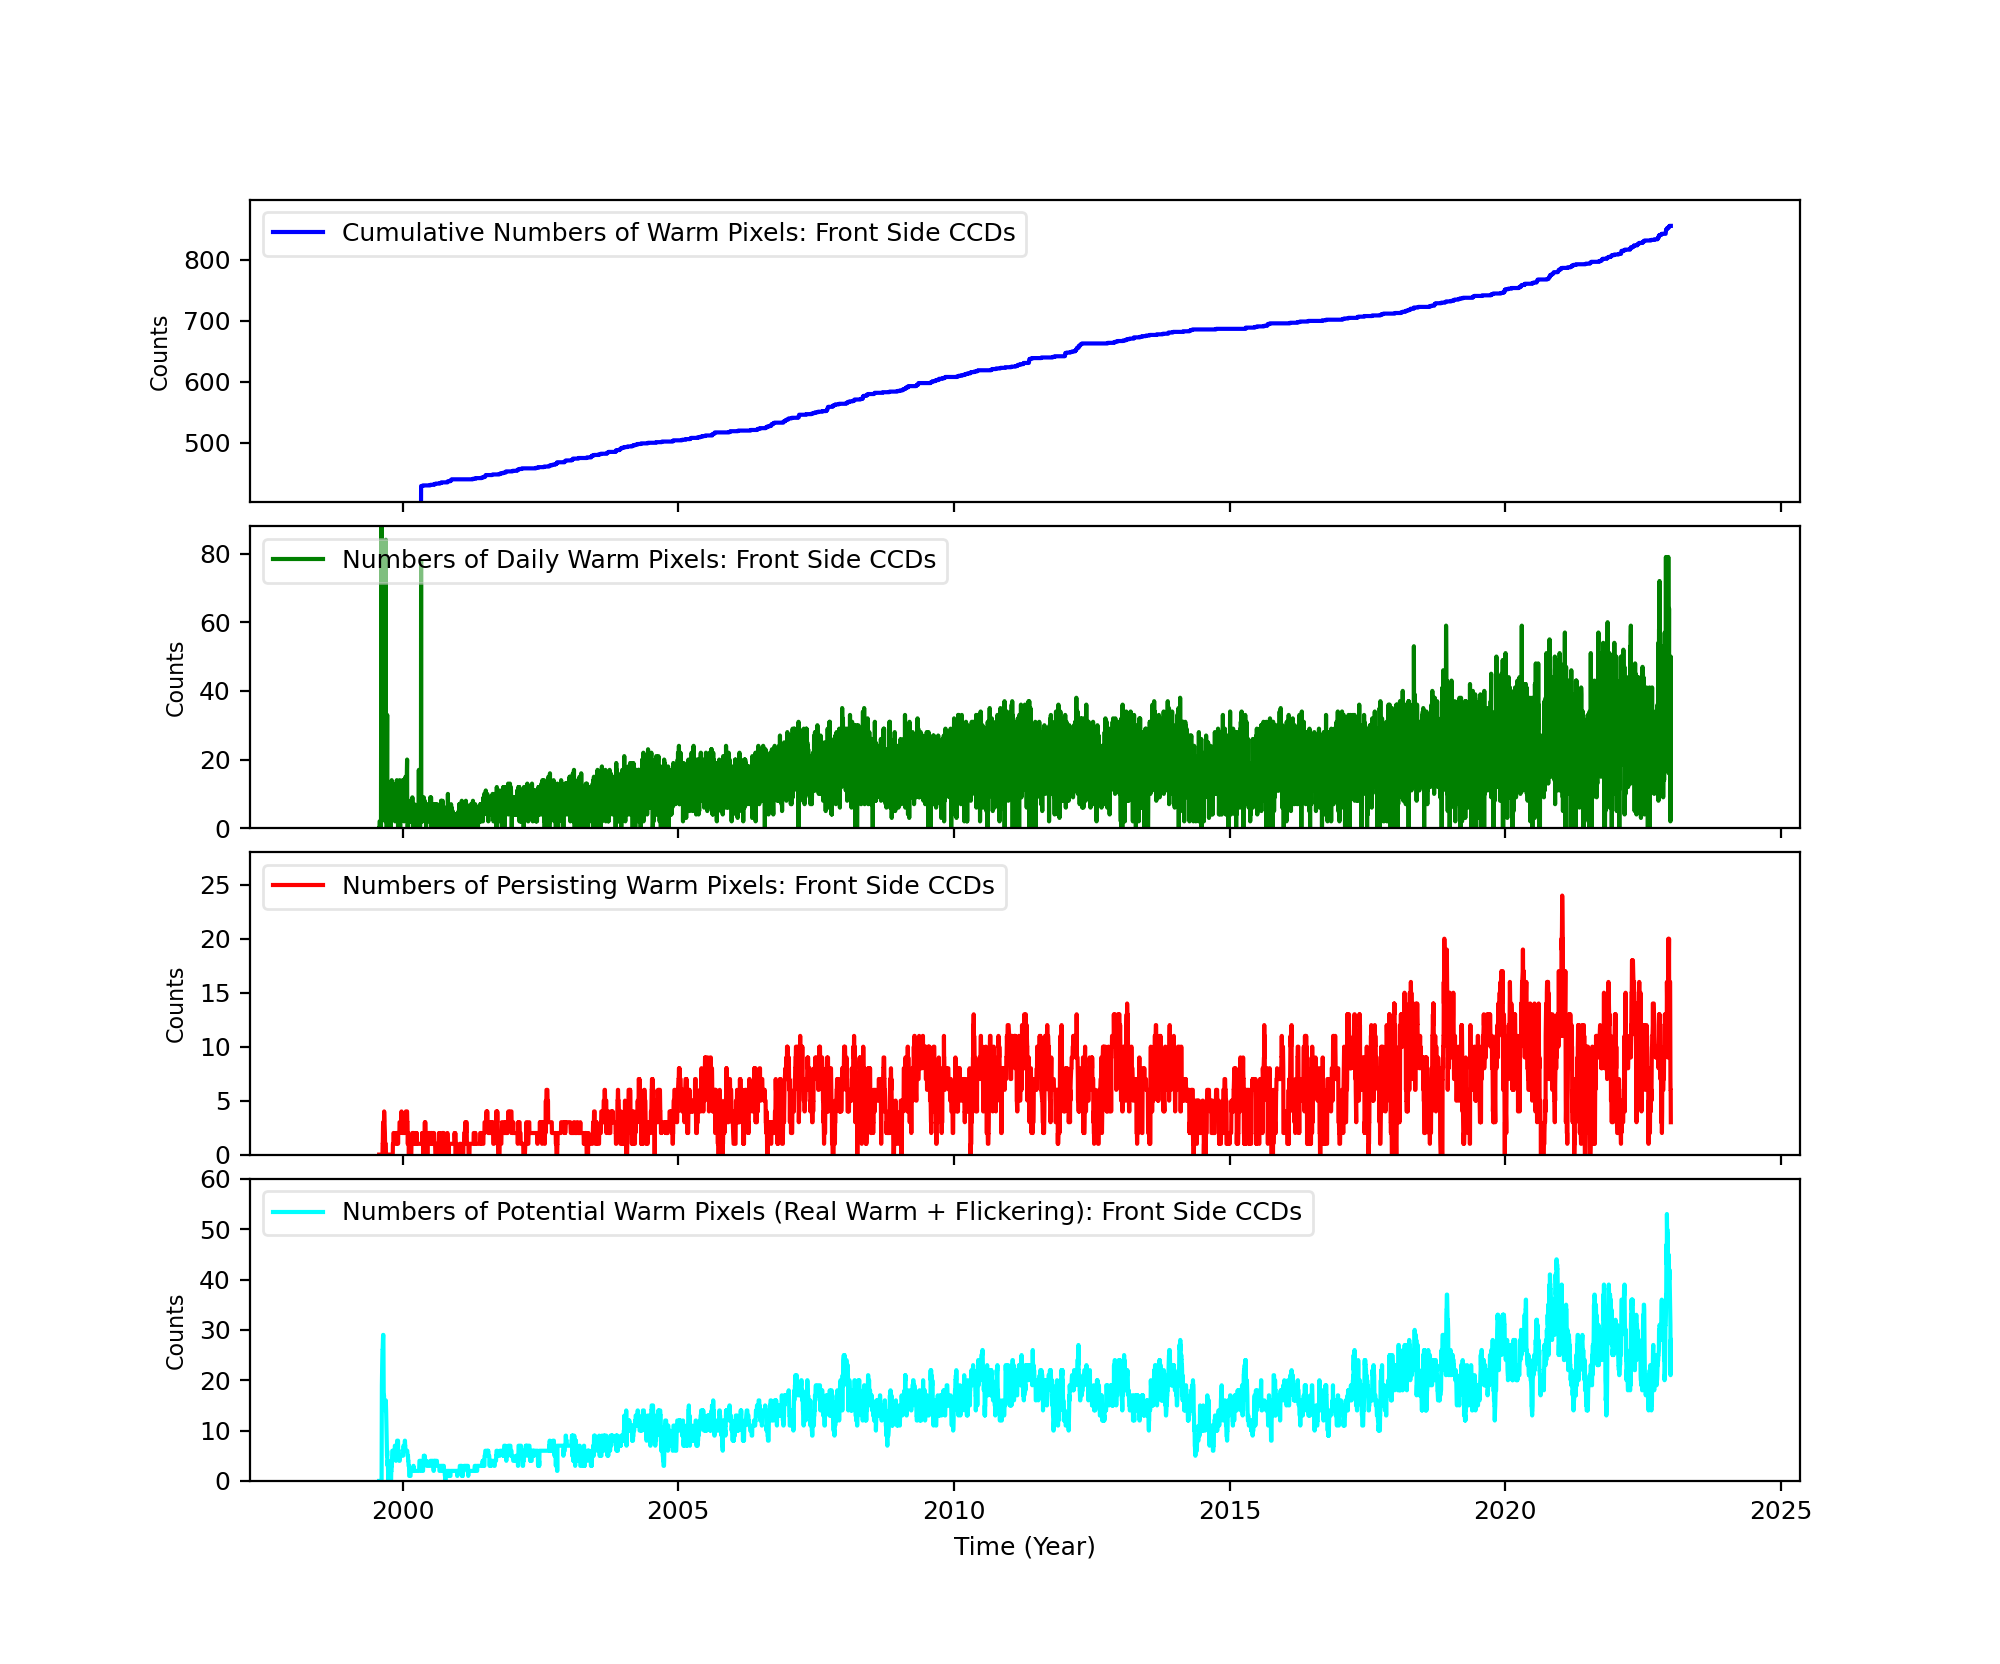
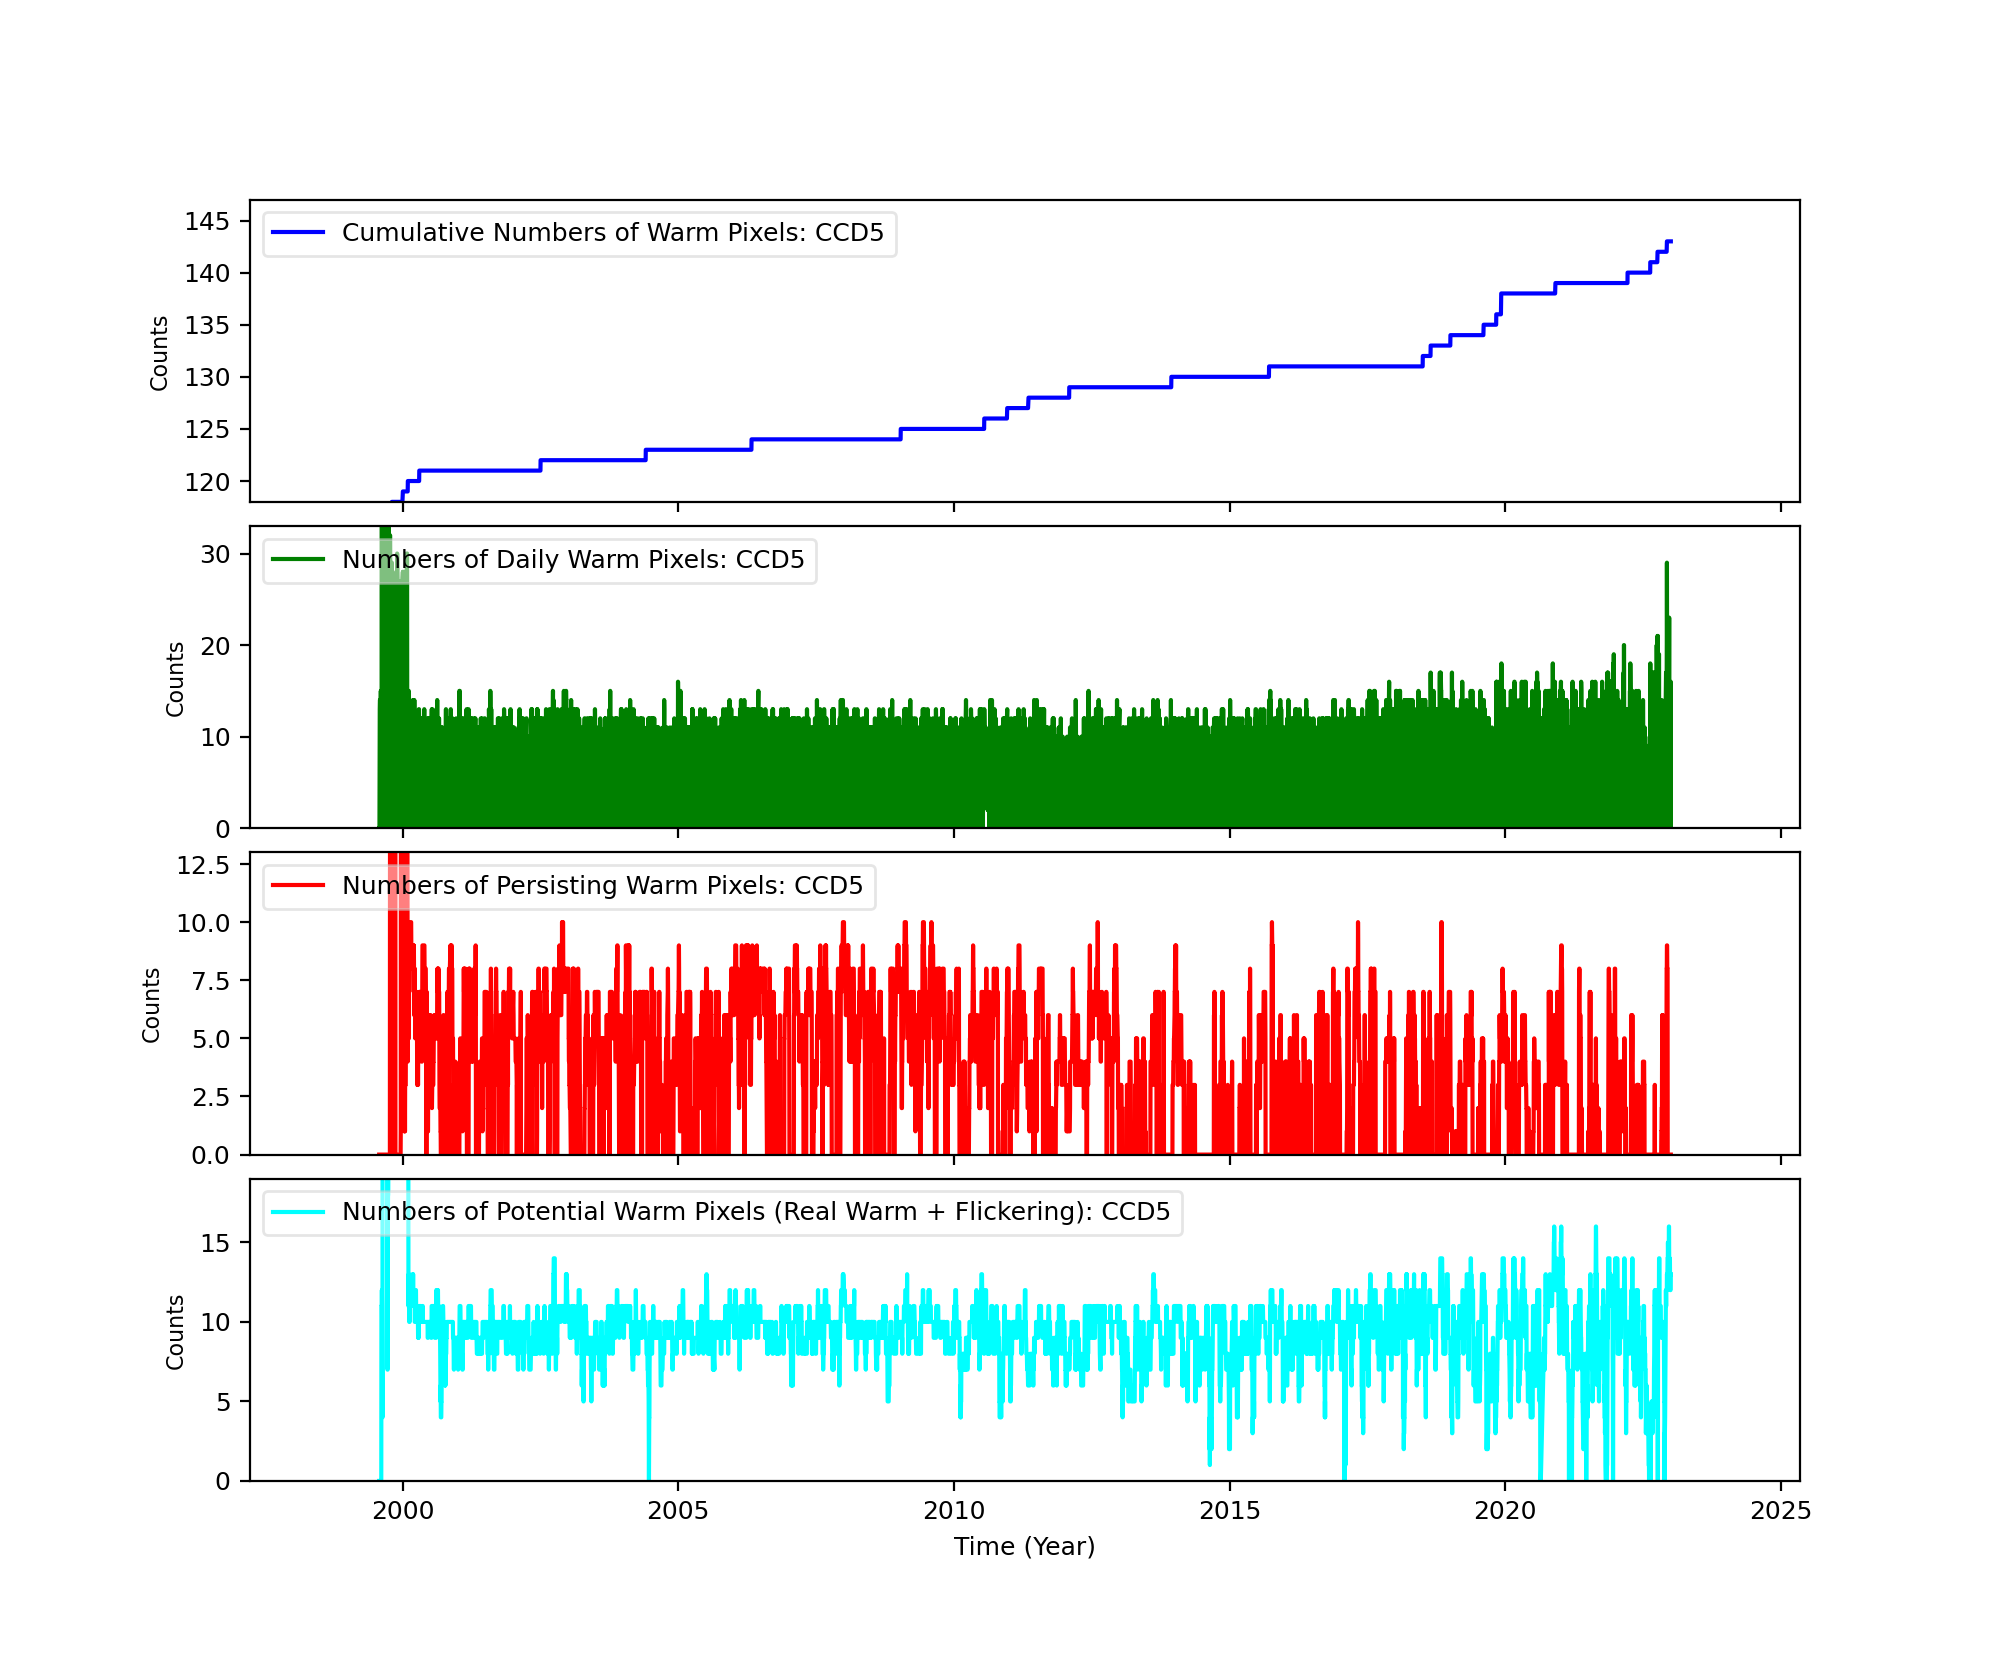
Bad Pixels
The plots below were generated with a new warm pixel finding script. Please see Acis Bad Pixel Page for details.
Front Side CCDs
Back Side CCD (CCD5)
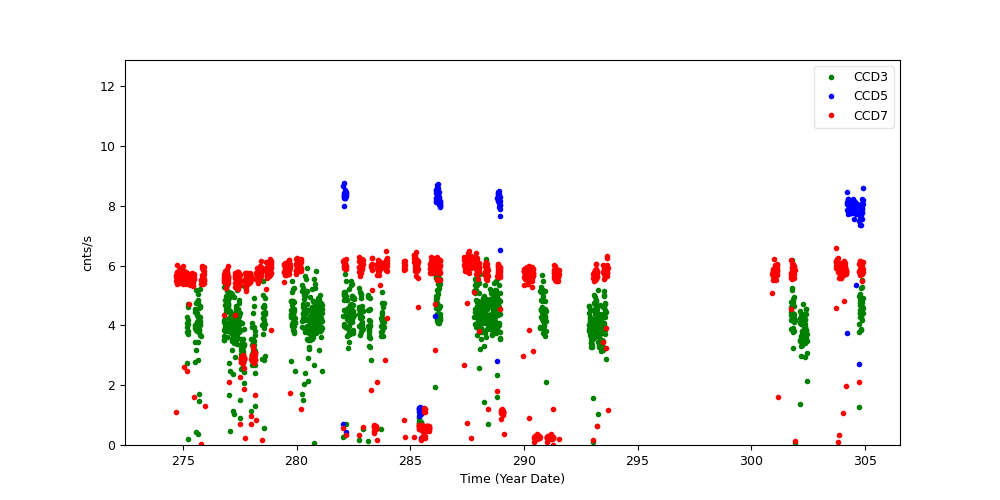
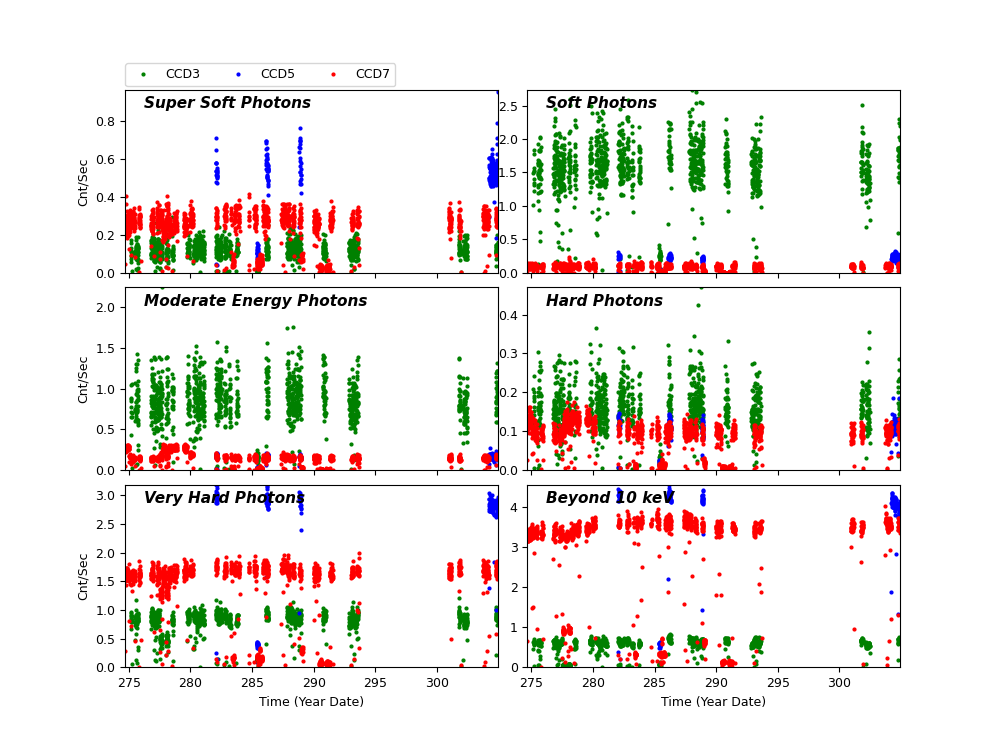
Science Instrument Background Rates
| Name | Low (keV) | High(KeV) | Description |
|---|---|---|---|
| SSoft | 0.00 | 0.50 | Super soft photons |
| Soft | 0.50 | 1.00 | Soft photons |
| Med | 1.00 | 3.00 | Moderate energy photons |
| Hard | 3.00 | 5.00 | Hard Photons |
| Harder | 5.00 | 10.00 | Very Hard photons |
| Hardest | 10.00 | Beyond 10 keV |
HRC
DOSE of Central 4K Pore-Pairs
Please refer to Maximum Dose Trends for more details.
No Data
)
IMAGE                       NPIX      MEAN    STDDEV      MIN       MAX
HRCI_08_1999_10_2022.fits  16777216	na	na	na	na
No Data
)
IMAGE                       NPIX      MEAN    STDDEV      MIN       MAX
HRCS_08_1999_10_2022.fits  16777216	na	na	na	na
|
|
Max dose trend plots corrected for events that "pile-up"
in the center of the taps due to bad position information.
|
)
|
)
|
)
|
)
|
| Jul 2022 | Apr 2022 | Jan 2022 | Oct 2021 |
|---|
)
|
)
|
)
|
)
|
| Jul 2022 | Apr 2022 | Jan 2022 | Oct 2021 |
|---|
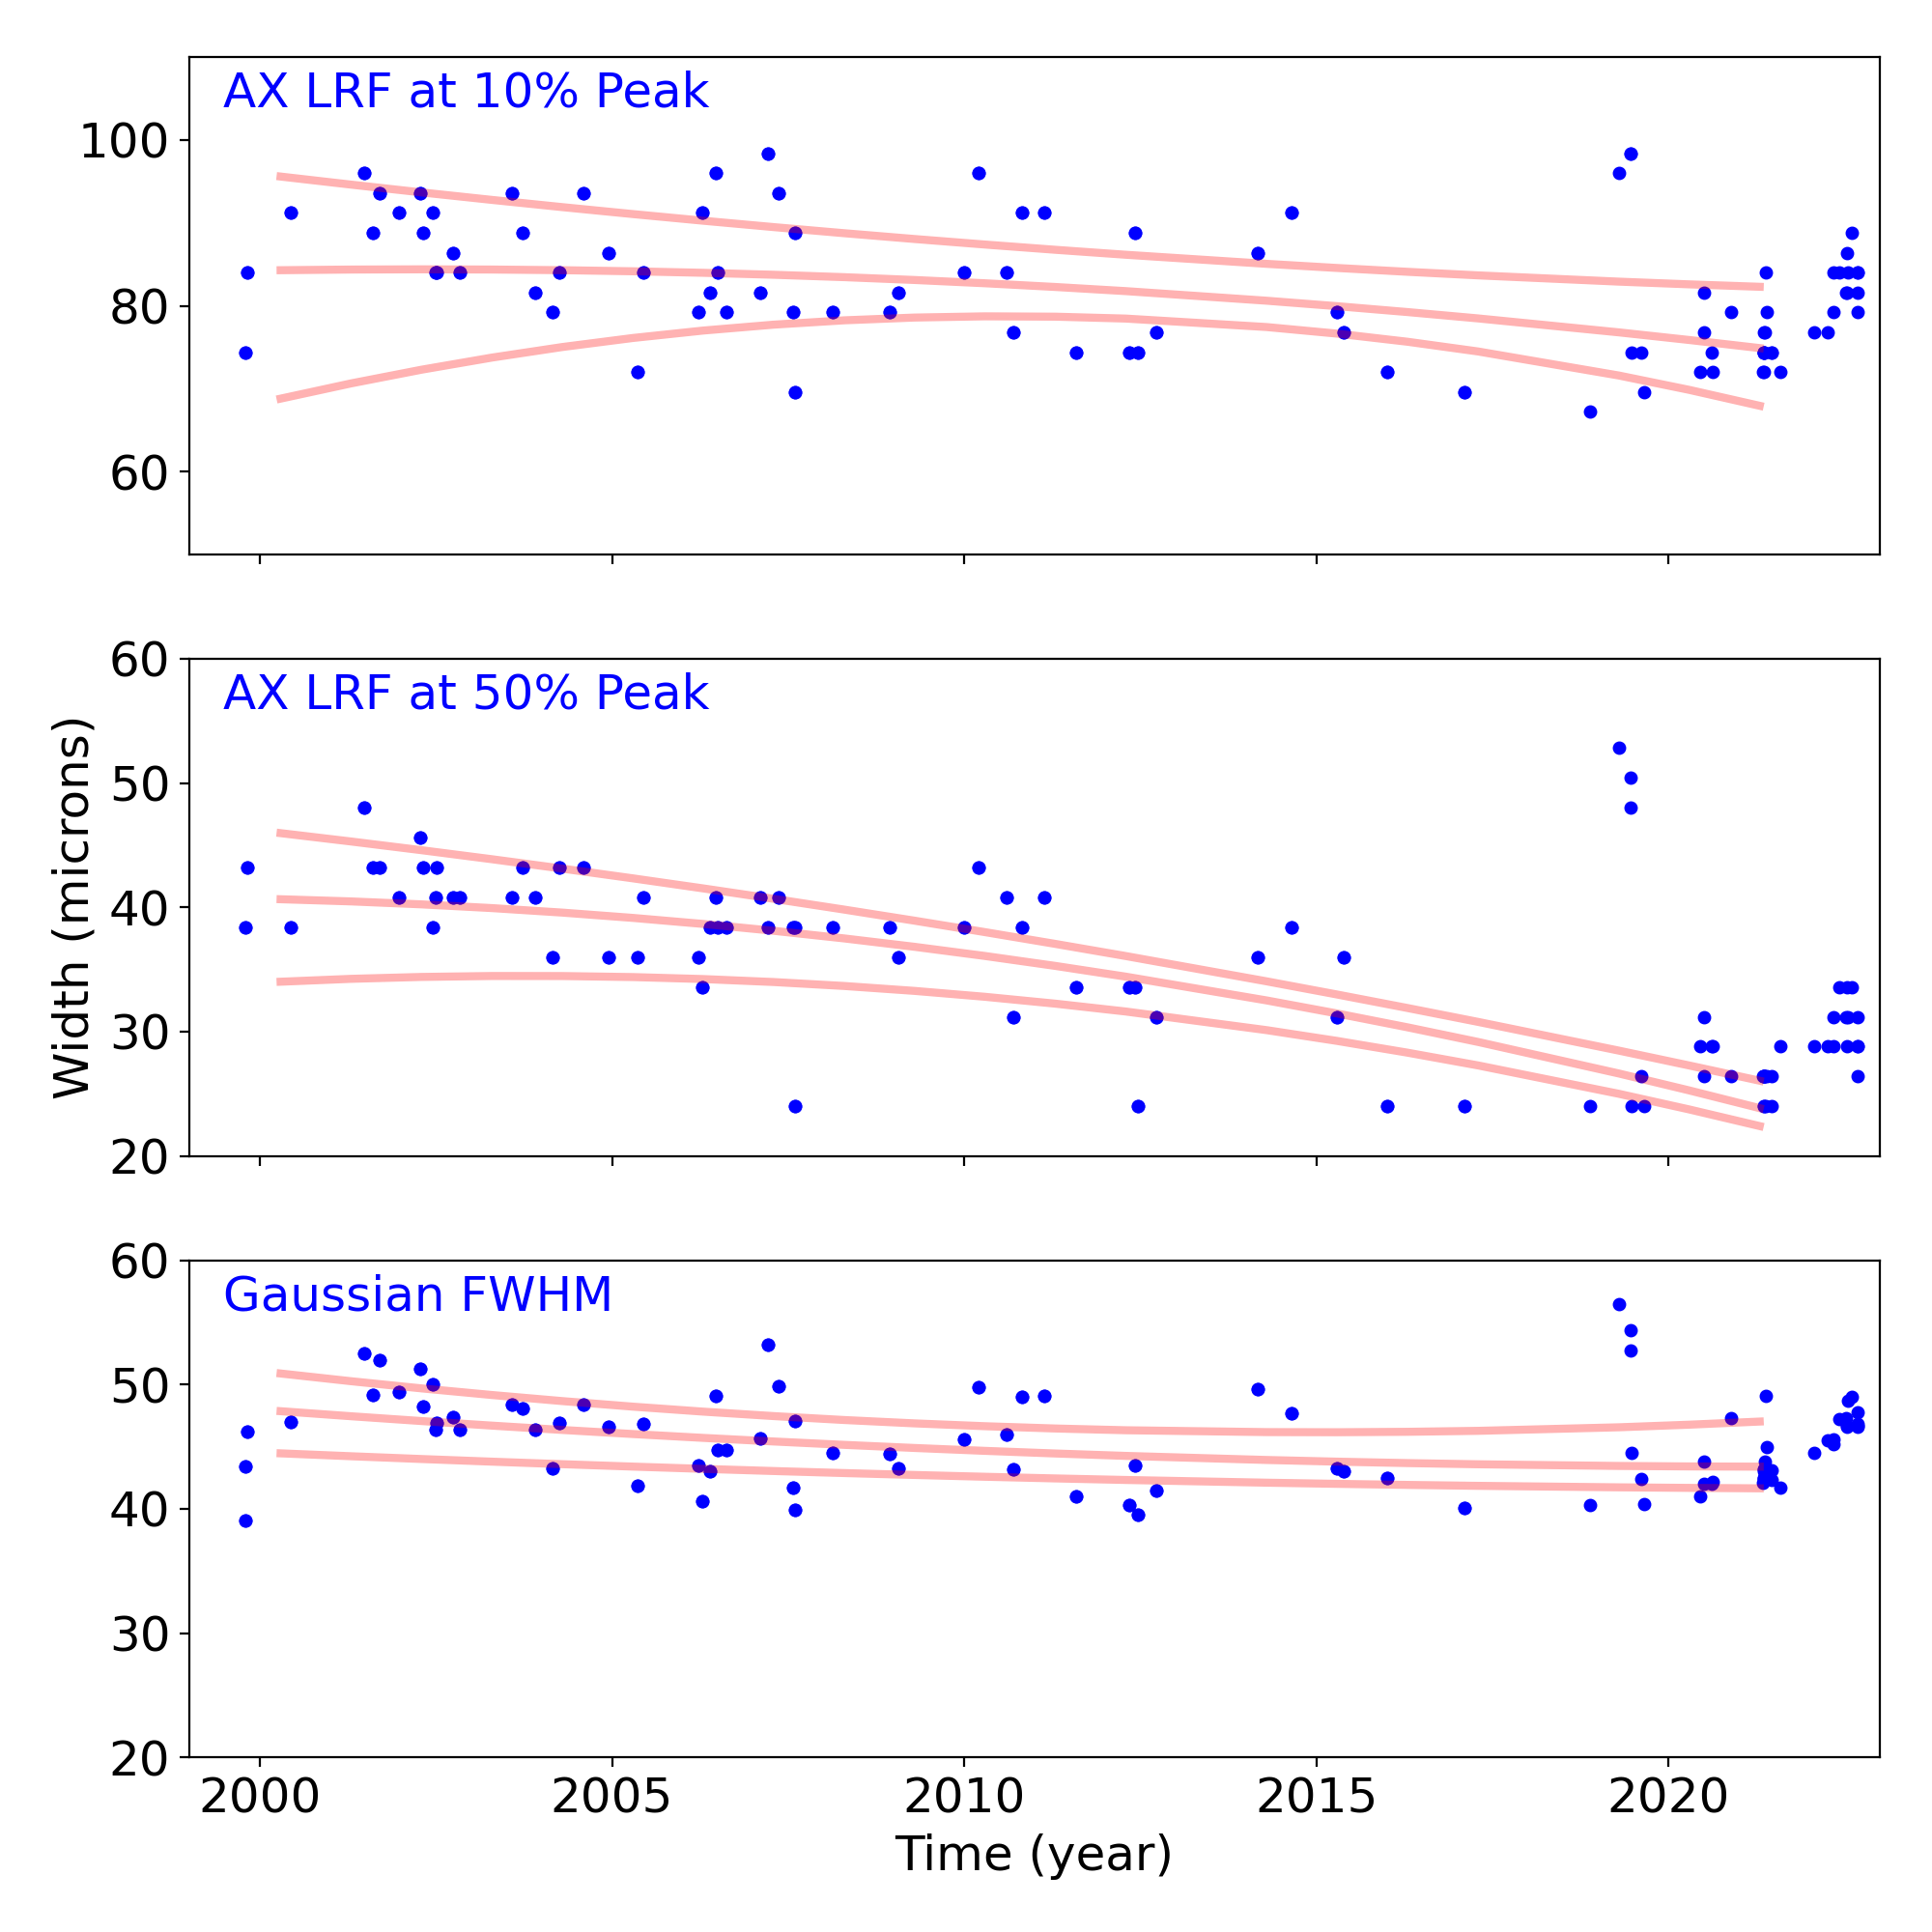
Gratings
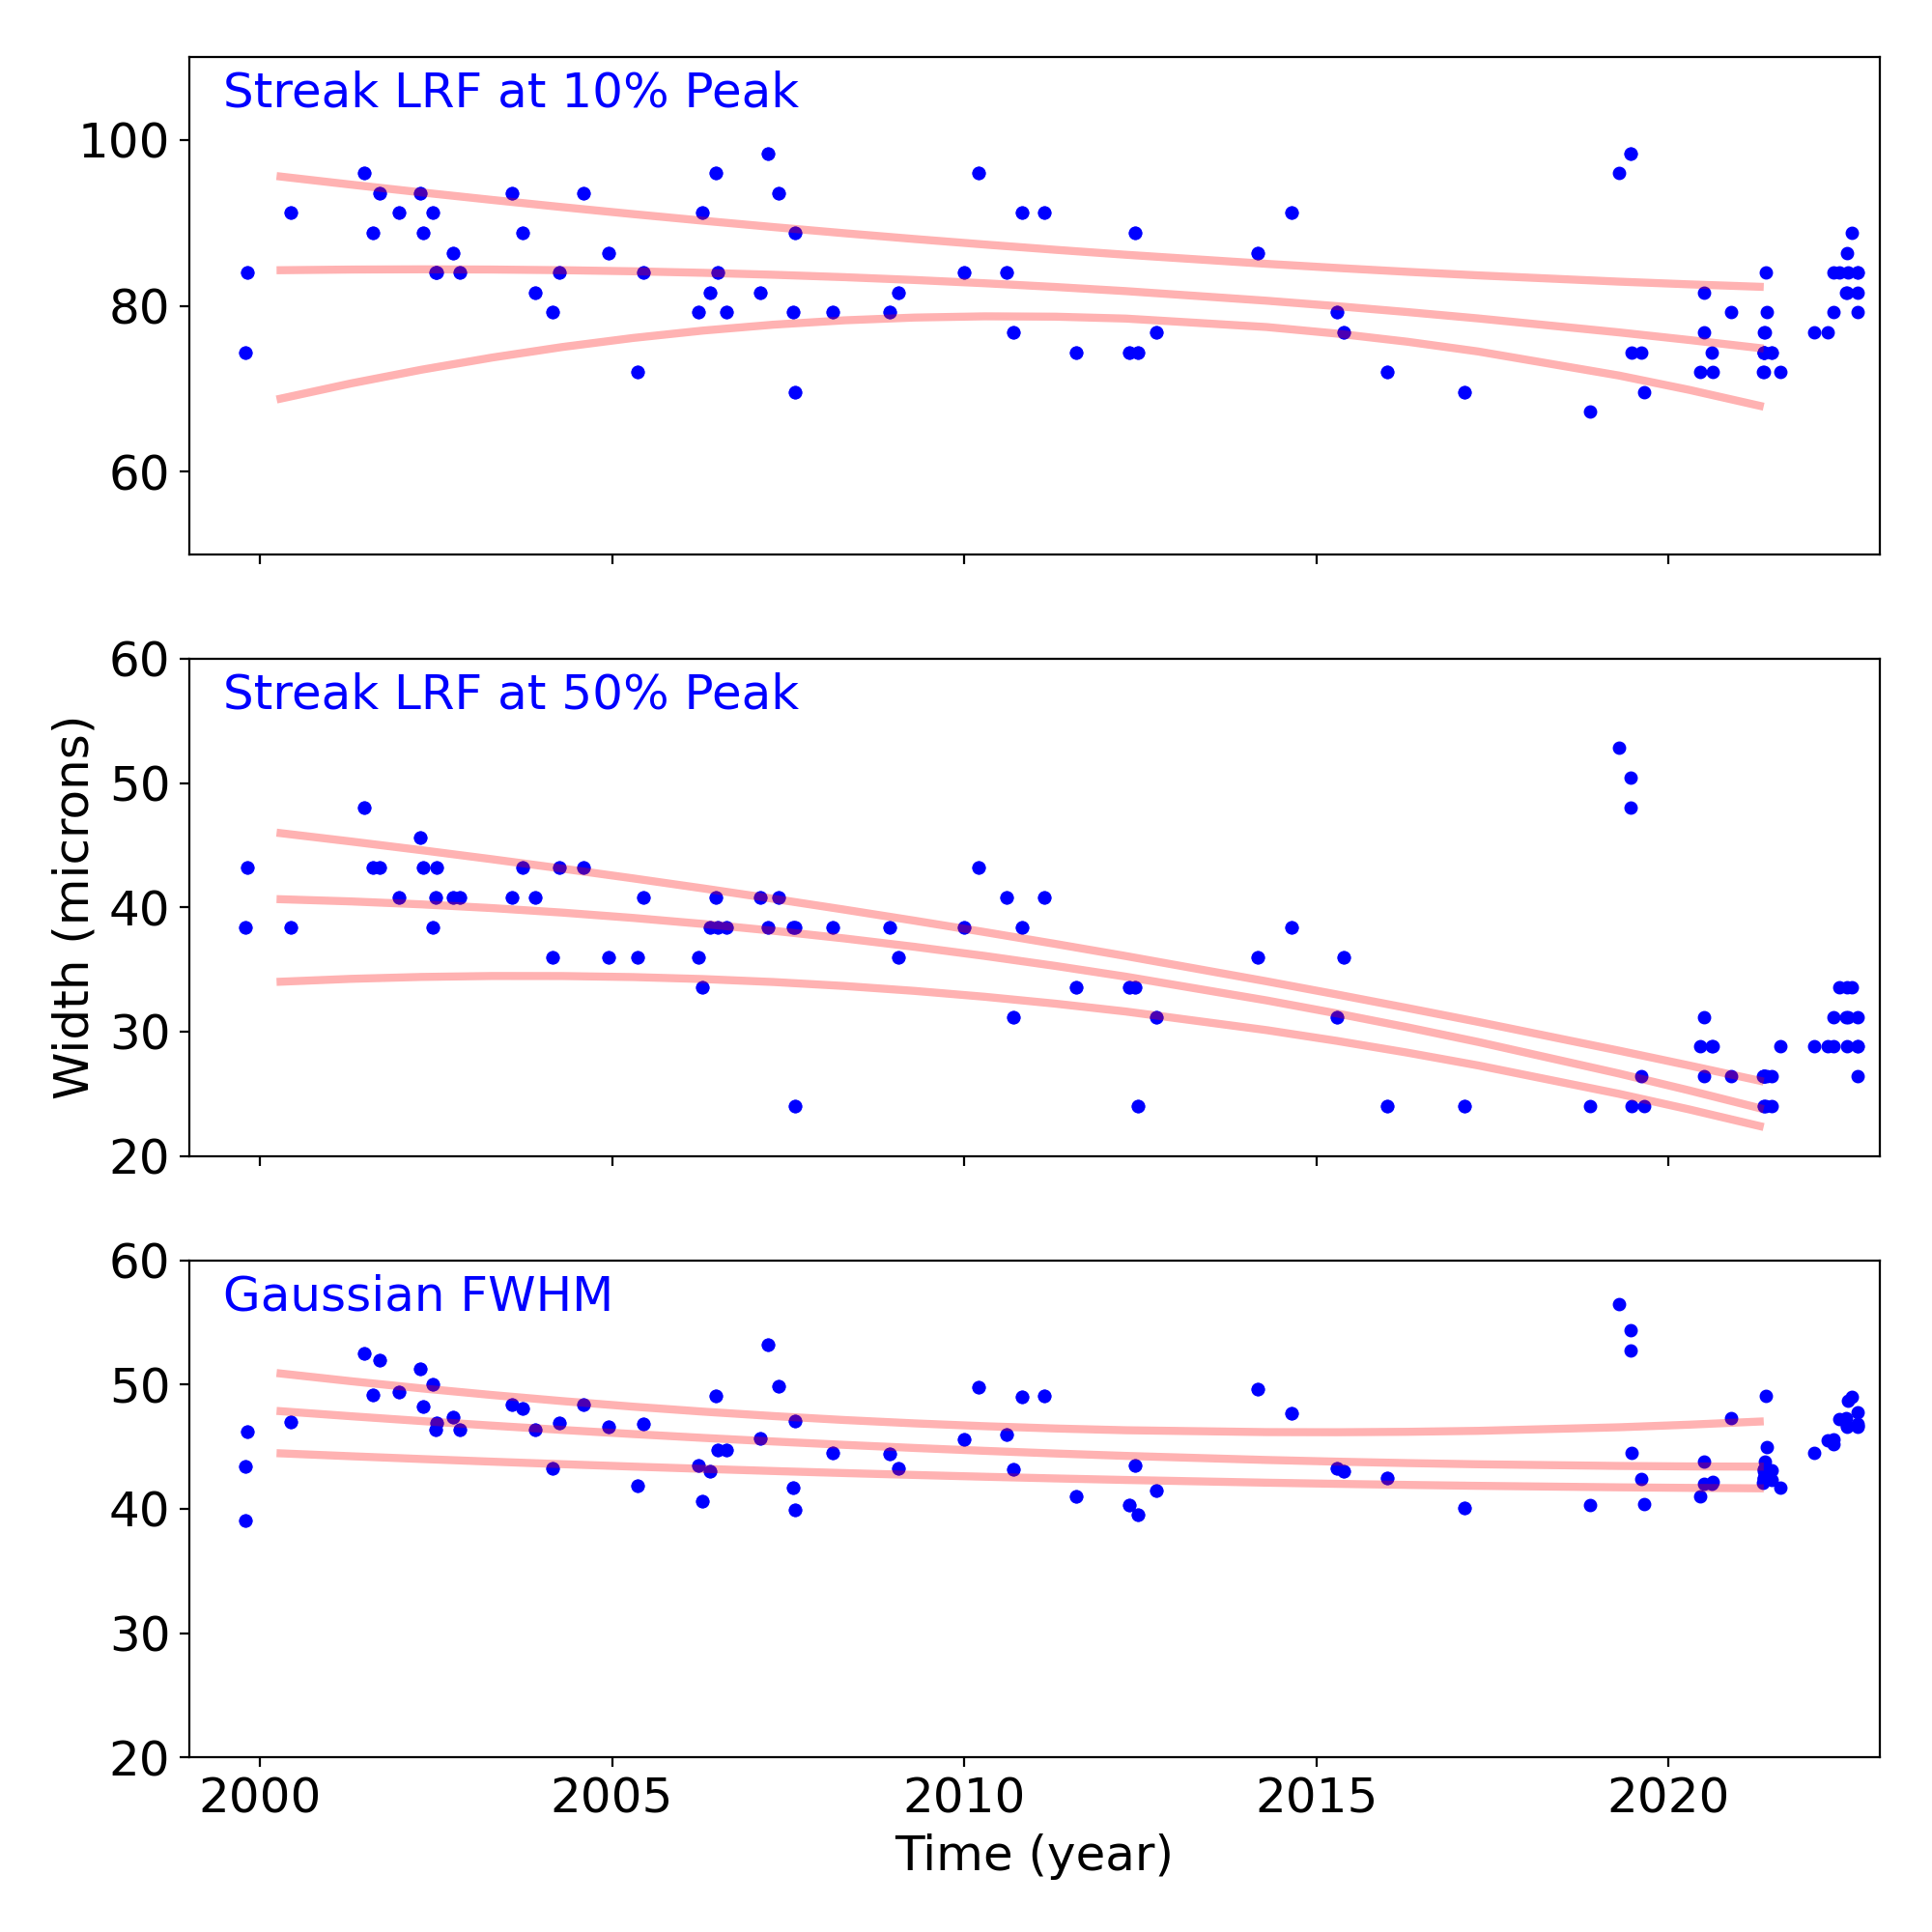
Grating Trends/Focus
We plot the width of the zero order streak of ACIS/HETG observations and the width of the zero order image for HRC/LETG observations of point sources. No significant defocusing trend is seen at this time. See Gratings Trends pages.
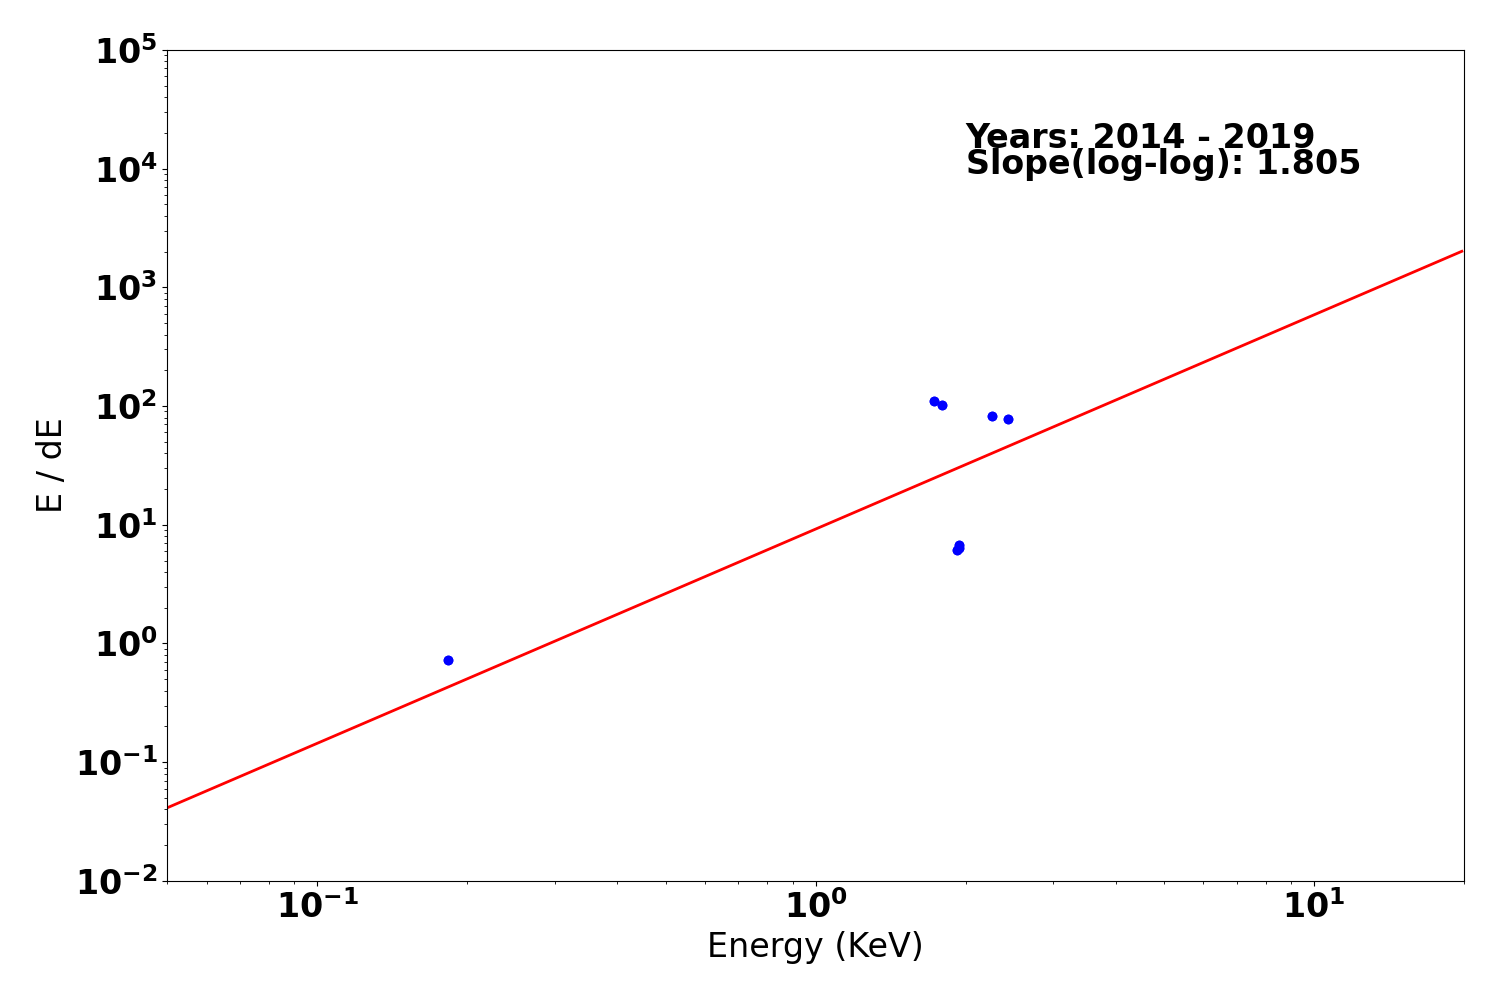
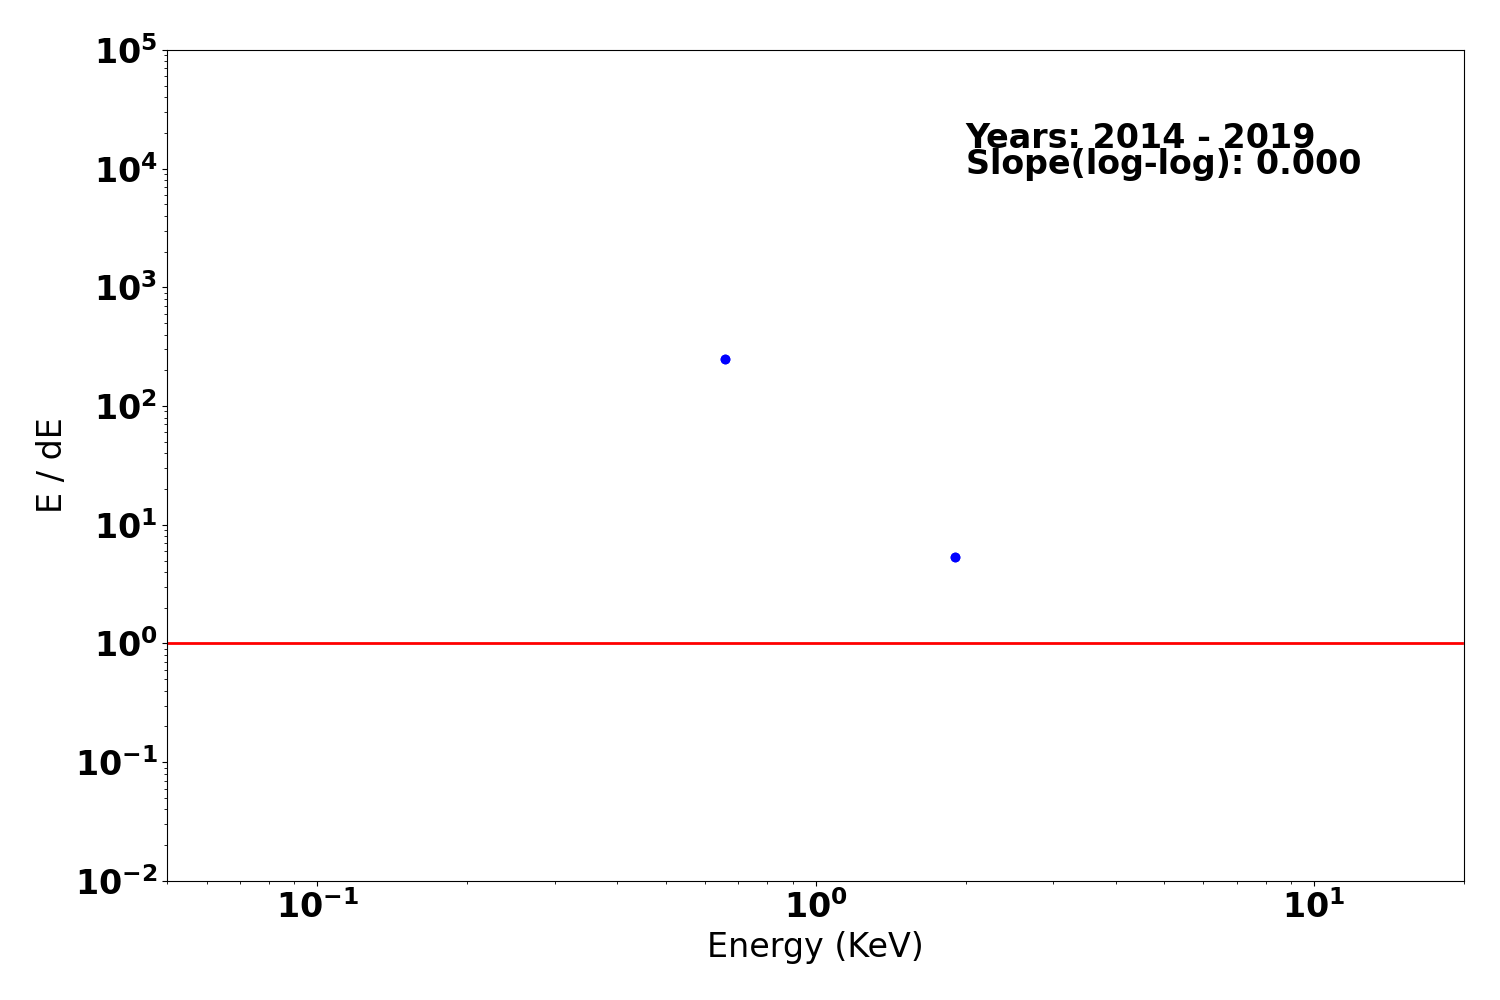
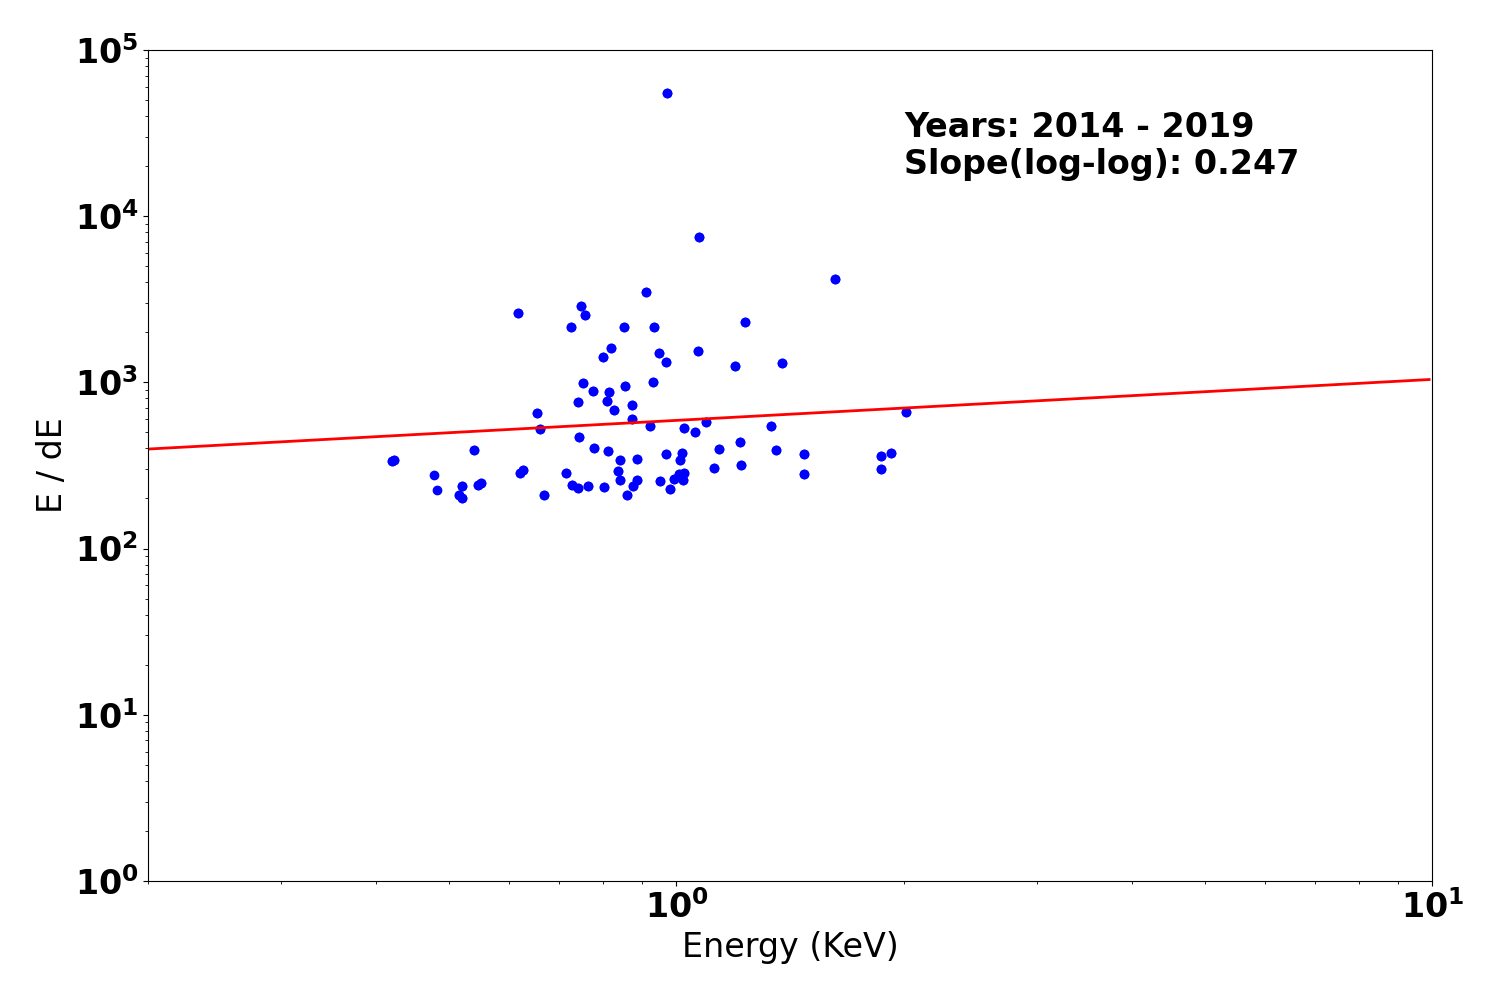
Gratings Resolving Power
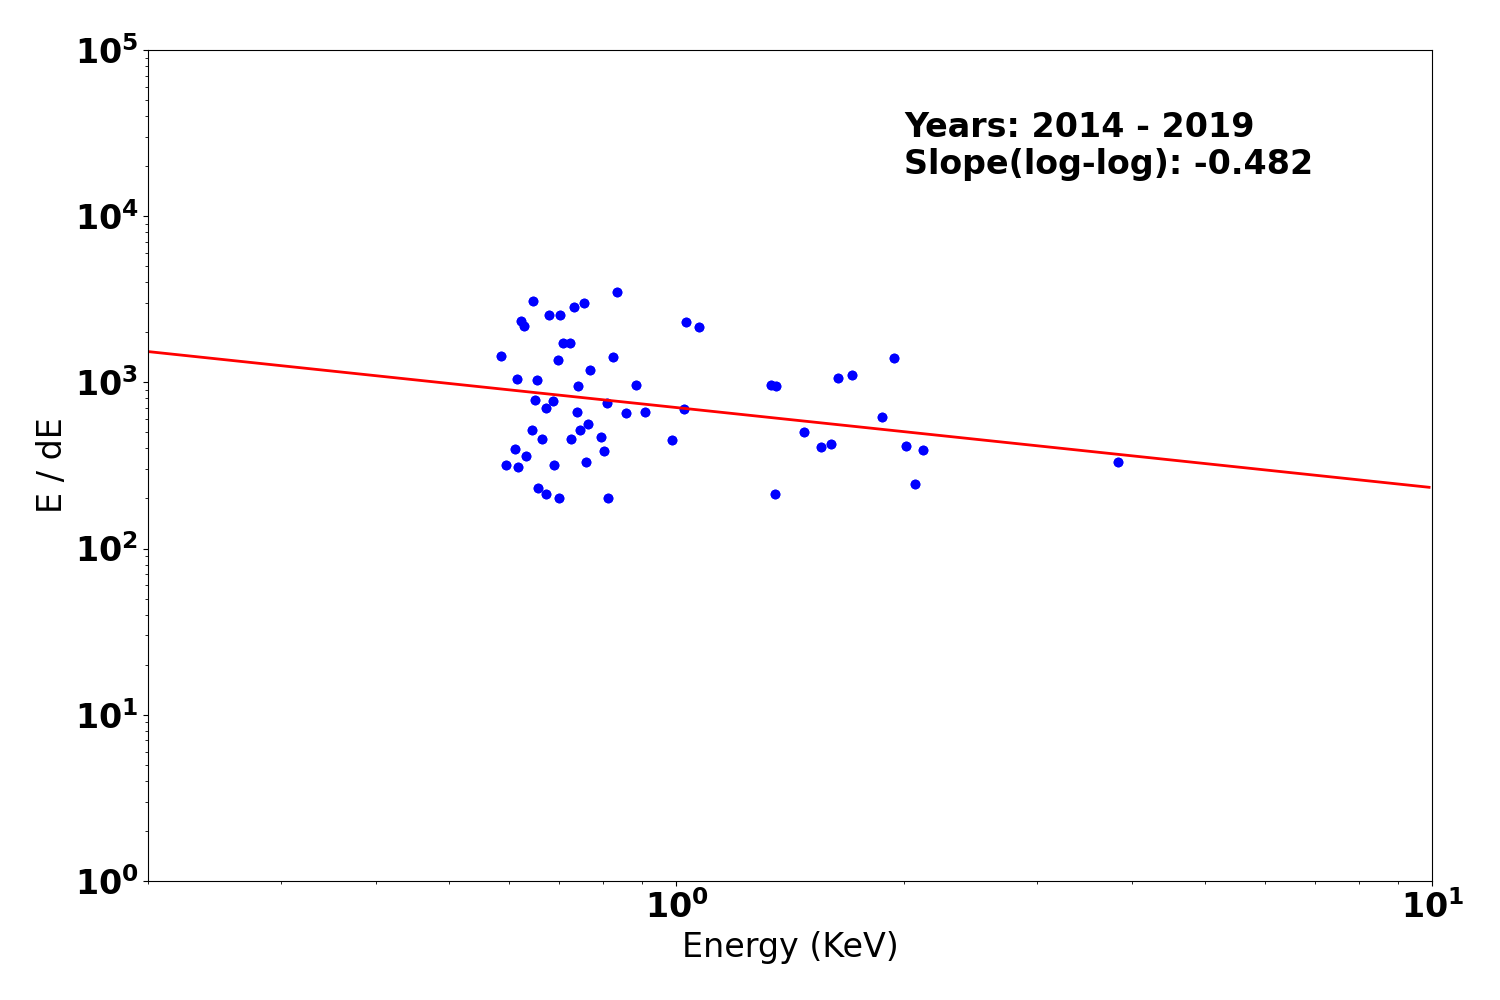
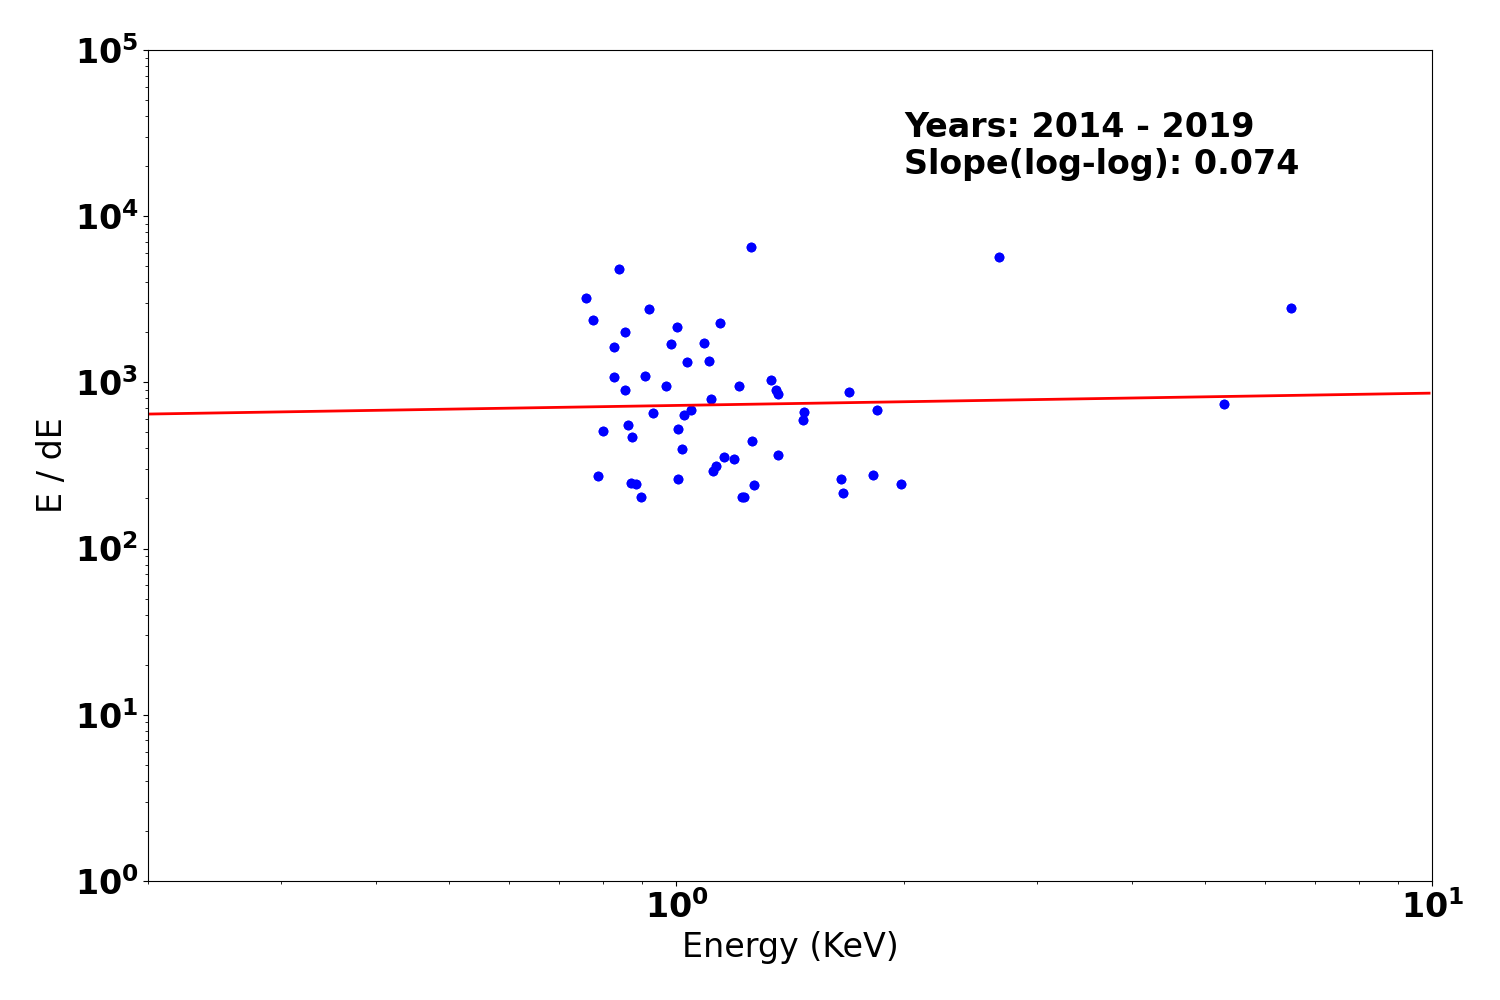
We plot E/dE vs. E for fits to detected lines with fwhm_error/fwhm less than 0.15 for the plus and minus arms of HEG, MEG, and LEG. Also shown are conservative (dotted line) and optimistic (dashed line) pre-launch resolving power expectations.
We have selected only calibration observations of Capella, HR1099, and Sigma Gem. See MIT technotes for a parallel analysis.
| Year 2014 - | |
|---|---|
| Letg minus side | Letg plus side |
 |
 |
| Metg minus side | Metg plus side |
 |
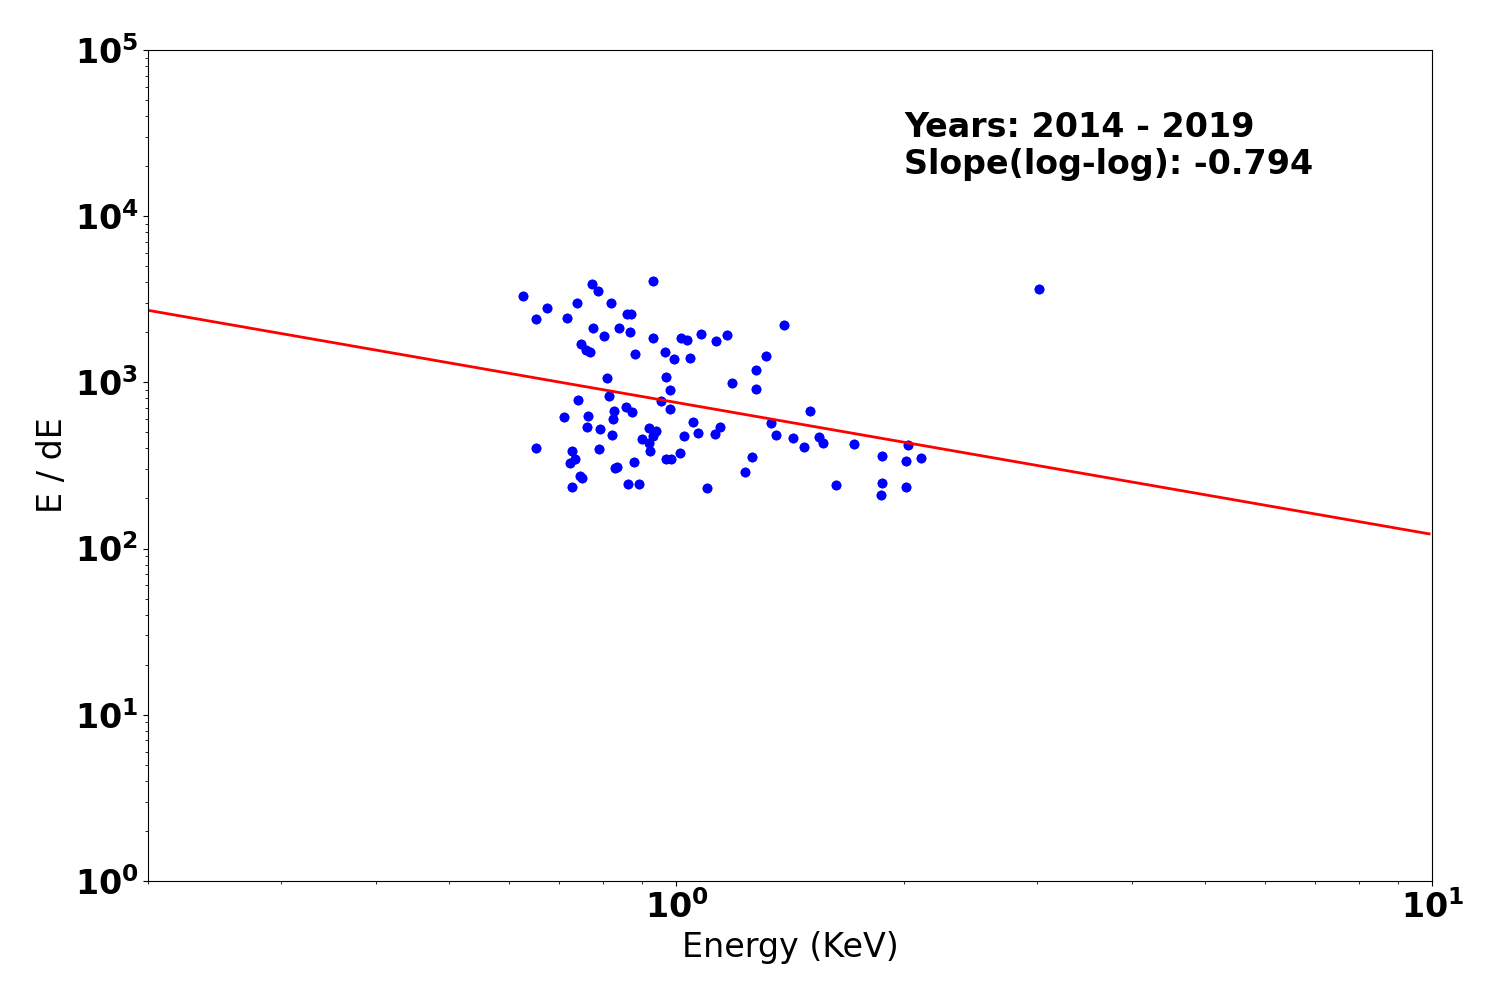 |
| Hetg minus side | Hetg plus side |
 |
 |
PCAD
ACA Trending
| ACIS |
)
|
)
|
)
|
|
|---|---|---|---|---|
)
|
)
|
)
| ||
| HRCI |
)
|
)
|
)
|
)
|
| HRCI |
)
|
)
|
)
|
)
|
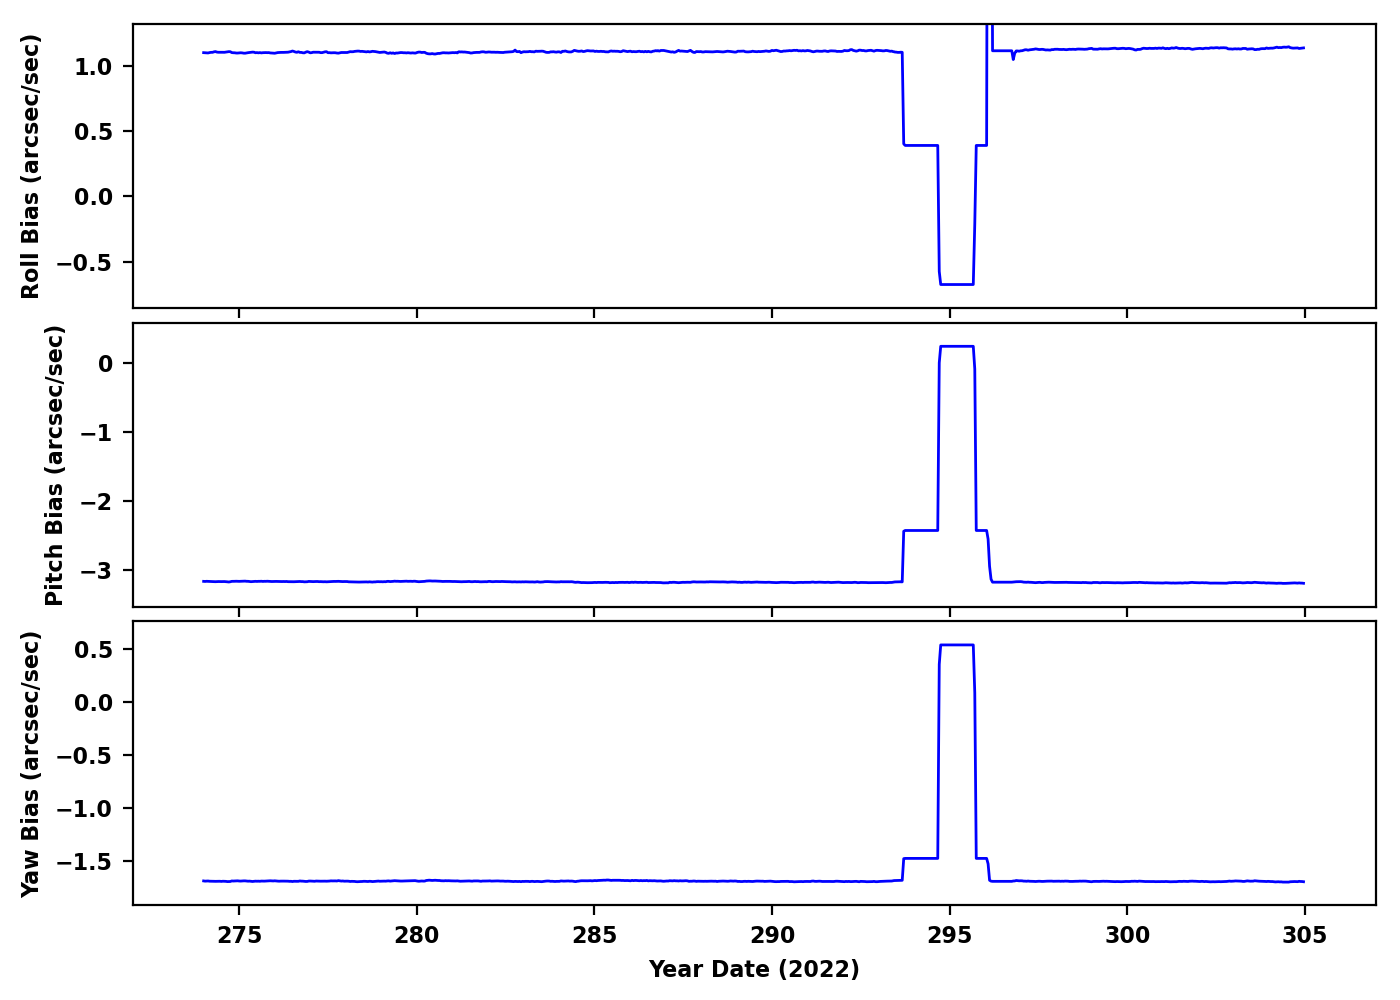
Gyro Bias Drift
Radiation History
Radiation Count Rates of Oct 2022

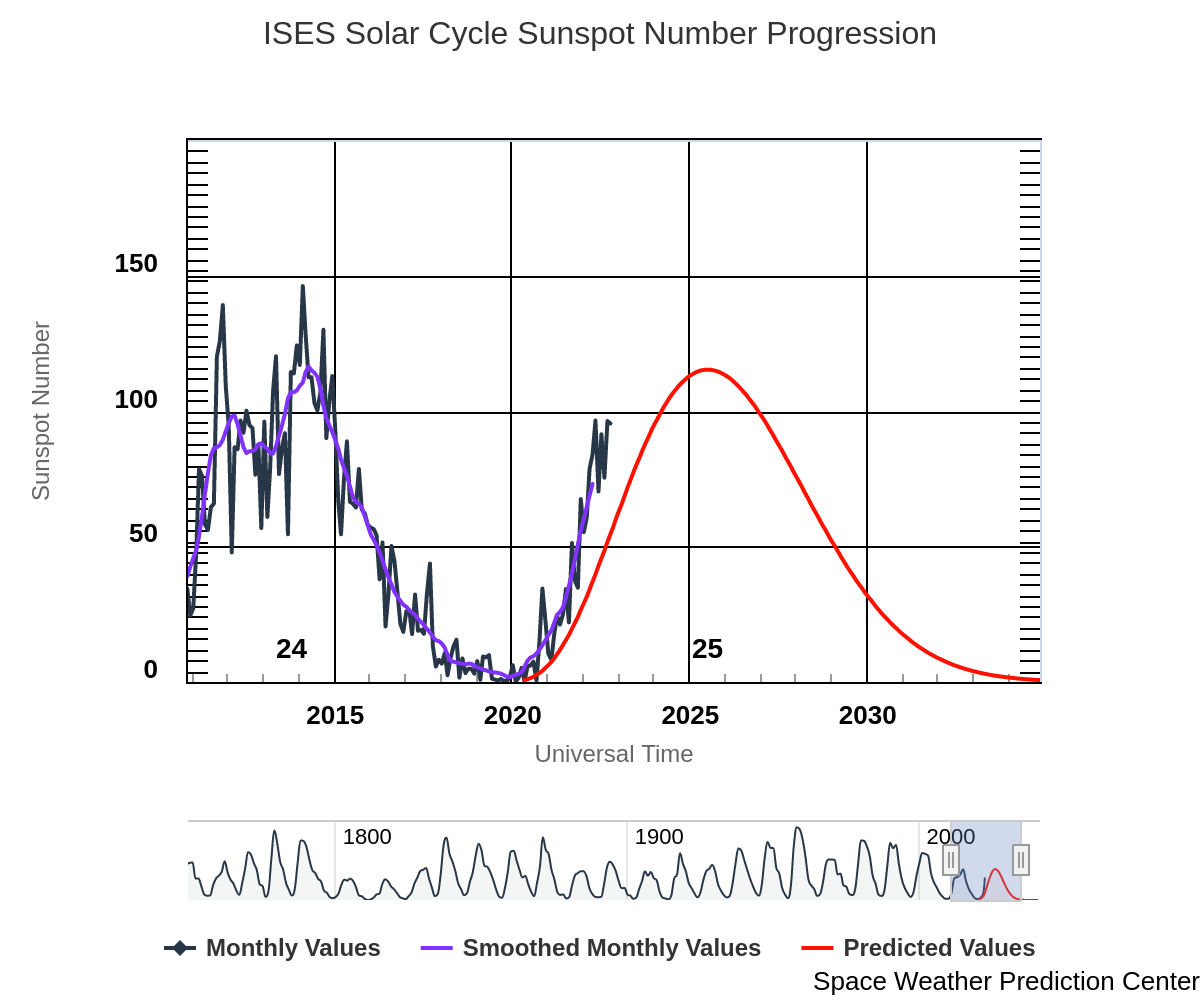
Sun Spot History (See:NOAA Page)
SIM
SIM Shift and Twist
SIM Shift and Twist Trend The following plots show trends of SIM shifts (dy and dz) and twist (dtheta). All quantities are directly taken from pcaf*_asol1.fits files. The units are mm for dy and dz, and degree for dtheta. We fit three lines separated before and after (Days of Mission)= 1400 (May 21, 2003), 2700 (Dec 11, 2006), and 4400 (Aug 07, 2011). The unit of slopes are mm per day or degree per day.
The sudden shift around DOM = 1400, 2700 and 4400 are due to fid light drift (see a memo by Aldcroft fiducial light drift). On the dtheta plot, two tracks are clearly observed. The track around 0.01 is due to HRC-I, and all others are clustered around -0.002. For more detail, please see SIM Shift and Twist Trend page

Trending
Quarterly Trends
- EPS Batteries
| Previous Quarter | |||||||
| MSID | MEAN | RMS | DELTA/YR | DELTA/YR/YR | UNITS | DESCRIPTION | |
| eb2ci | off | 1.016e-04 | 6.808e-05 | 0.34 +/- 0.16 | -0.00 +/- 0.02 | AMP | BATT 2 CHARGE CURRENT | on | 0.003 | 0.007 | 0.41 +/- 0.38 | (0.00+/-0.00)e0 |
|---|---|---|---|---|---|---|---|
| eb2di | off | 2.012e-04 | 1.383e-04 | 0.04 +/- 0.32 | -0.01 +/- 0.04 | AMP | BATT 2 DISCHARGE CURRENT | on | -0.013 | 0.019 | 0.29 +/- 1.13 | (0.00+/-0.00)e0 |
| eb2v | off | -3.720e-04 | 6.626e-05 | 32.31 +/- 0.15 | 0.02 +/- 0.02 | V | BATT 2 VOLTAGE | on | 0.009 | 0.009 | 32.07 +/- 0.53 | (0.00+/-0.00)e0 |
| ecnv1v | 3.814e-06 | 5.232e-06 | 14.89 +/- 0.01 | -(8.37+/-18.26)e-4 | V | CONV 1 +15V OUTPUT | |
| ecnv2v | 5.356e-07 | 4.975e-06 | 14.84 +/- 0.01 | -0.01 +/- 0.00 | V | CONV 2 +15V OUTPUT | |
| ecnv3v | -3.686e-05 | 2.304e-06 | 15.28 +/- 0.01 | -(5.20+/-7.22)e-4 | V | CONV 3 +15V OUTPUT | |
- Spacecraft Electronics
| Previous Quarter | |||||||
| MSID | MEAN | RMS | DELTA/YR | DELTA/YR/YR | UNITS | DESCRIPTION | |
| elbi | -0.008 | 5.842e-04 | 53.41 +/- 1.40 | 0.07 +/- 0.21 | AMP | LOAD BUS CURRENT | |
|---|---|---|---|---|---|---|---|
| elbv | off | -0.006 | 6.722e-05 | 27.76 +/- 0.28 | 0.01 +/- 0.01 | V | LOAD BUS VOLTAGE | on | -1.070e-04 | 0.005 | 28.23 +/- 0.27 | (0.00+/-0.00)e0 |
- OBA Heater
| Previous Quarter | |||||||
| MSID | MEAN | RMS | DELTA/YR | DELTA/YR/YR | UNITS | DESCRIPTION | |
| oobthr04 | 4.179e-04 | 8.664e-04 | (3.02+/-0.02)e2 | 1.03 +/- 0.48 | K | RT 27: HRMA STRUT | |
|---|---|---|---|---|---|---|---|
| oobthr12 | 1.672e-04 | 0.001 | (3.01+/-0.03)e2 | 0.92 +/- 0.75 | K | RT 35: OBA CONE | |
| oobthr26 | 0.005 | 0.002 | (3.04+/-0.04)e2 | 0.94 +/- 1.05 | K | RT 48: OBA CONE | |
| oobthr38 | -0.113 | 0.001 | (2.76+/-0.05)e2 | 0.47 +/- 0.11 | K | RT 60: TFTE CONE | |
| oobthr44 | 9.372e-04 | 0.001 | (3.03+/-0.03)e2 | 1.09 +/- 0.78 | K | RT 66: TFTE COVER | |
| oobthr50 | 0.006 | 9.820e-04 | (2.98+/-0.02)e2 | 0.52 +/- 0.63 | K | RT 76: S/C STRUT | |
Spacecraft Motions
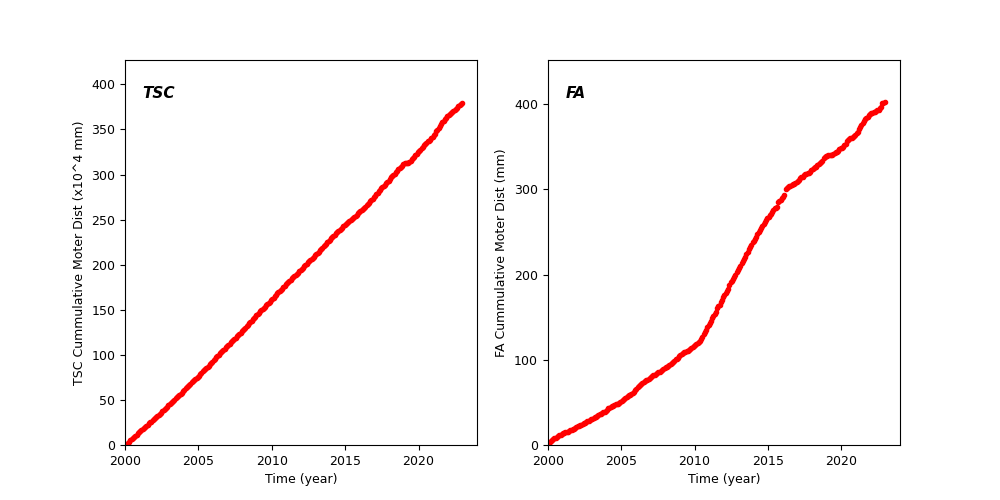
TSC and FA Cummulative Moter Distance
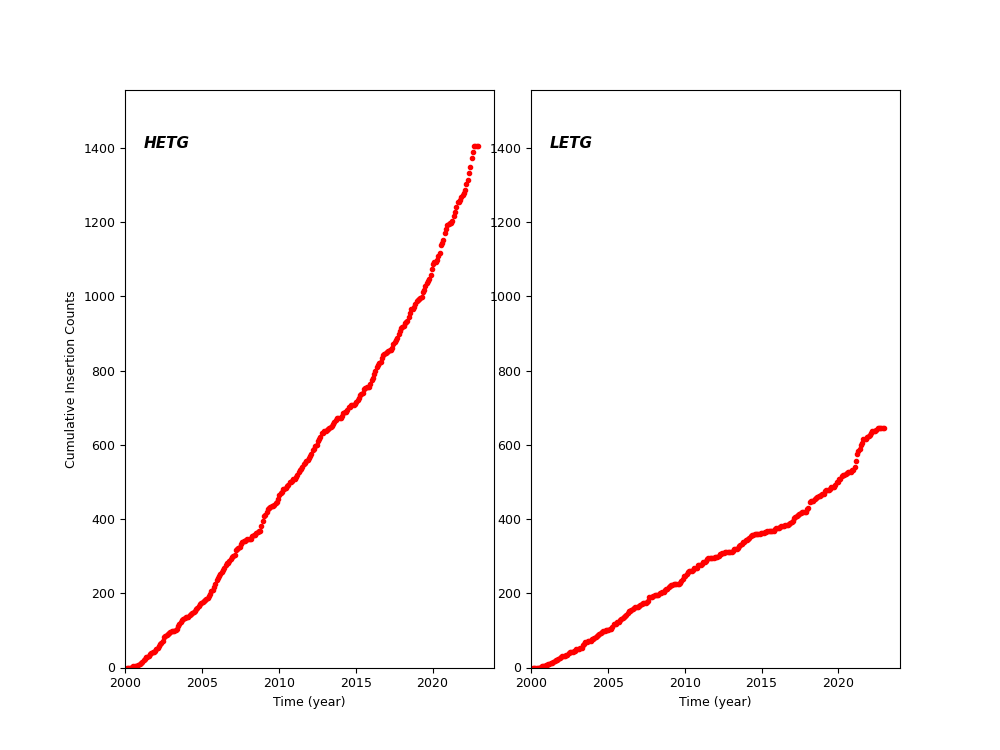
HETG and LETG Cummulative Insertion Counts
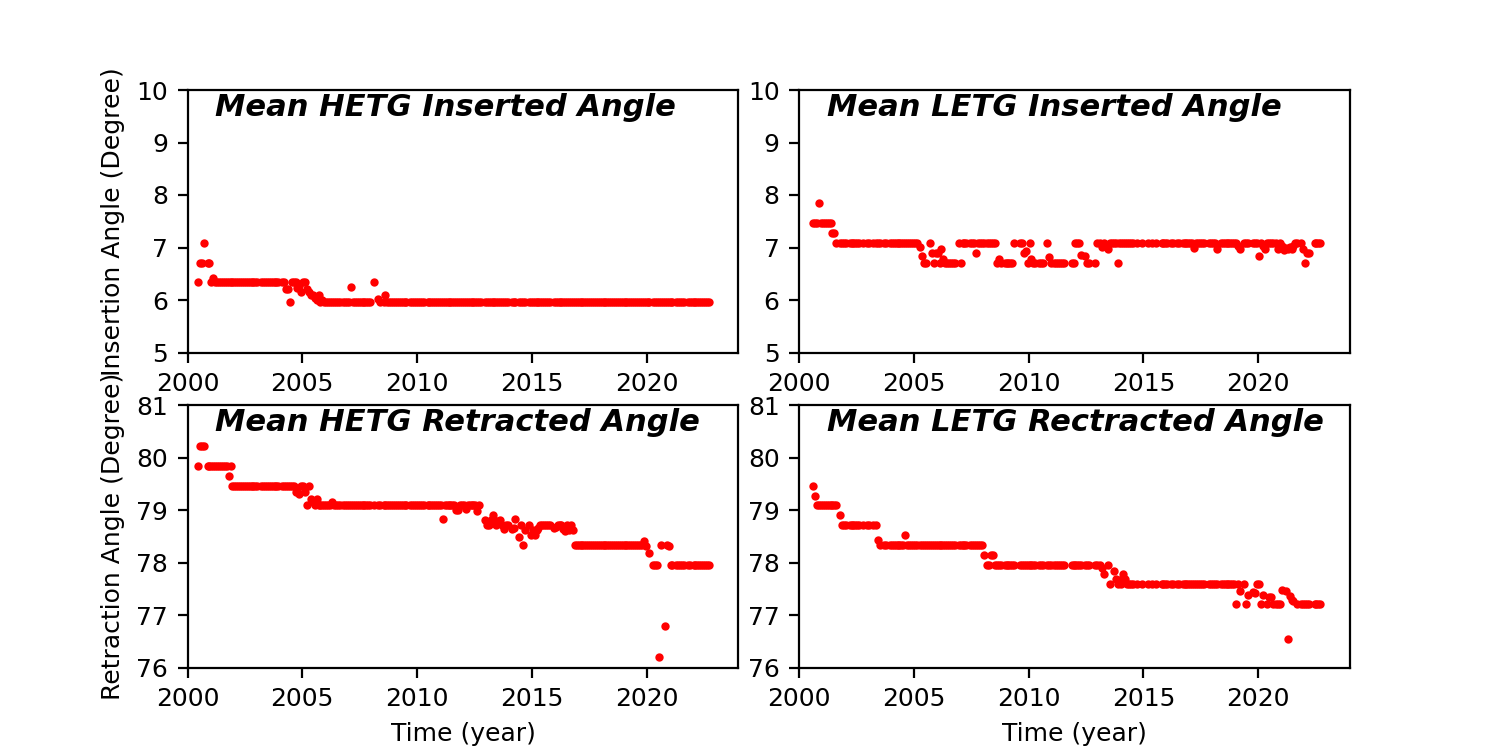
HETG/LETG Insertion/Retraction Angle
Reaction Wheel Rotations