ACIS
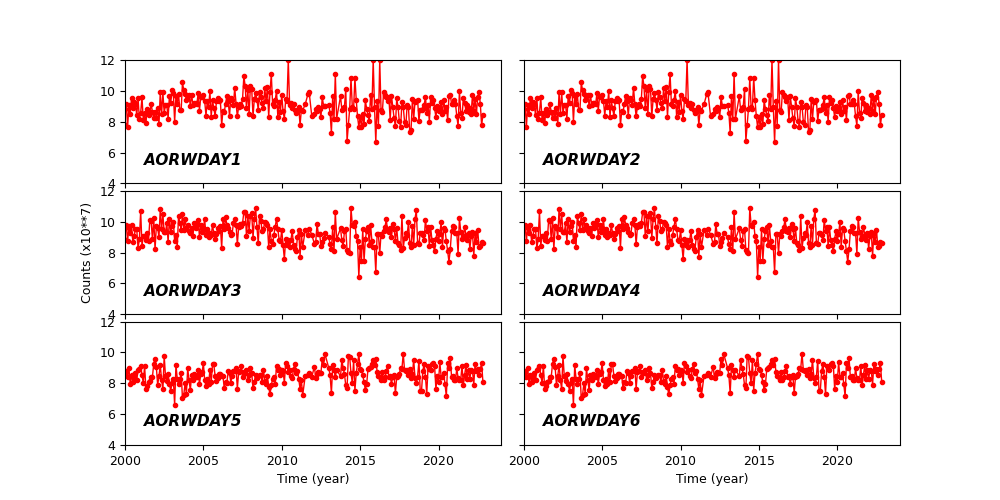
ACIS DOSE Registered-Photon-Map
The steps we took to compute the dose map are;
- Level 1 Event files for a specified month are obtained from archive.
- Image data including I2, I3, S2, S3 CCDs are extracted from all event files.
- All the extracted image data were merged to create a month long exposure map for the month.
- The exposure map is opened with ds9, and check a distribution of count rates against energy. From this, estimate the upper threshold value. Any events beyond this upper threshold are assumed erroneous events such as bad pixels.
- Using this upper threshold, the data is filtered, and create a cleaned exposure map for the month.
- The exposure map from each month from the Sep 1999 is added up to create a cumulative exposure map for each month.
- Using fimgstatistic, we compute count rate statistics for each CCDs.
- For observations with high data drop rates (e.g., Crab nebula, Cas A), we corrected the observations by adding events.
Please check more detail plots at Telemetered Photon Dose Trend page.
)
)
)
Statistics:
# IMAGE     NPIX     MEAN        RMS        MIN     MAX
ACIS_nov22 6004901       5.954         7.303           0.0      516


I2 node 0  262654	5.796810	2.884088	0.0	 64.0
I2 node 1  262654	6.434151	3.195188	0.0	 94.0
I2 node 2  262654	6.441349	3.096277	0.0	 86.0
I2 node 3  262654	5.916243	3.048028	0.0	369.0

I3 node 0  262654	7.160765	3.408201	0.0	 97.0
I3 node 1  262654	7.128761	3.317934	0.0	126.0
I3 node 2  262654	6.932582	3.115585	0.0	 80.0
I3 node 3  262654	6.829780	3.166711	0.0	159.0

S2 node 0  262654	7.483835	3.417654	0.0	 95.0
S2 node 1  262654	8.315009	4.022580	0.0	291.0
S2 node 2  262654	9.327390	5.577954	0.0	348.0
S2 node 3  262654	8.732876	5.475799	0.0	516.0

S3 node 0  262654	9.637680	5.869230	0.0	 98.0
S3 node 1  262654	10.500420	4.844609	0.0	472.0
S3 node 2  262654	10.953837	5.443202	0.0	 68.0
S3 node 3  262654	10.037333	5.978915	0.0	 86.0
)
)
)
Statistics:
 IMAGE     NPIX      MEAN        RMS           MIN      MAX
ACIS_total   6004901       2606.105         3332.533           0.0   143021


I2 node 0  262654	2265.992459	457.042255	484.0	13961.0
I2 node 1  262654	2385.839542	653.490252	499.0	138606.0
I2 node 2  262654	2414.620085	510.939521	521.0	14697.0
I2 node 3  262654	2419.129147	624.182491	487.0	28906.0

I3 node 0  262654	2599.566858	638.640372	485.0	14046.0
I3 node 1  262654	2680.777608	1742.455736	512.0	55891.0
I3 node 2  262654	2394.423469	449.451389	483.0	14320.0
I3 node 3  262654	2378.203133	481.642554	453.0	35118.0

S2 node 0  262654	3033.804006	492.529256	1644.0	22419.0
S2 node 1  262654	3217.078315	731.390814	1830.0	17365.0
S2 node 2  262654	3559.643149	733.213453	2244.0	30734.0
S2 node 3  262654	3520.779584	588.872569	1977.0	74511.0

S3 node 0  262654	5389.660566	2945.250334	2364.0	54383.0
S3 node 1  262654	6595.750743	2366.819480	0.0	49400.0
S3 node 2  262654	5327.470921	1343.501976	2457.0	27319.0
S3 node 3  262654	4176.771728	761.459319	2519.0	26506.0
)
|
)
|
)
|
)
|
| Aug 2022 | May 2022 | Feb 2022 | Nov 2021 |
|---|
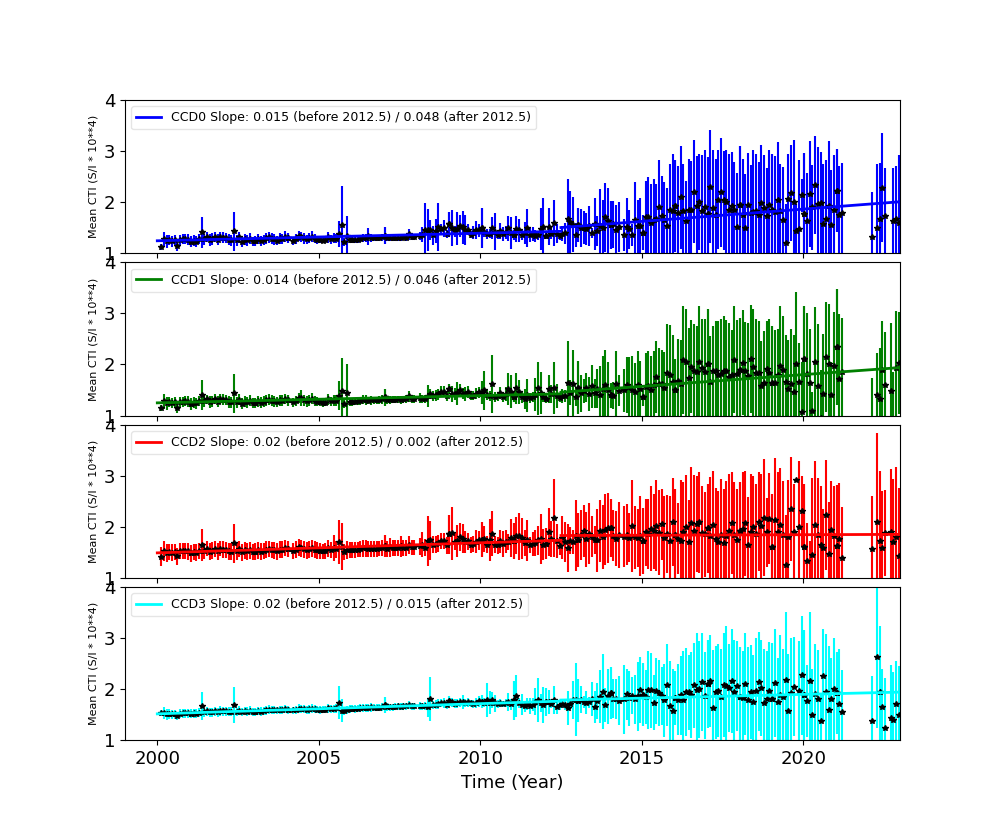
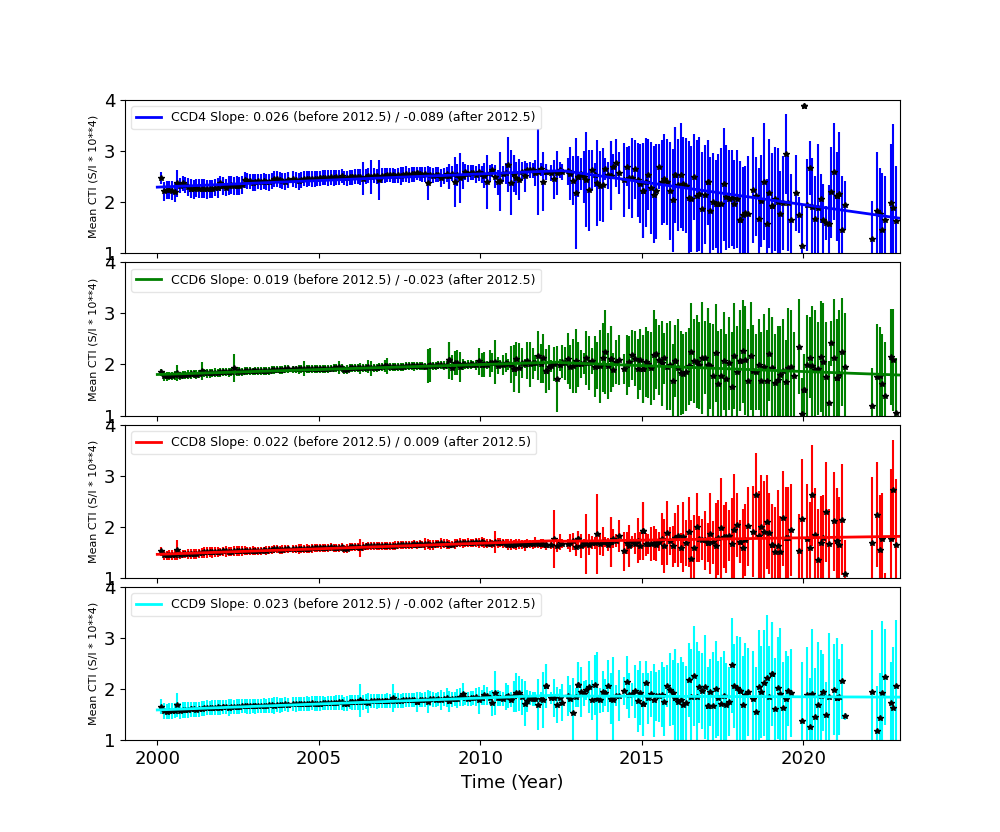
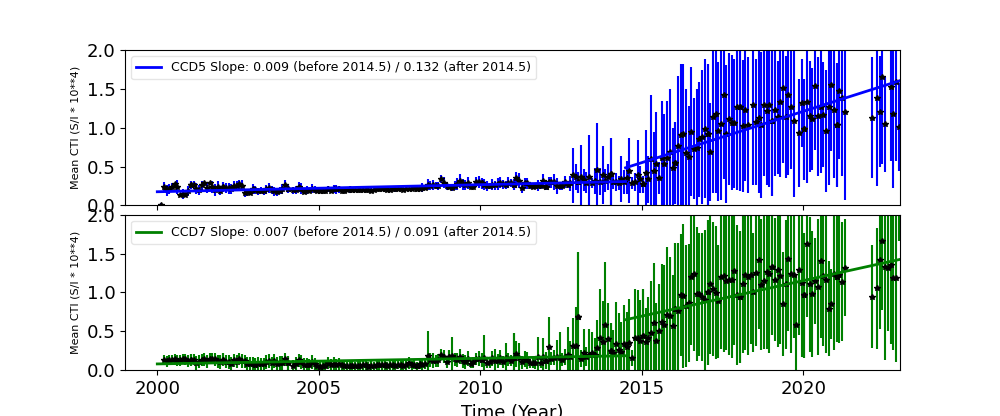
The Mean Detrended CTI
We report CTIs with a refined data definition. CTIs were computed for the temperature dependency corrected data. Please see CTI page for detailed explanation. CTI's are computed for Mn K alpha, and defined as slope/intercept x10^4 of row # vs ADU. Data file: here
Imaging CCDs
Spectral CCDs
Backside CCDs
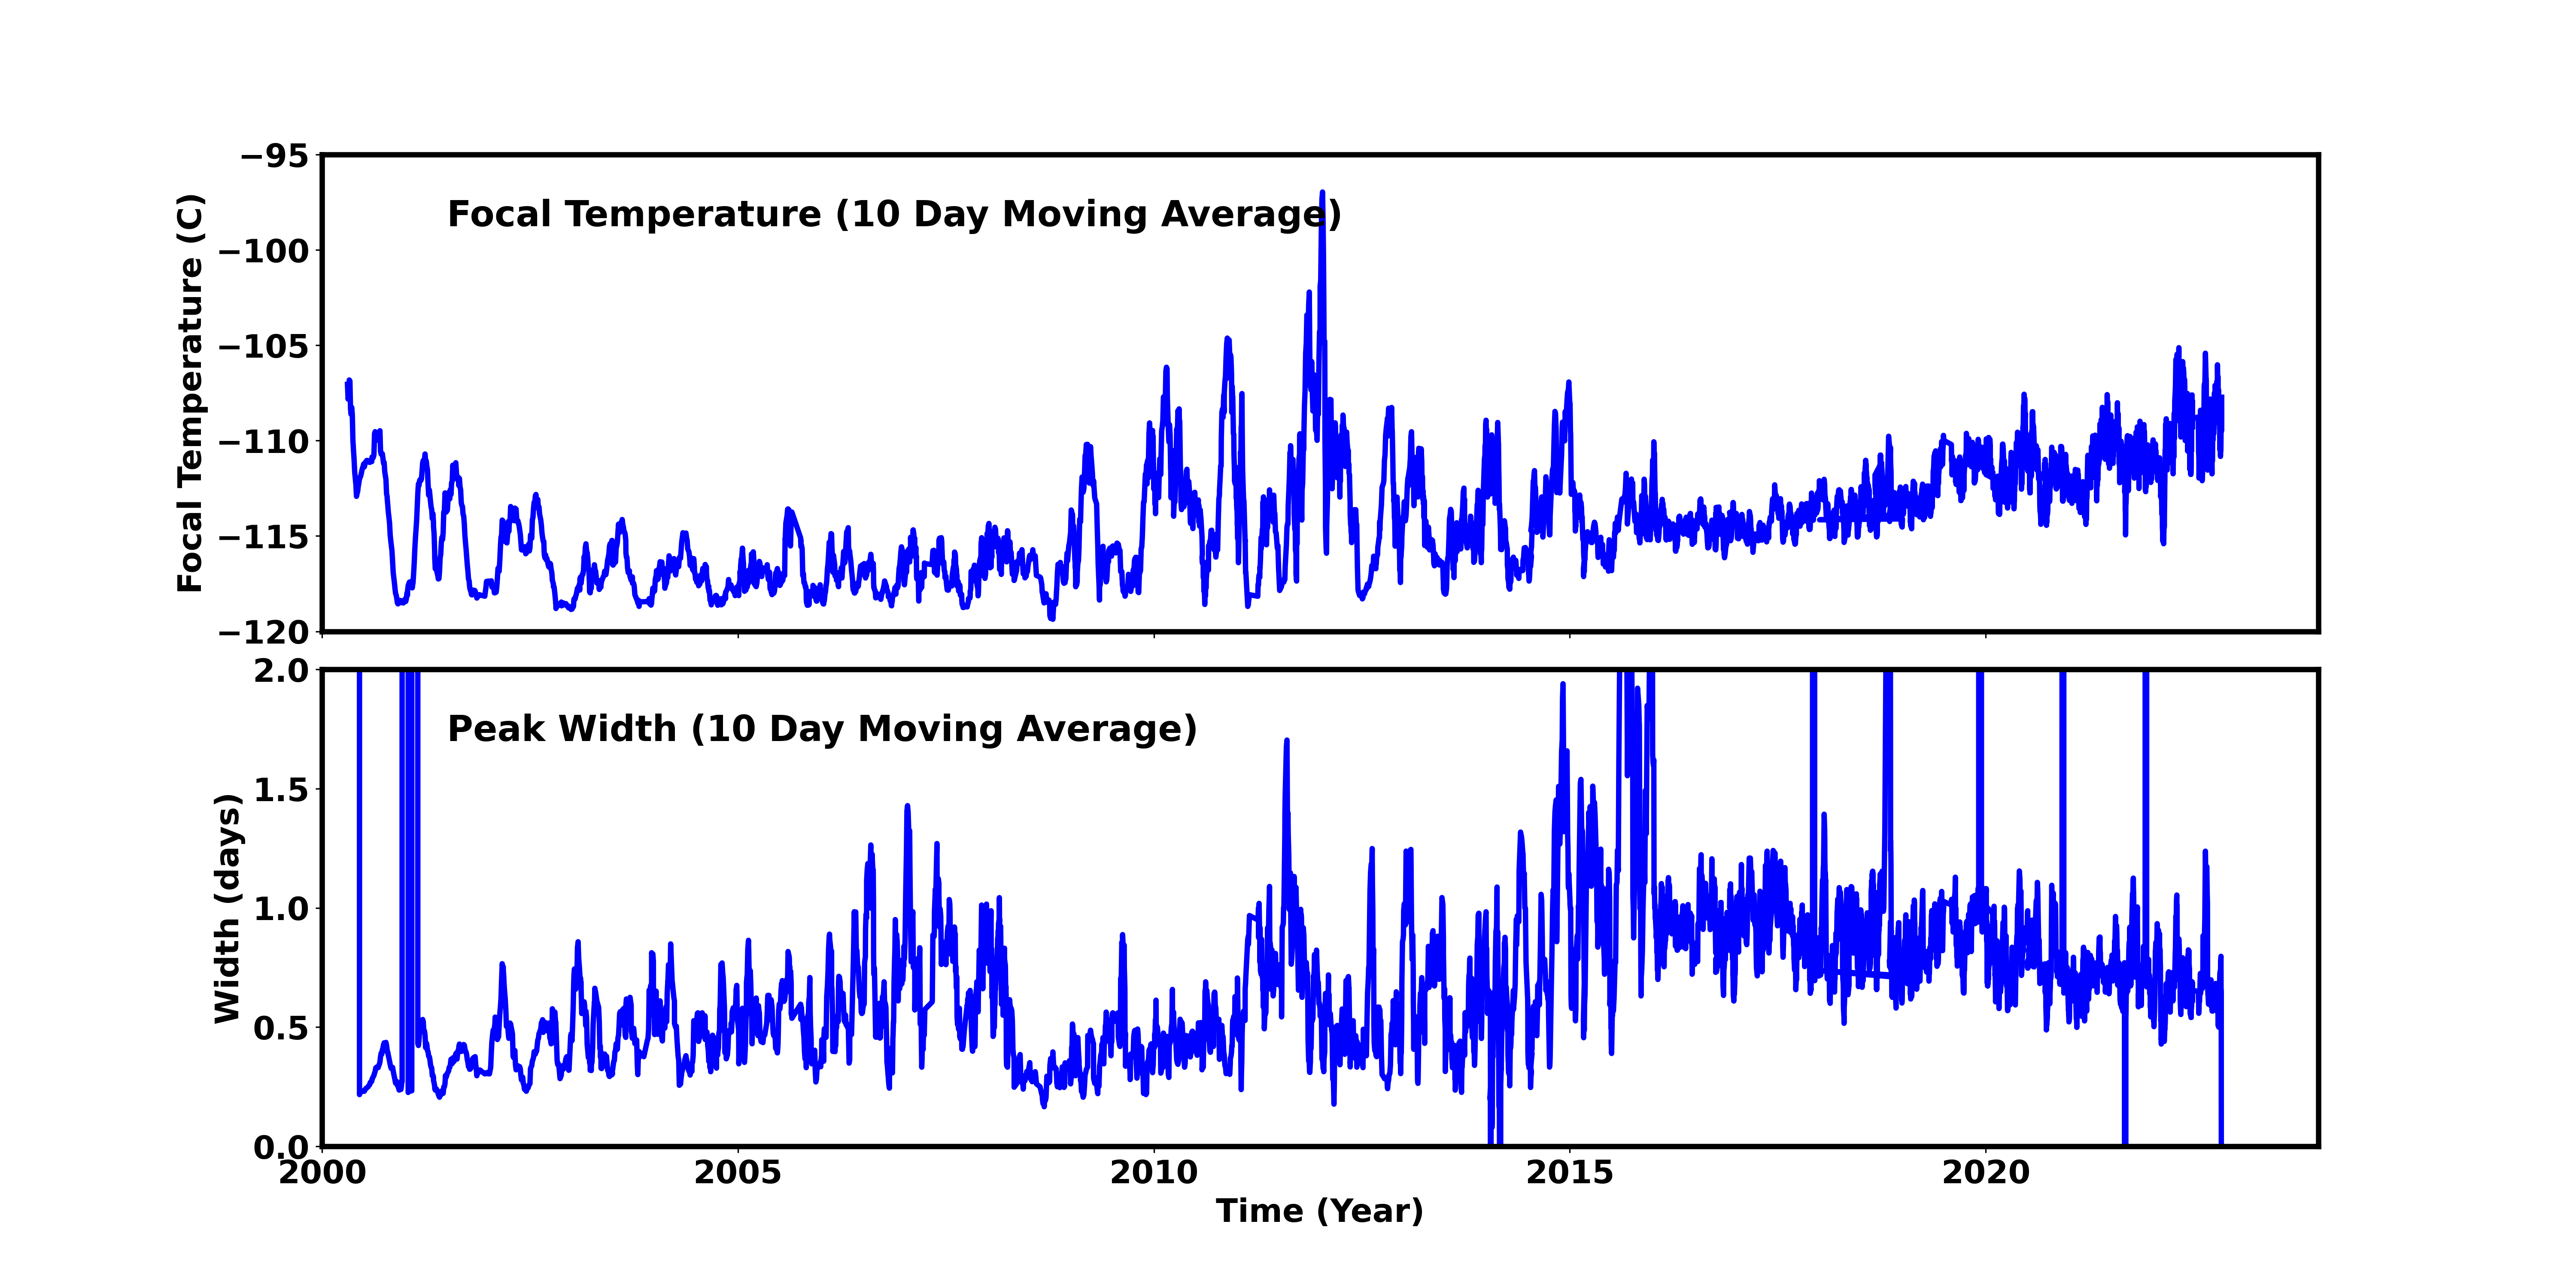
Focal Plane Temperature
Nov 2022 Focal Temperature
| The Mean (max) FPT: | |
|---|---|
| -108.43 | +/- 6.42 C |
| Mean Width: | |
| 0.01 | +/- 4.31 days |
Averaged Focal Plane Temperature
We are using 10 period moving averages to show trends of peak temperatures and peak widths. Note, the gaps in the width plot are due to missing/corrupted data.
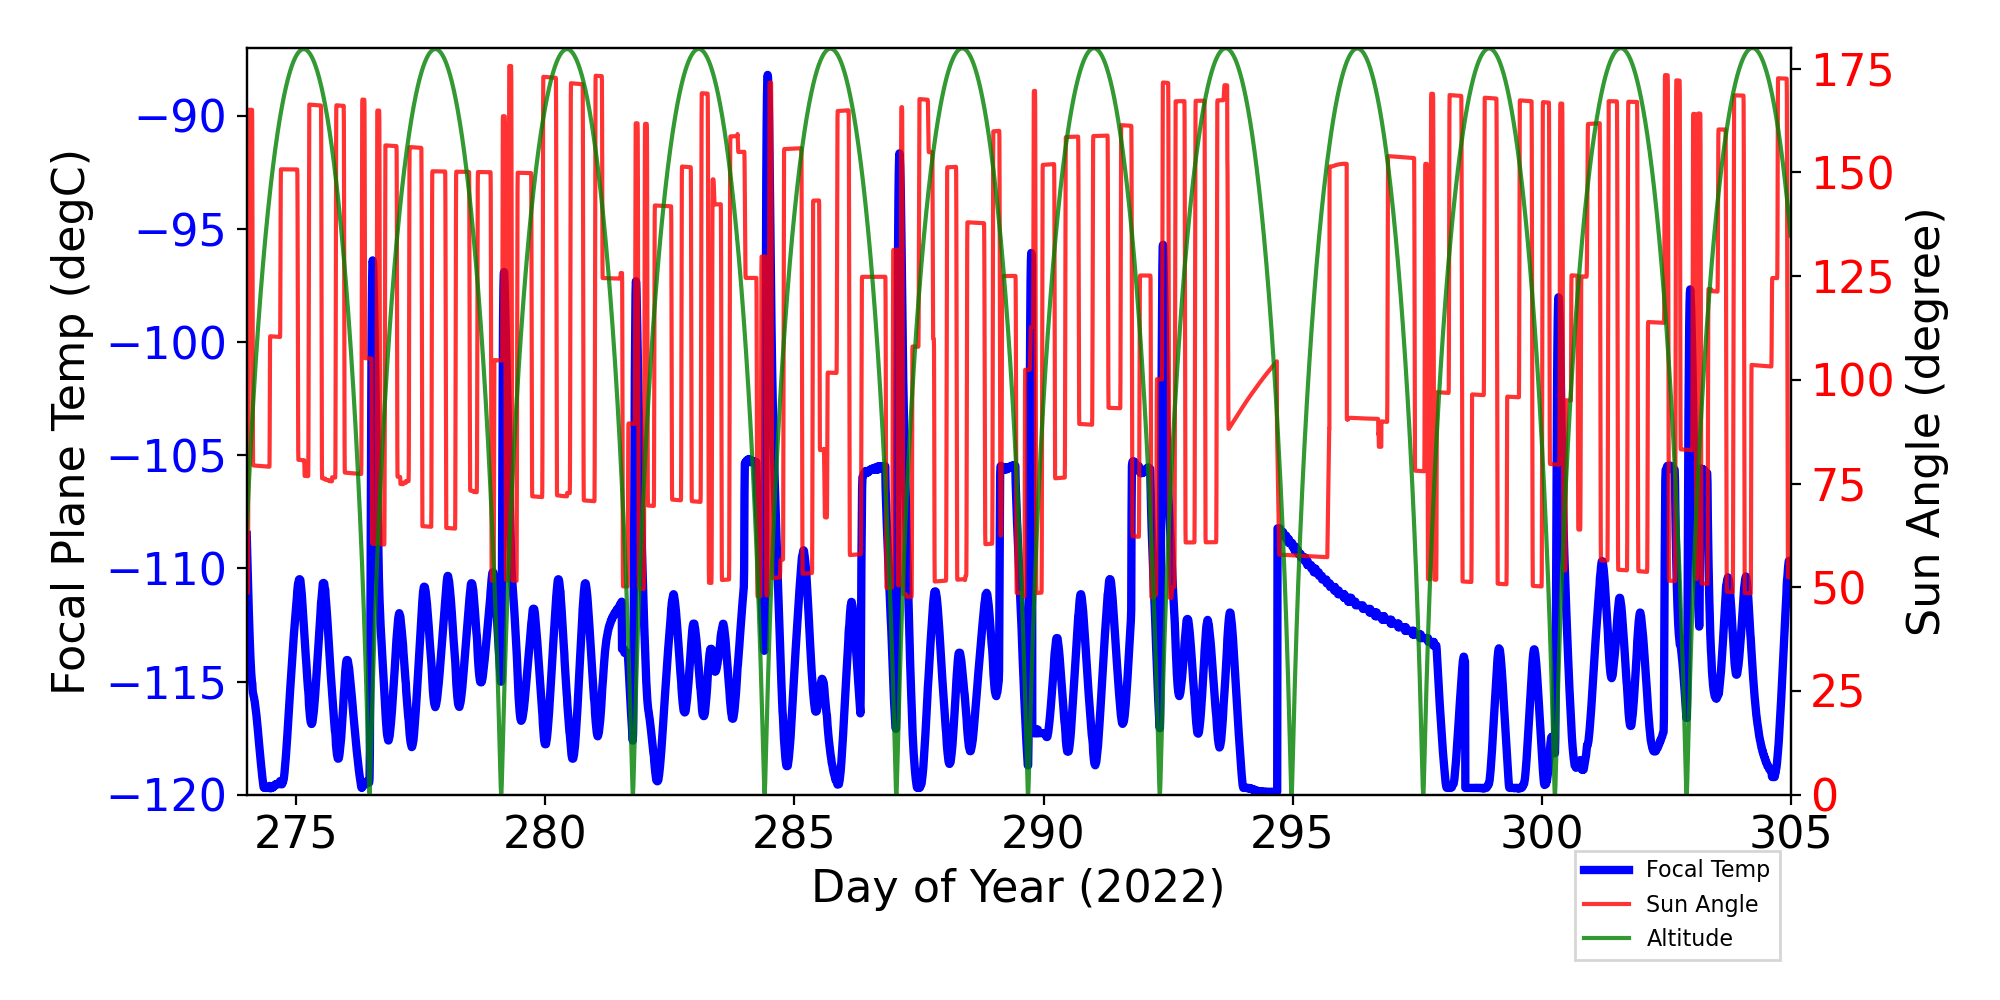
Focal Plane Temperature, Sun Angle and Altitude
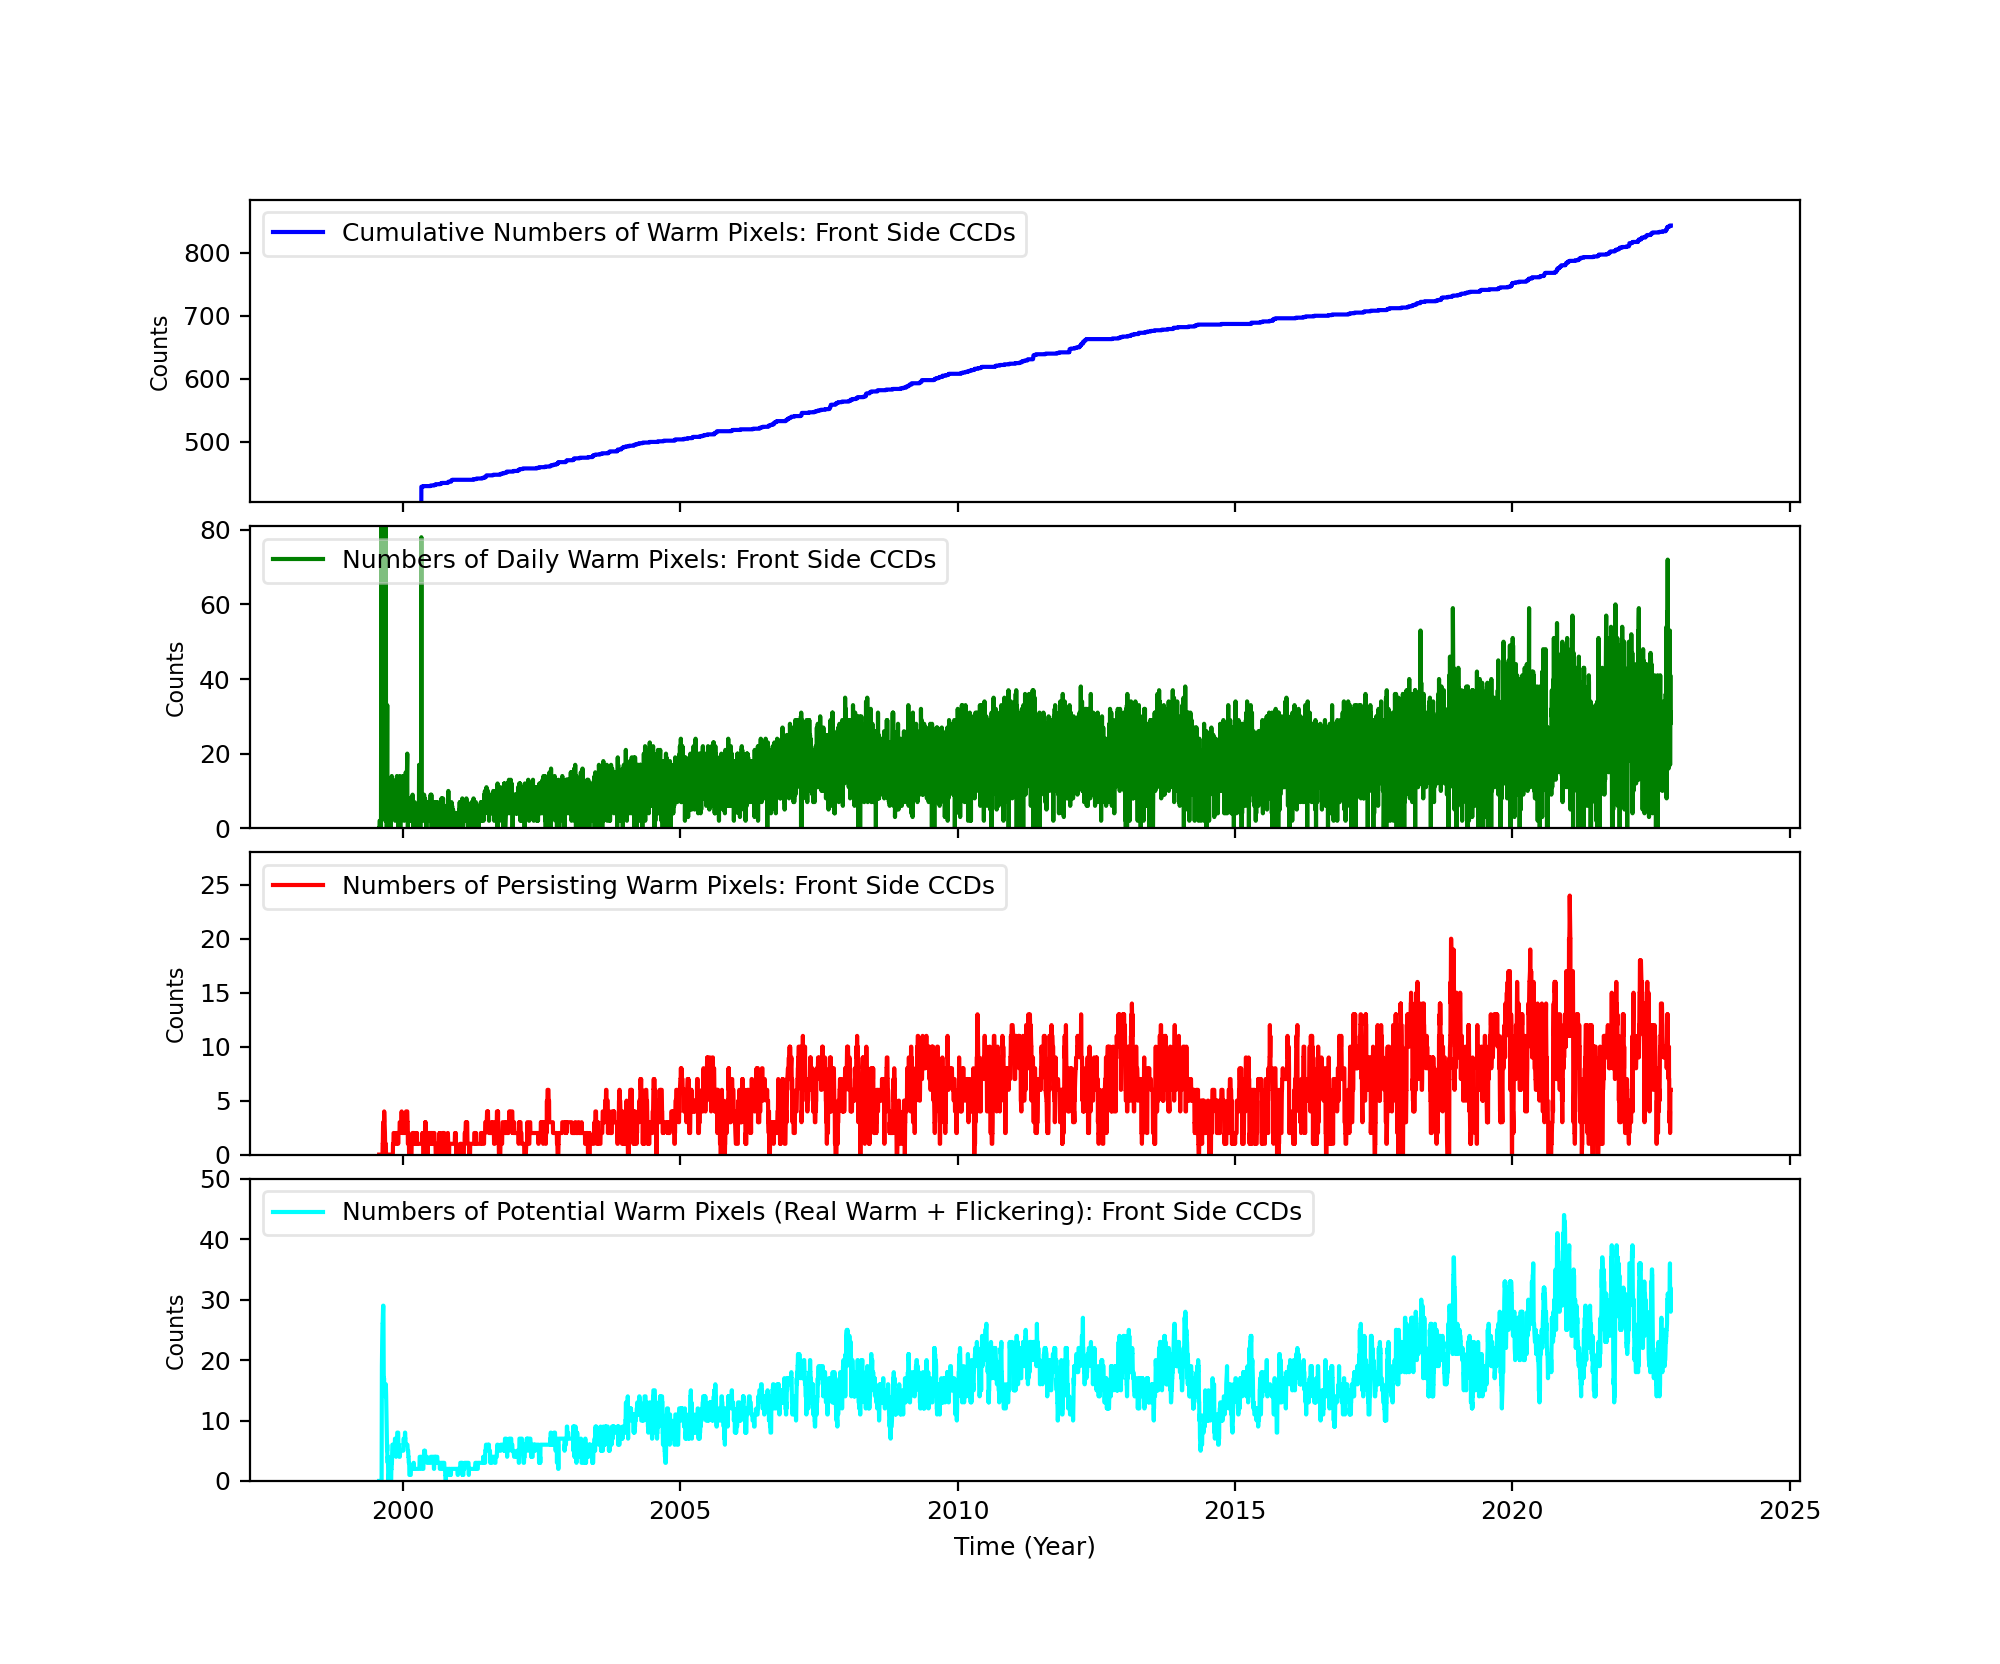
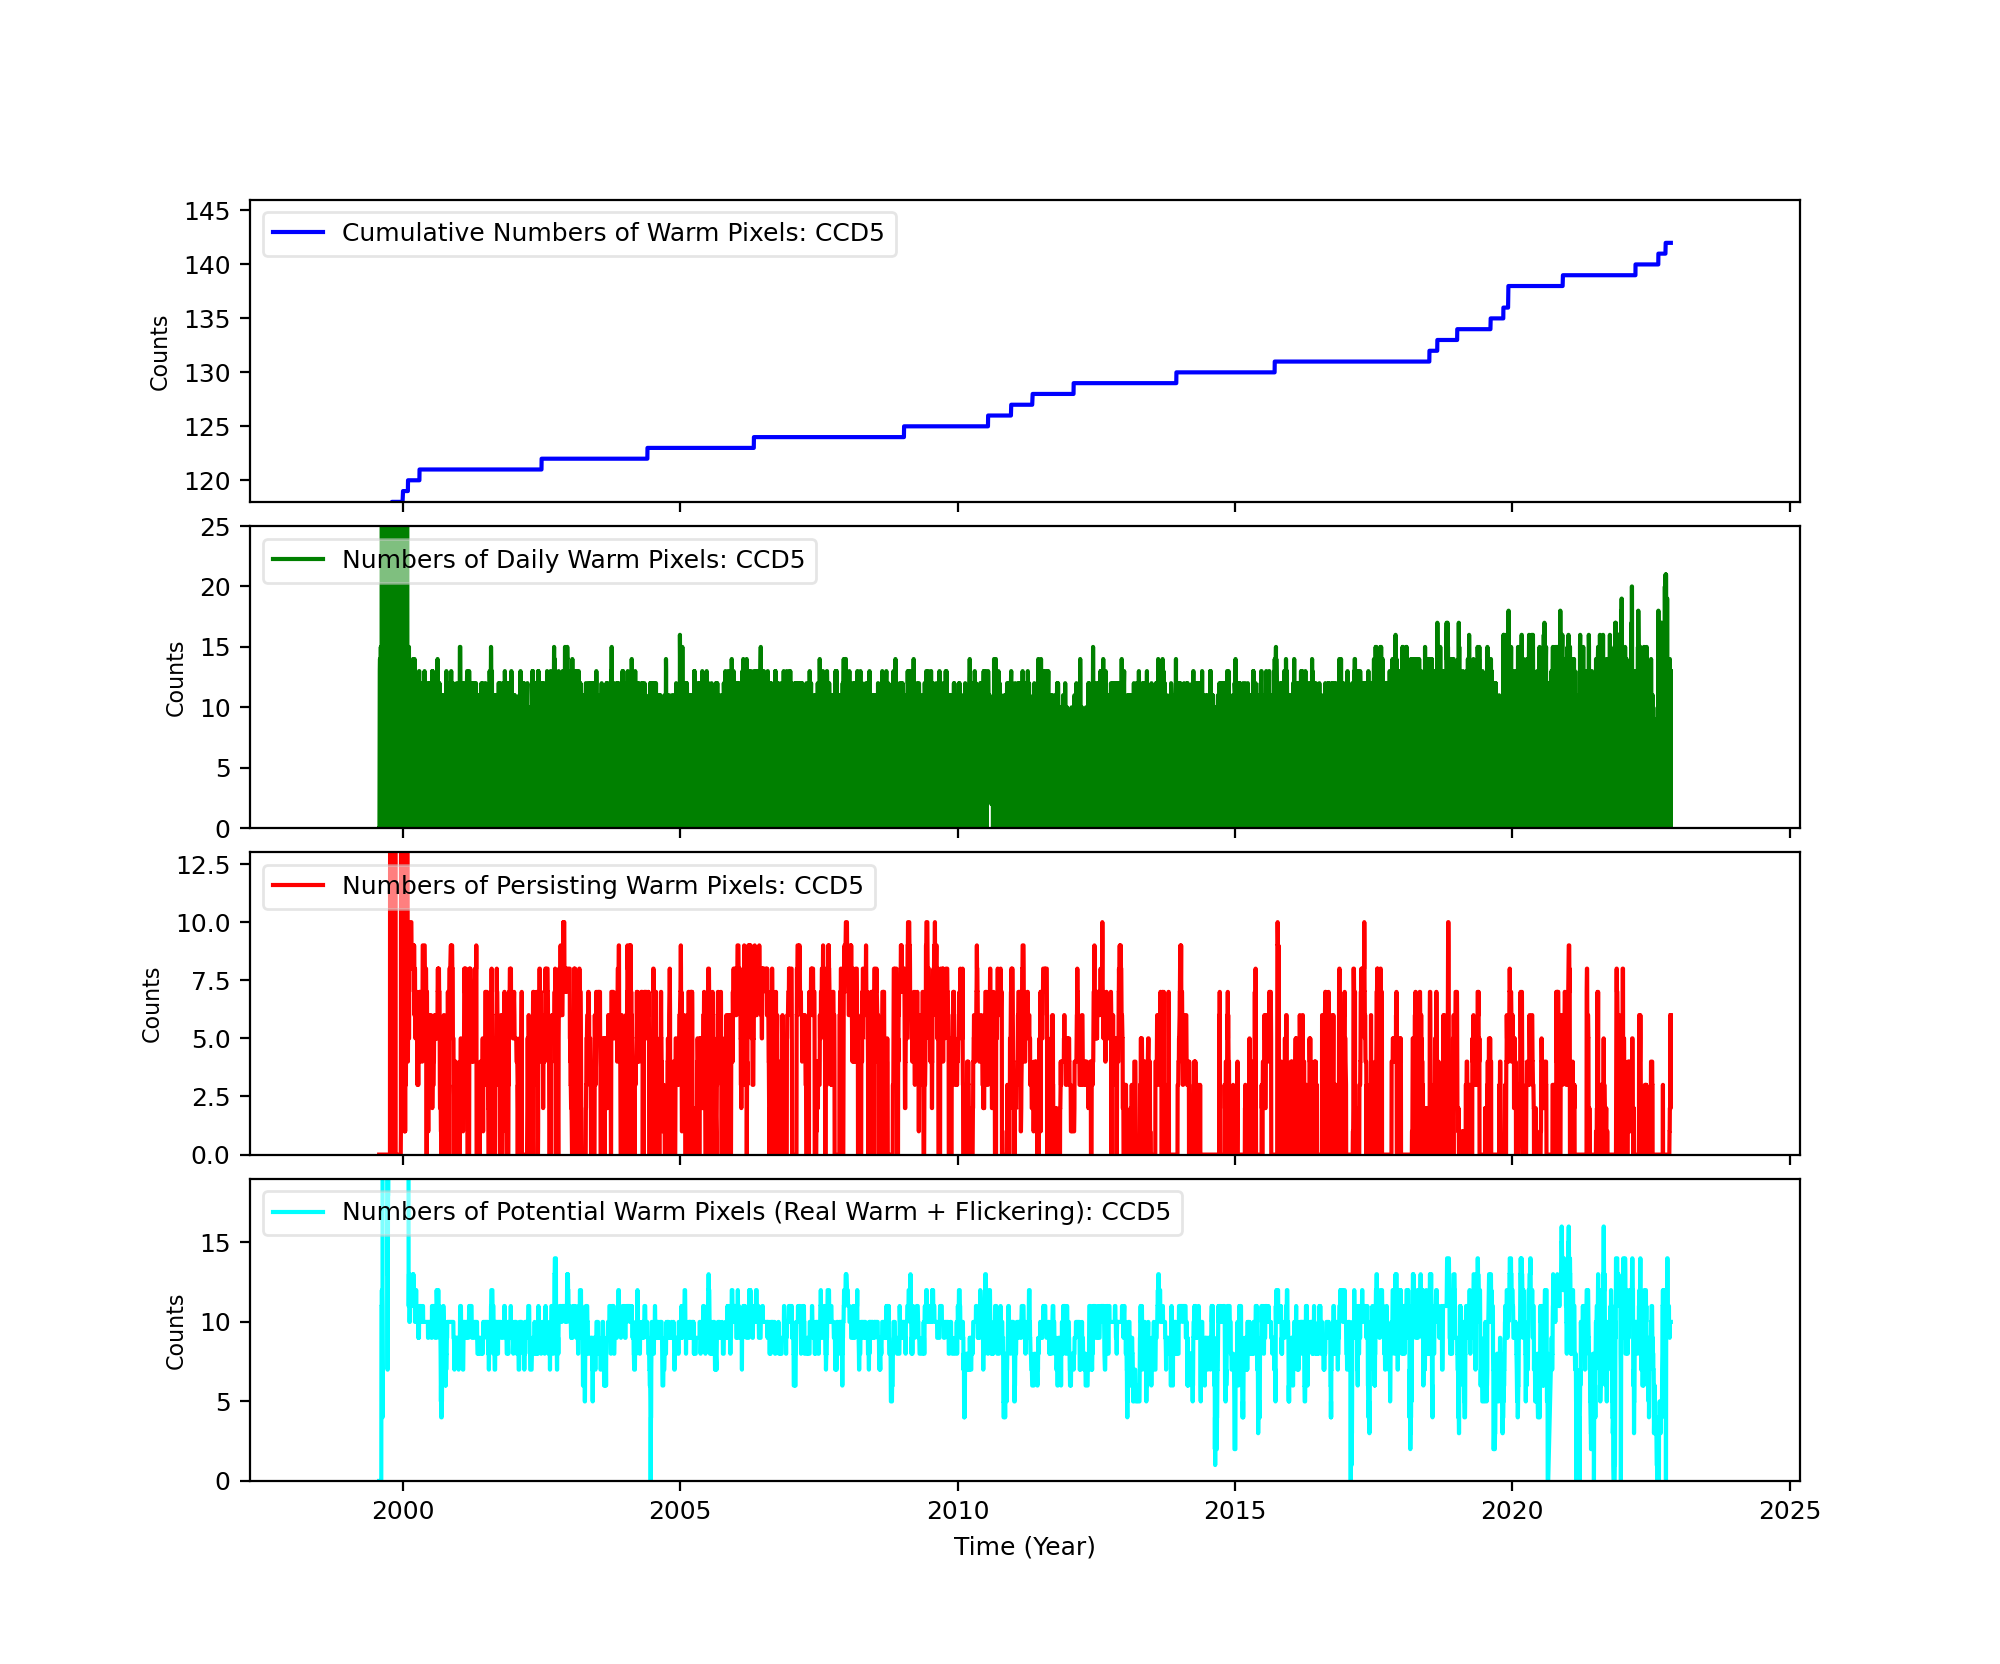
Bad Pixels
The plots below were generated with a new warm pixel finding script. Please see Acis Bad Pixel Page for details.
Front Side CCDs
Back Side CCD (CCD5)
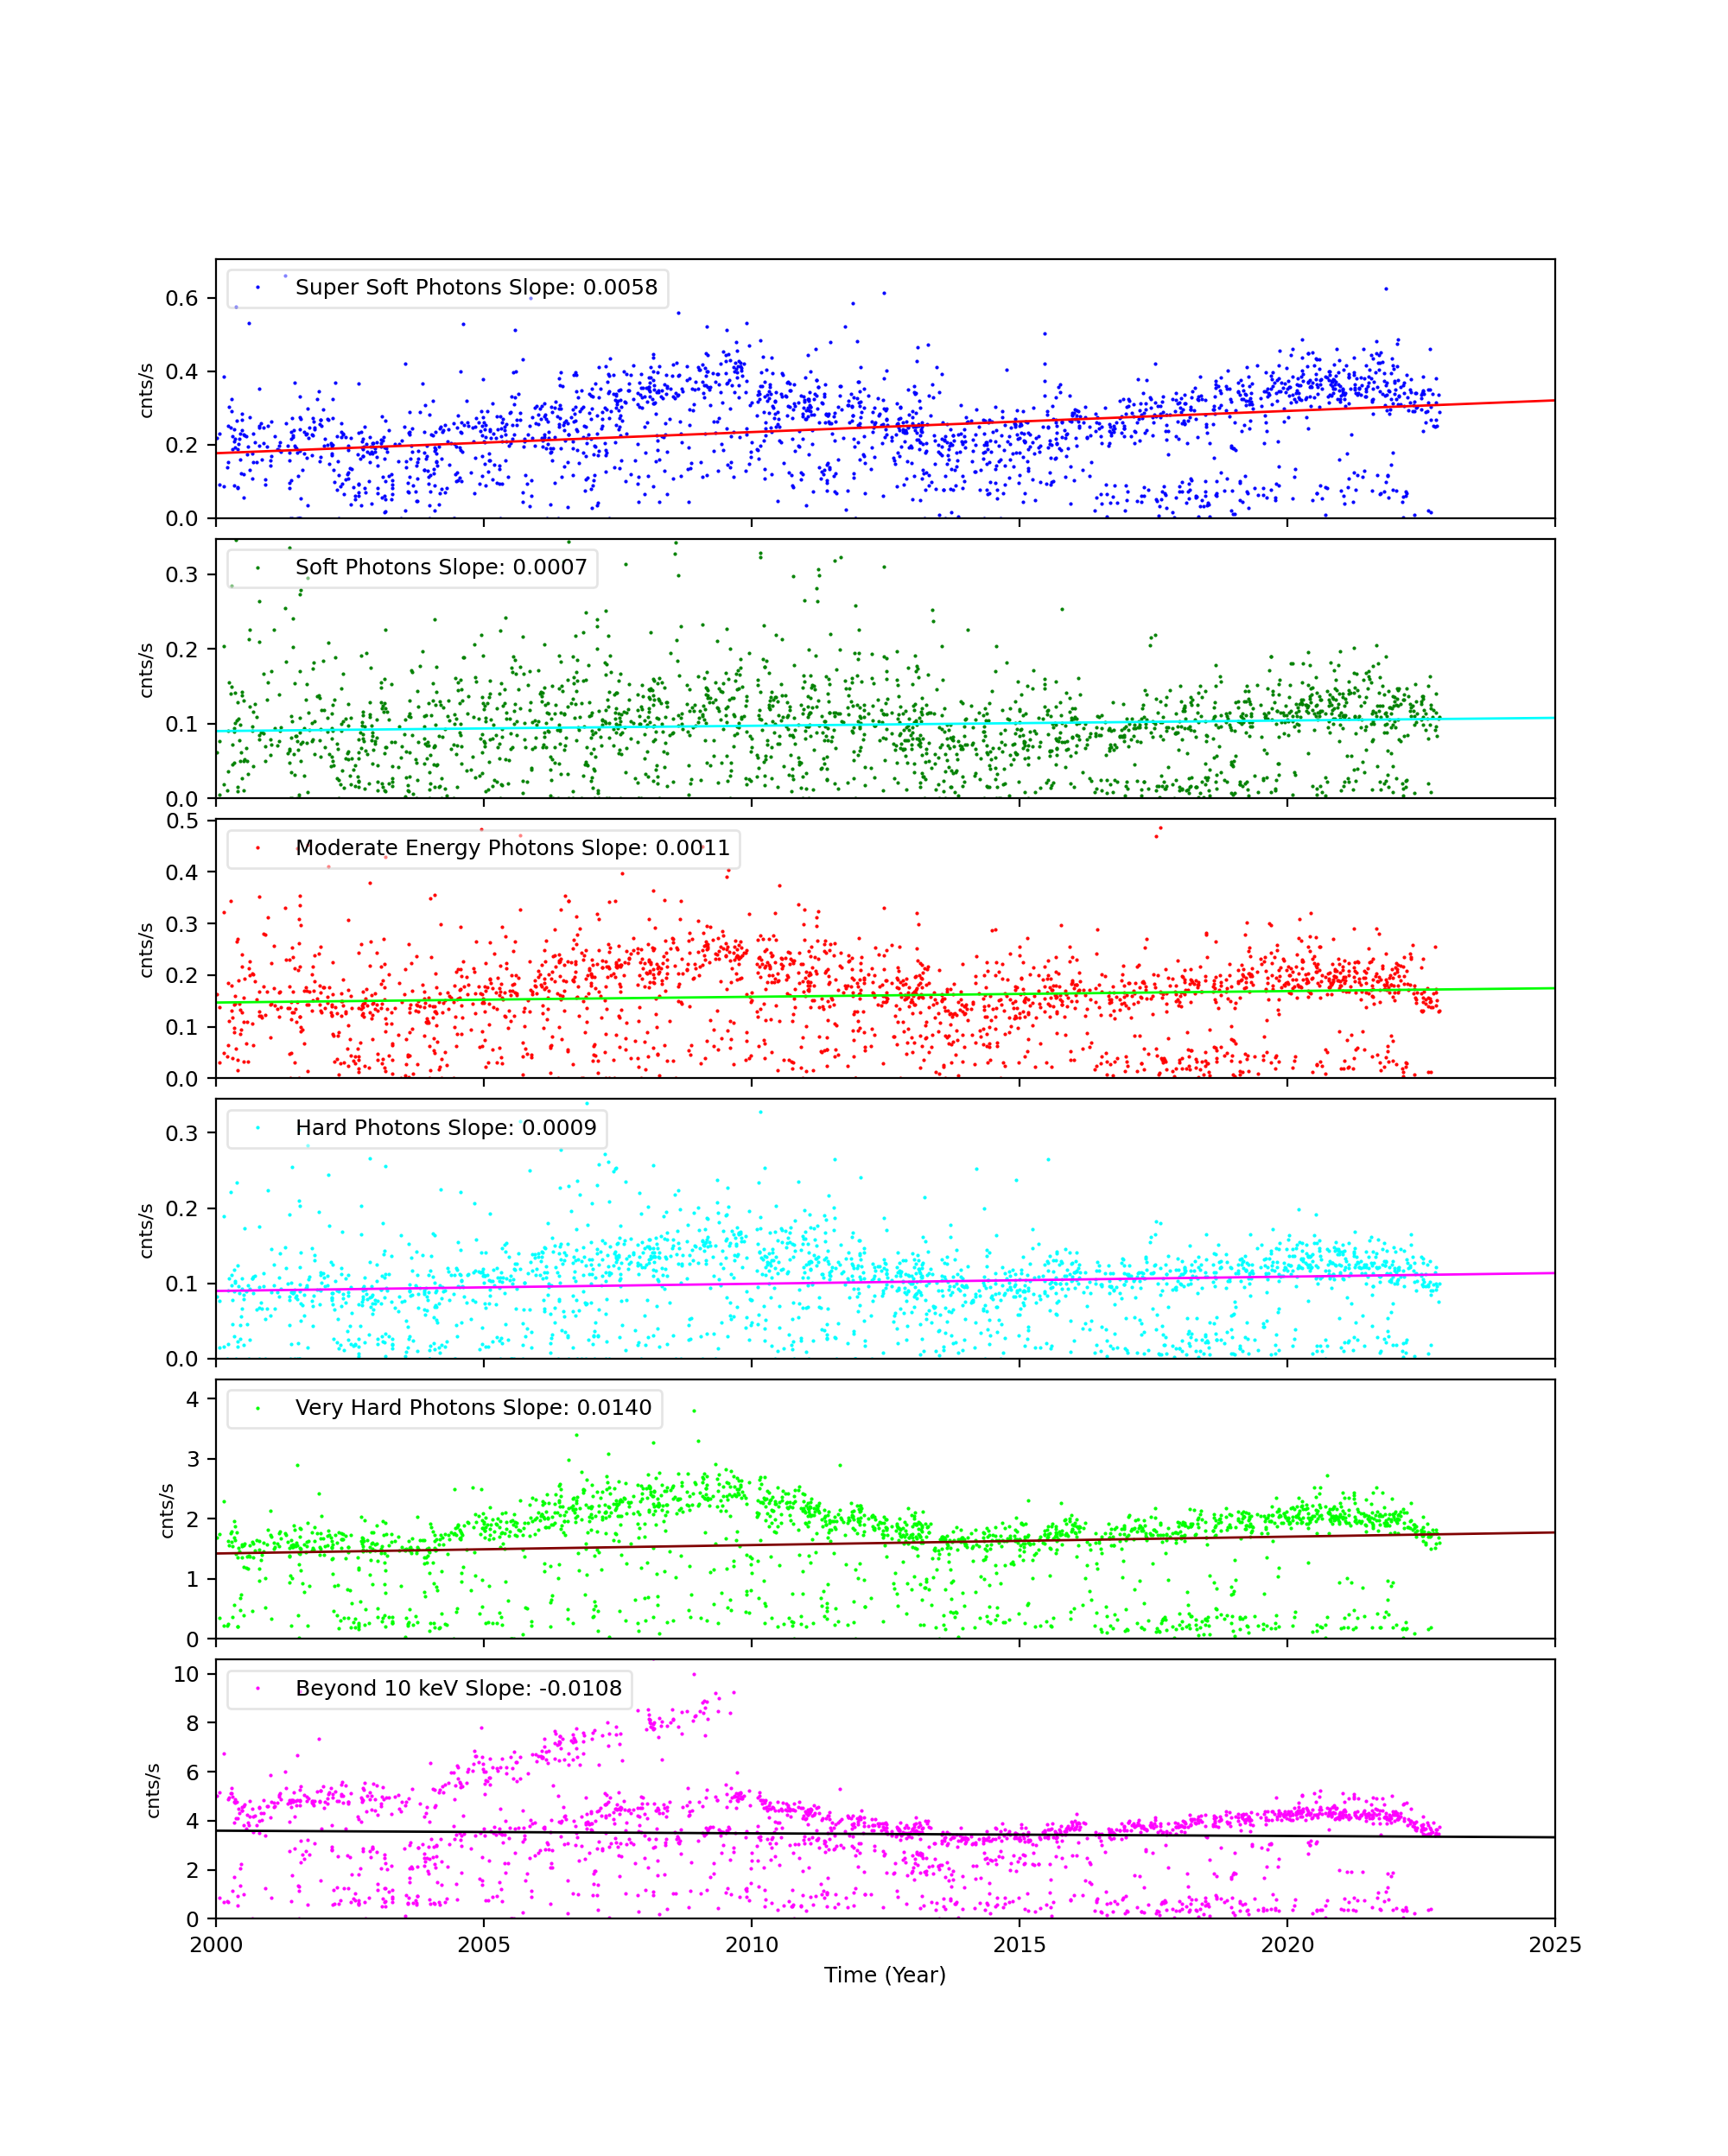
Science Instrument Background Rates
| Name | Low (keV) | High(KeV) | Description |
|---|---|---|---|
| SSoft | 0.00 | 0.50 | Super soft photons |
| Soft | 0.50 | 1.00 | Soft photons |
| Med | 1.00 | 3.00 | Moderate energy photons |
| Hard | 3.00 | 5.00 | Hard Photons |
| Harder | 5.00 | 10.00 | Very Hard photons |
| Hardest | 10.00 | Beyond 10 keV |


The following three plots show trends of SIB from year 2000. CCDs shown here are CCD3, CCD5, and CCD7. Fitted lines are linear fit after eliminating extreme outliers. For >10 keV plots, 2 lines are fit. One is with a 13 keV filter, and another without.
CCD 3
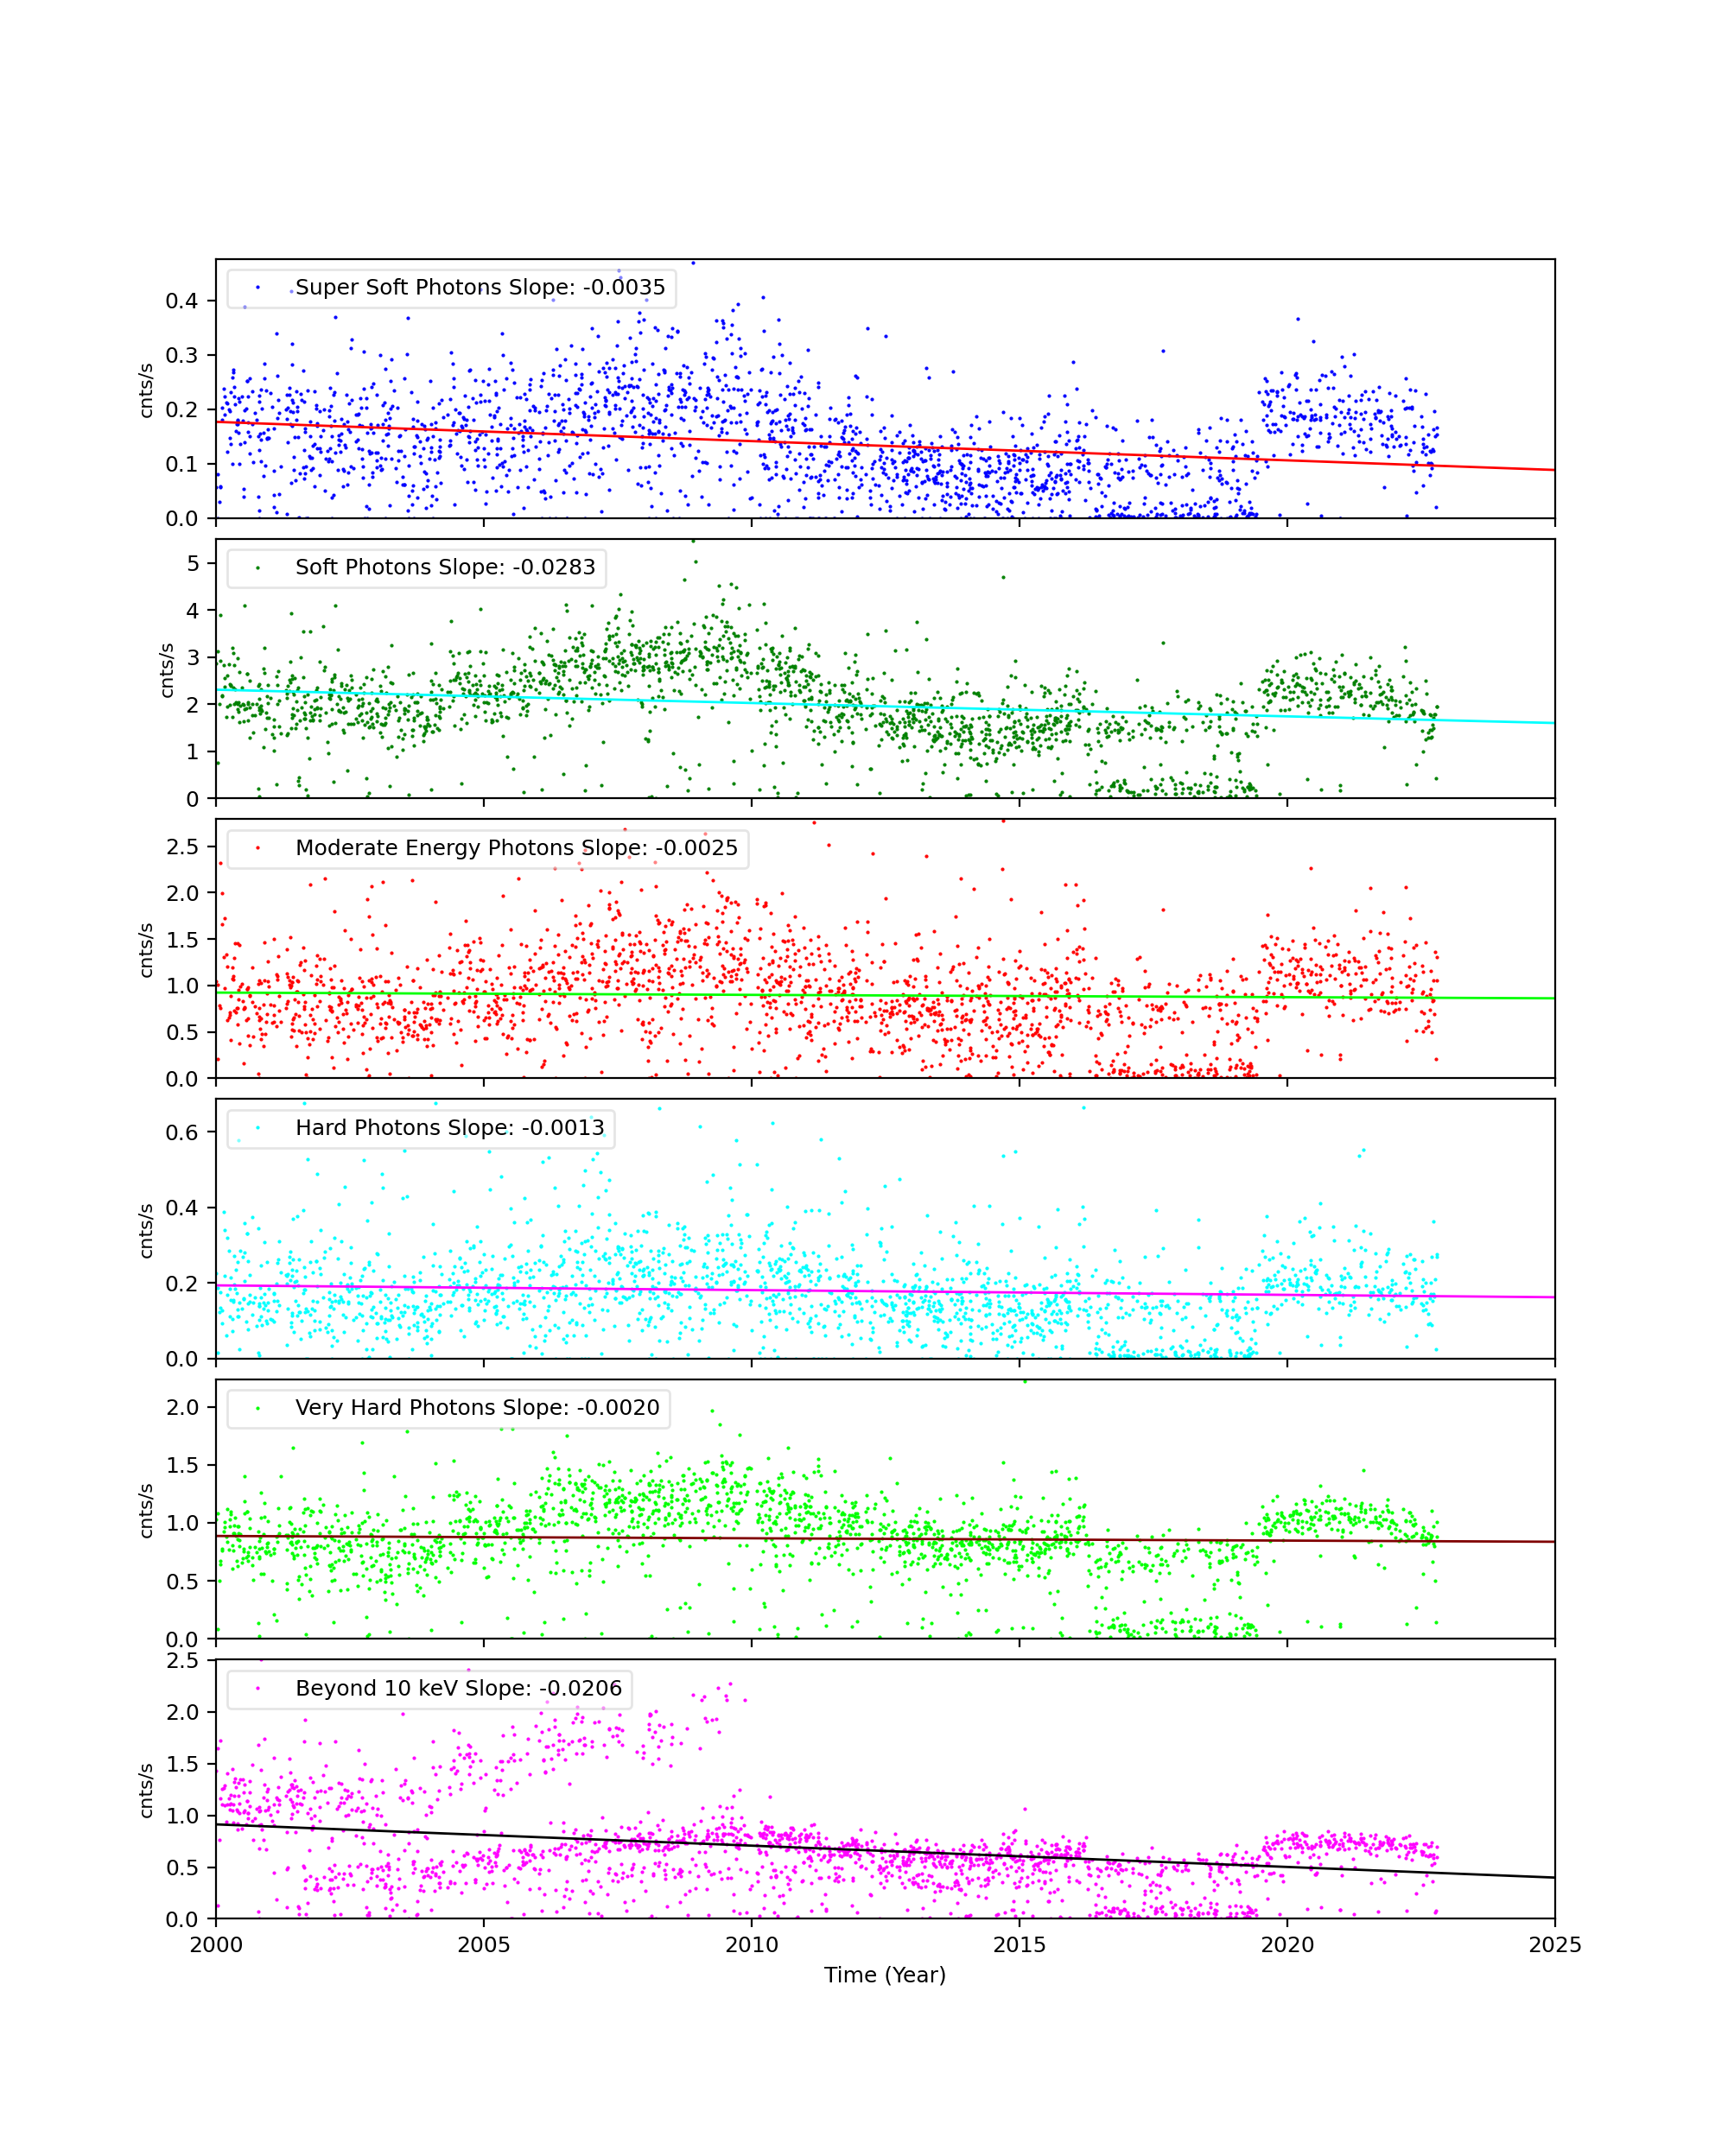
CCD 5
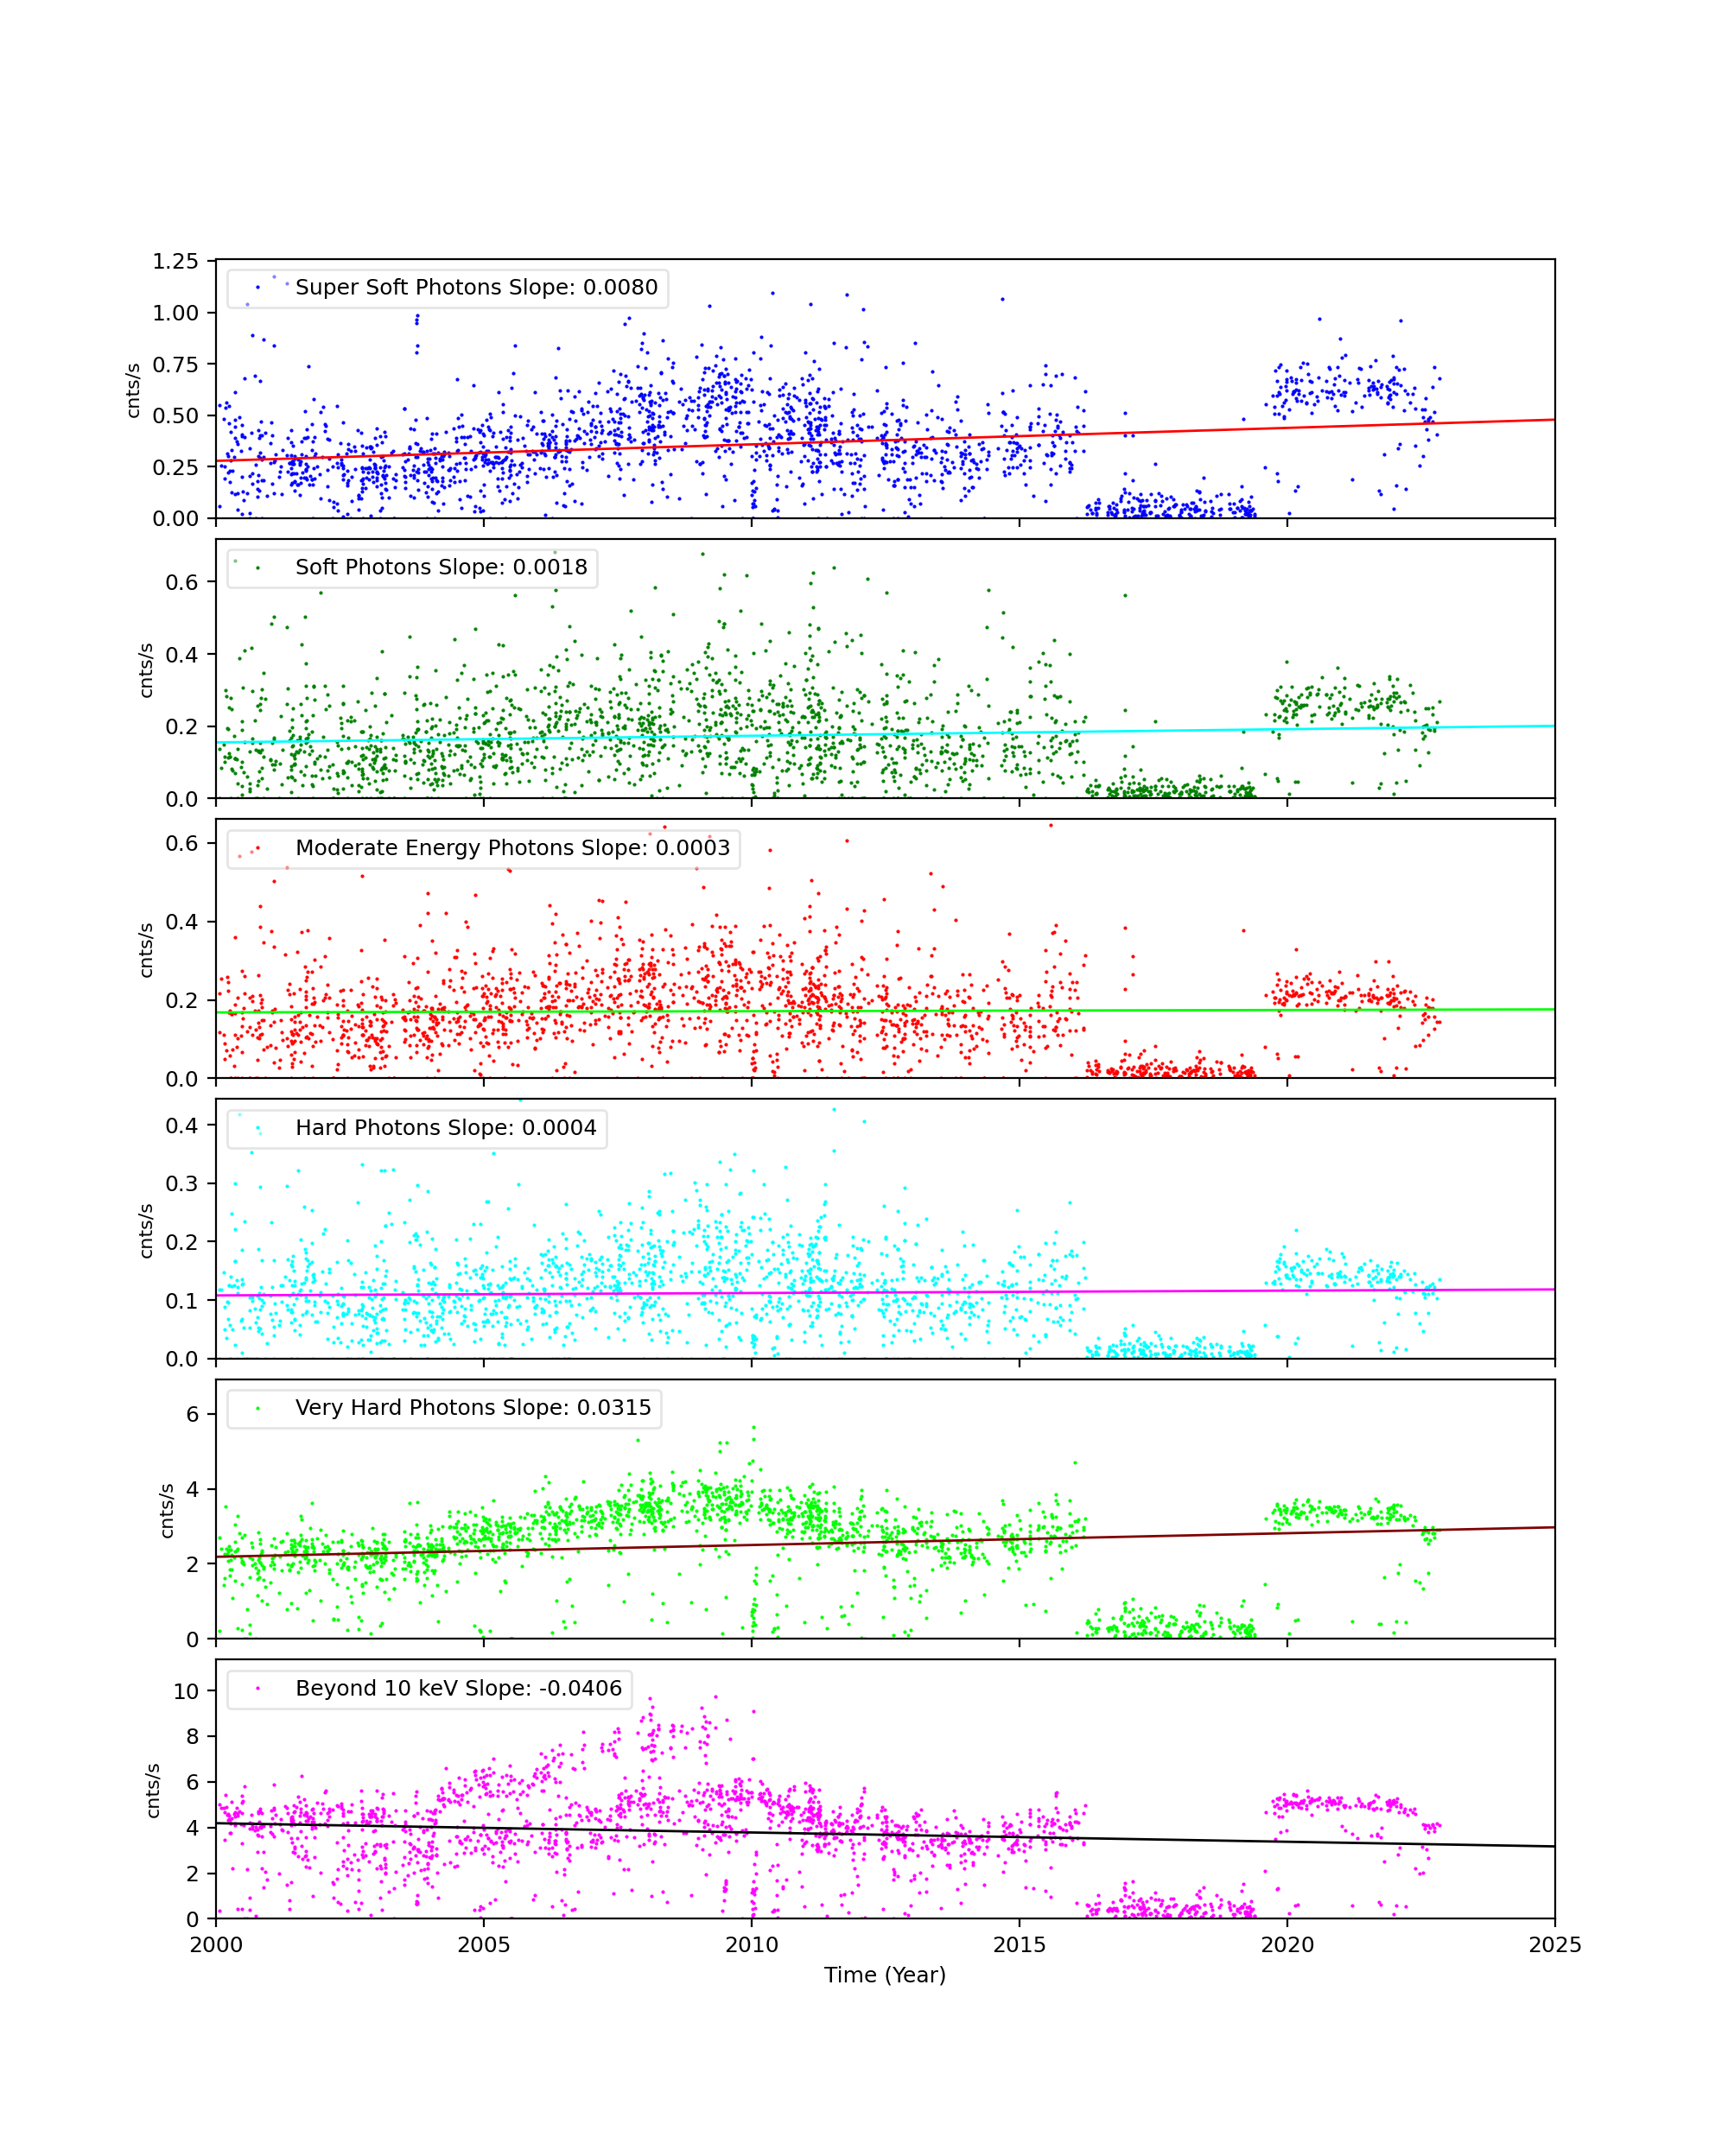
CCD 7
ACIS Histogram Mode Trends
We collected data from acis histogram mode data, and created trend plots of peak portions and peak widths against time (DOM). The peaks were estimated by fitting a simple Gaussian on three peaks (Al, Ti, and Mn), and the widths were estimated by a width at the half max from the peak.
All histogram data are taken under TIMED and GRADED_HIST mode, SIM position is at an external calibration source position, the focal temperature is around -119.7 C, and parameter settings in aciselec, acistemp are set to about same for all.
CCD 3, Peak Position
CCD 3, Peak Widths
CCD 3, Count Rates
HRC
DOSE of Central 4K Pore-Pairs
Please refer to Maximum Dose Trends for more details.
No Data
)
IMAGE                       NPIX      MEAN    STDDEV      MIN       MAX
HRCI_08_1999_11_2022.fits  16777216	na	na	na	na
No Data
)
IMAGE                       NPIX      MEAN    STDDEV      MIN       MAX
HRCS_08_1999_11_2022.fits  16777216	na	na	na	na
|
|
Max dose trend plots corrected for events that "pile-up"
in the center of the taps due to bad position information.
|
)
|
)
|
)
|
)
|
| Aug 2022 | May 2022 | Feb 2022 | Nov 2021 |
|---|
)
|
)
|
)
|
)
|
| Aug 2022 | May 2022 | Feb 2022 | Nov 2021 |
|---|
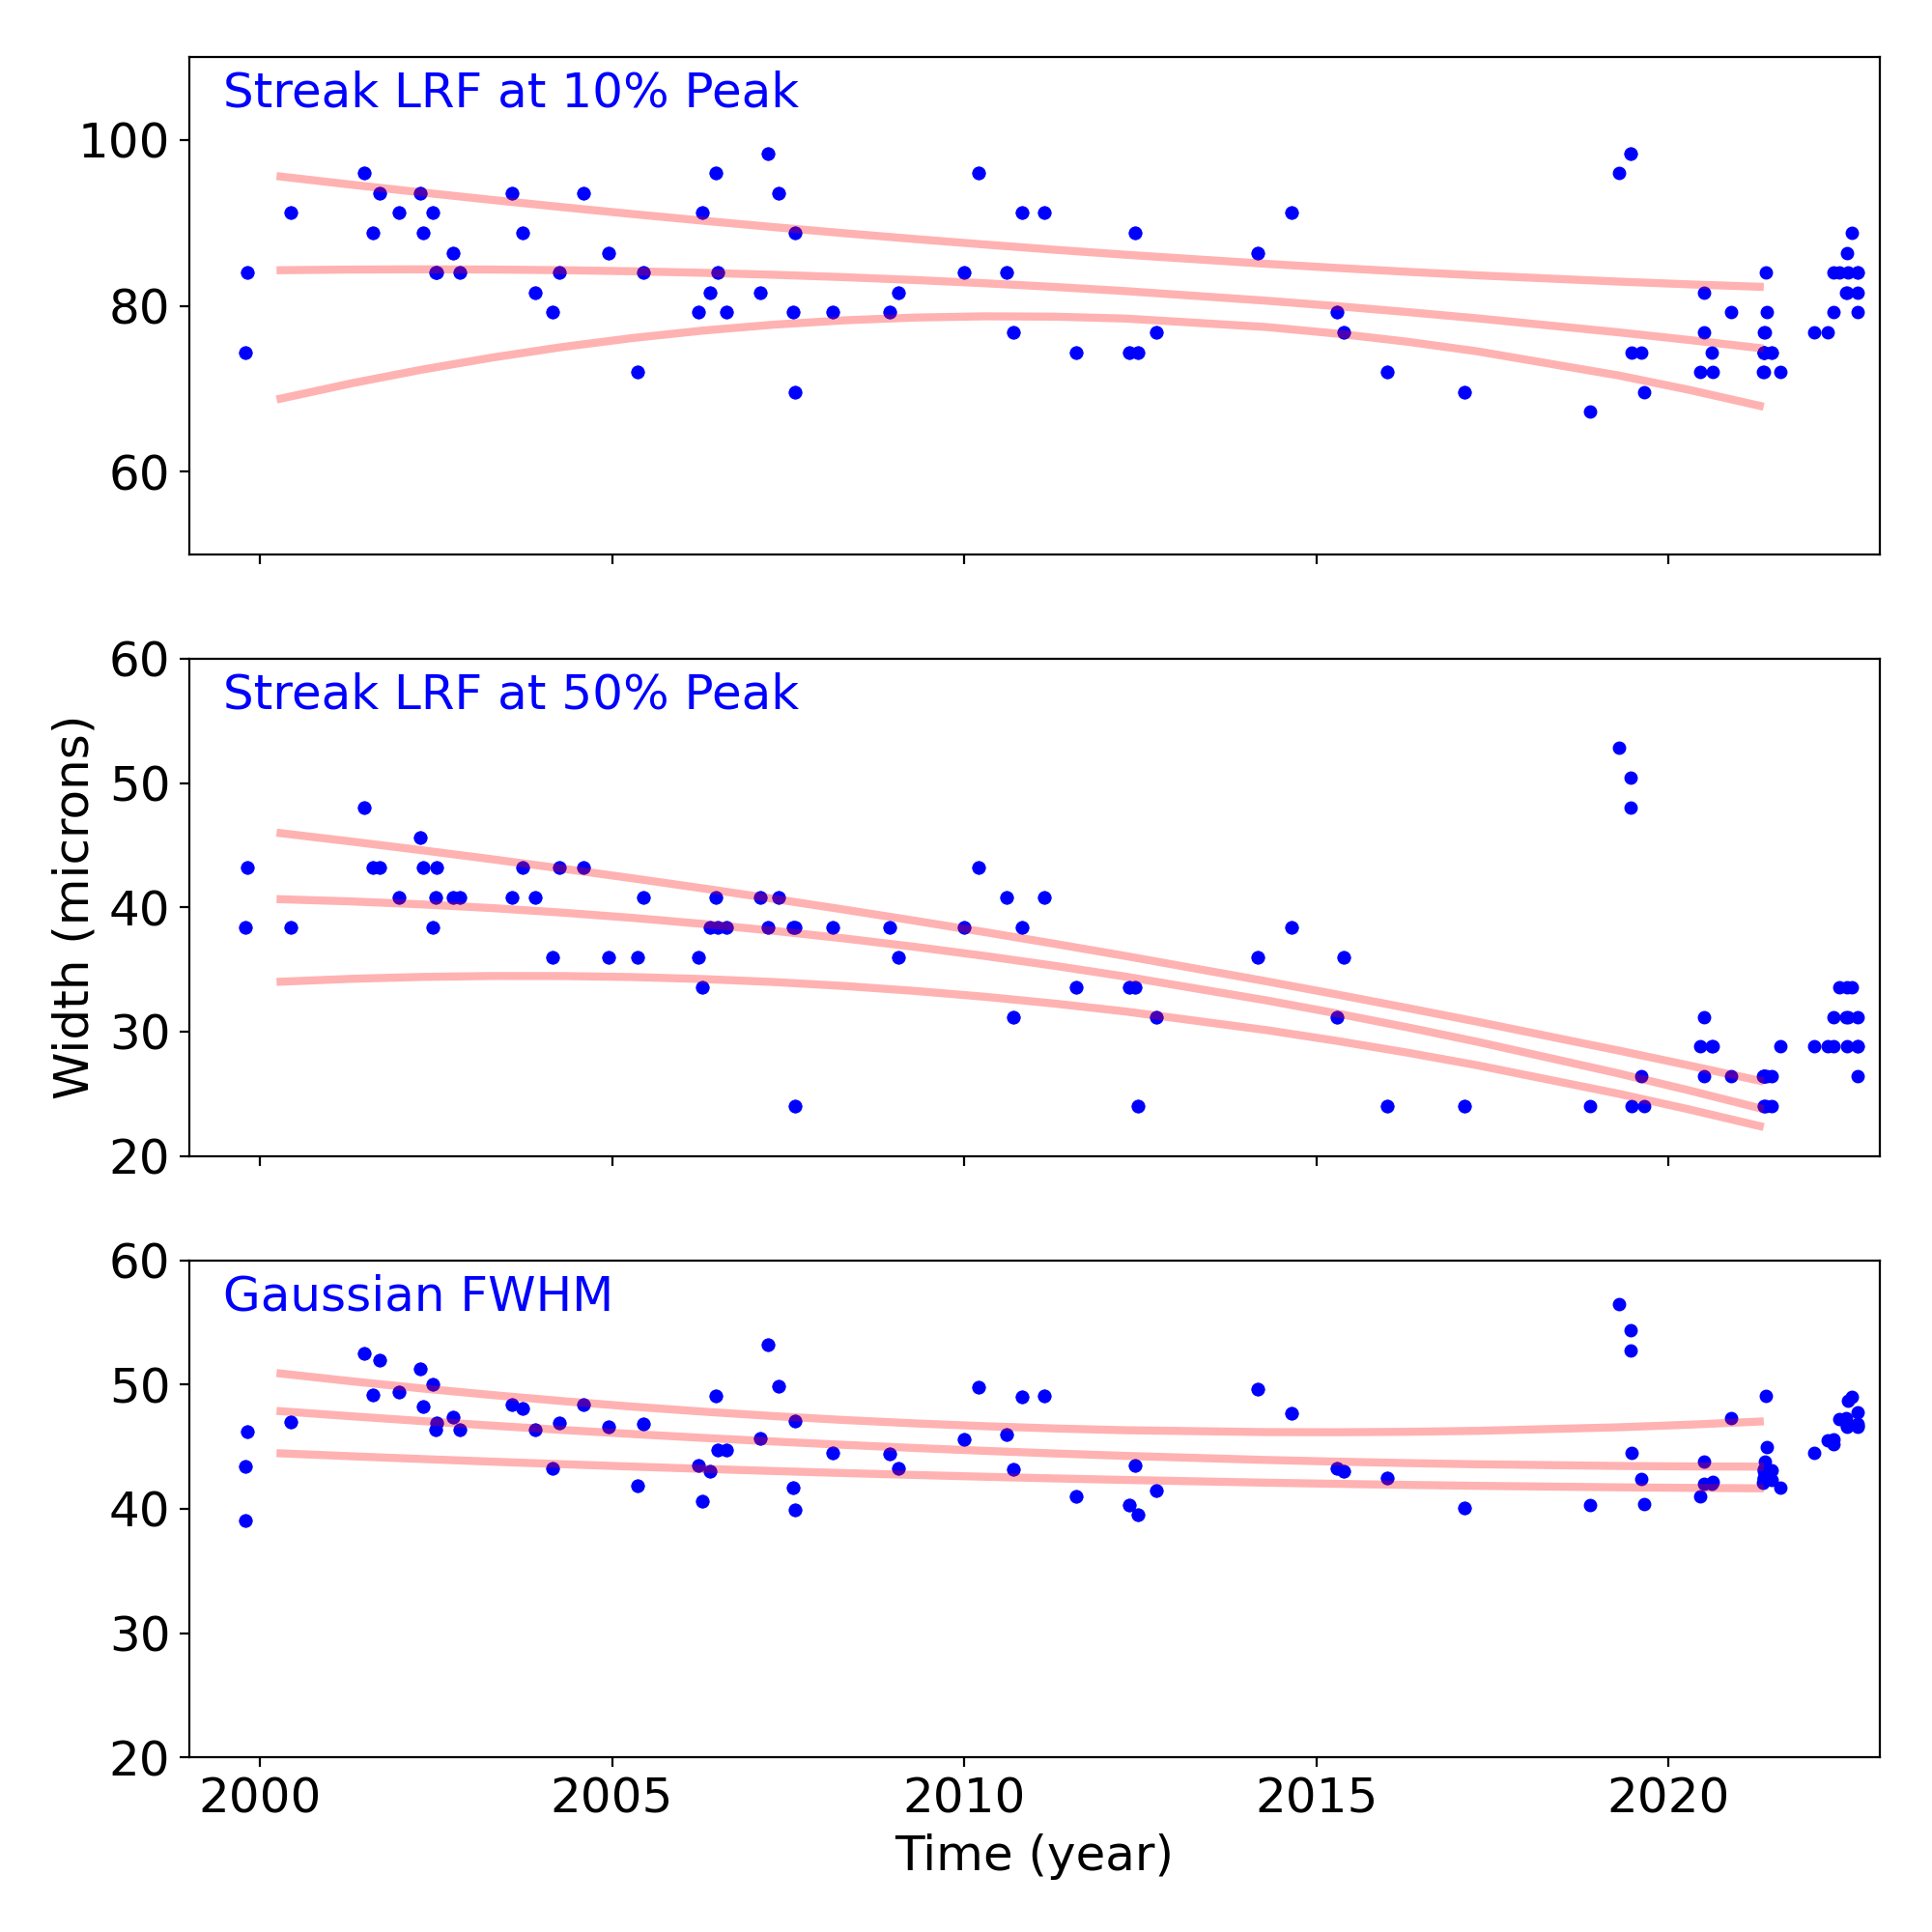
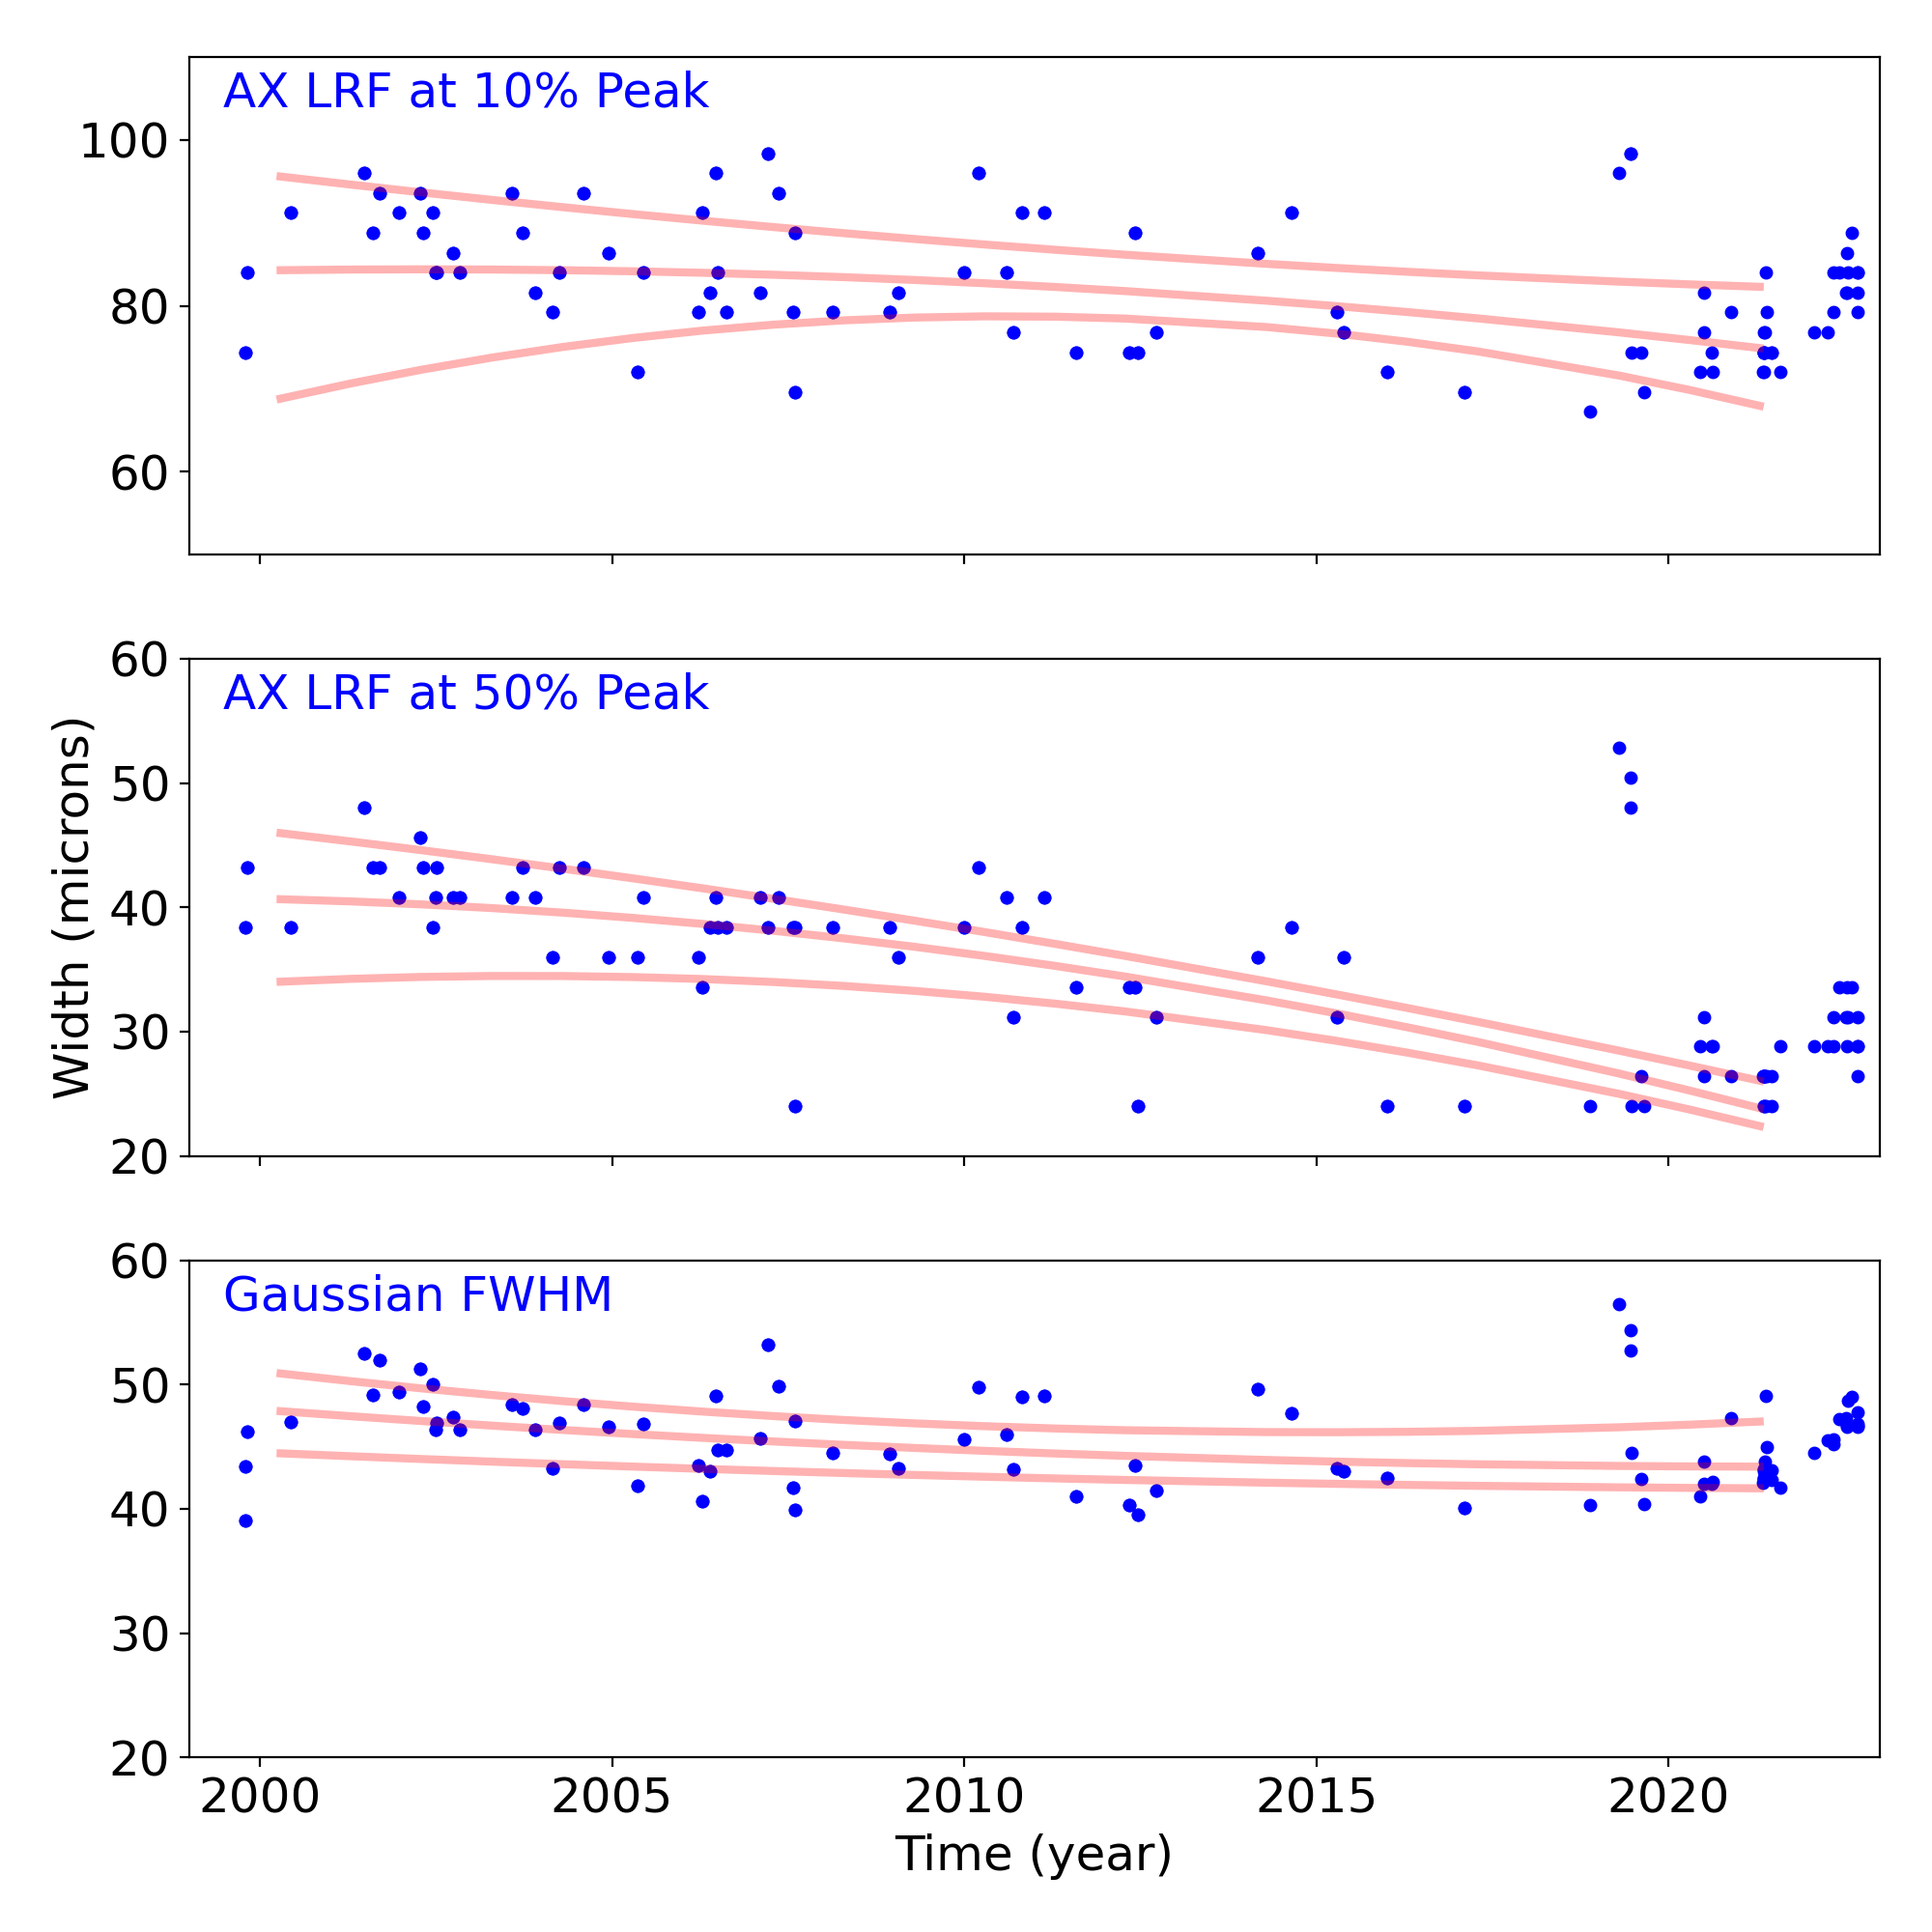
Gratings
Grating Trends/Focus
We plot the width of the zero order streak of ACIS/HETG observations and the width of the zero order image for HRC/LETG observations of point sources. No significant defocusing trend is seen at this time. See Gratings Trends pages.
PCAD
ACA Trending
| ACIS |
)
|
)
|
)
|
|
|---|---|---|---|---|
)
|
)
|
)
| ||
| HRCI |
)
|
)
|
)
|
)
|
| HRCI |
)
|
)
|
)
|
)
|
Gyro Bias Drift

Radiation History
Radiation Count Rates of Nov 2022

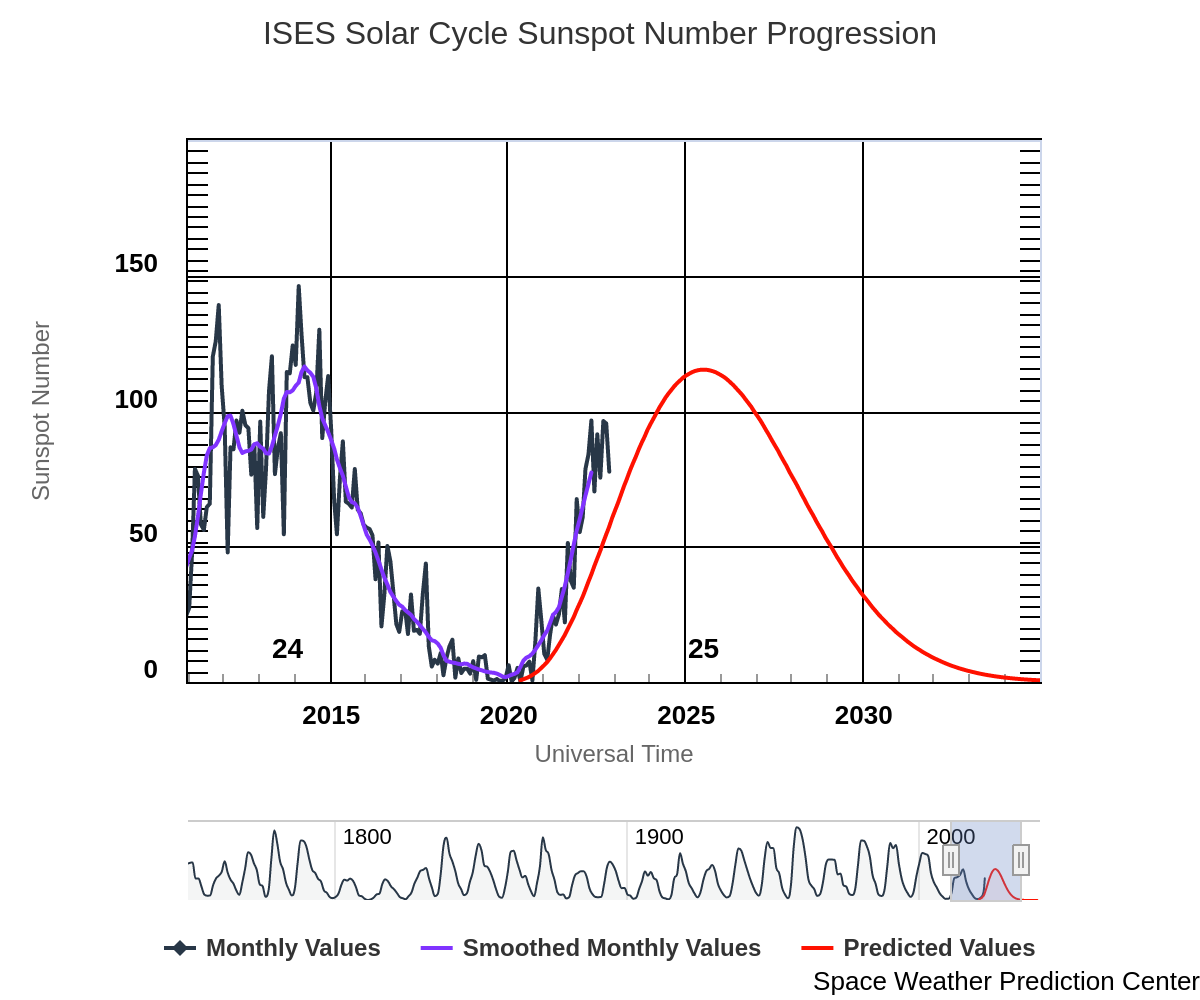
Sun Spot History (See:NOAA Page)
Trending
Quarterly Trends
- HRMA Heater
| Previous Quarter | |||||||
| MSID | MEAN | RMS | DELTA/YR | DELTA/YR/YR | UNITS | DESCRIPTION | |
| ohrthr03 | 2.530e-04 | 4.416e-05 | (2.95+/-0.00)e2 | -0.08 +/- 0.01 | K | RT 5: HRMA FORWARD APERTURE PLATE | |
|---|---|---|---|---|---|---|---|
| ohrthr09 | -1.082e-04 | 1.809e-04 | (2.96+/-0.00)e2 | -0.42 +/- 0.06 | K | RT 105: HRMA CAP | |
| ohrthr17 | -4.468e-04 | 2.277e-04 | (2.96+/-0.01)e2 | -0.52 +/- 0.07 | K | RT 125: HSA OUTER CYNLINDER | |
| ohrthr24 | -1.822e-05 | 3.409e-04 | (2.97+/-0.01)e2 | -0.93 +/- 0.17 | K | RT 12: HRMA AFT HEATER PLATE | |
| ohrthr38 | -2.318e-04 | 8.967e-04 | (3.01+/-0.02)e2 | -1.47 +/- 0.56 | K | RT 120: HRMA AFT COLLIMATOR OUTER CYLINDER | |
| ohrthr52 | -2.789e-04 | 1.885e-04 | (2.96+/-0.00)e2 | -0.44 +/- 0.07 | K | RT 100: HRMA CAP | |
- HRMA Thermal
| Previous Quarter | |||||||
| MSID | MEAN | RMS | DELTA/YR | DELTA/YR/YR | UNITS | DESCRIPTION | |
| 4rt568t | 7.219e-04 | 9.624e-04 | (3.00+/-0.02)e2 | -1.95 +/- 0.61 | K | RT 568 - HRMA TEMP | |
|---|---|---|---|---|---|---|---|
| 4rt569t | 2.187e-04 | 3.028e-04 | (2.97+/-0.01)e2 | -0.82 +/- 0.14 | K | RT 569 - HRMA TEMP | |
| 4rt570t | -6.076e-06 | 1.661e-04 | (2.96+/-0.00)e2 | -0.34 +/- 0.07 | K | RT 570 - HRMA TEMP | |
| 4rt575t | 7.980e-04 | 0.001 | (3.05+/-0.03)e2 | -1.77 +/- 0.76 | K | RT 575 - OB CONE TEMP | |
| 4rt576t | -0.002 | 9.671e-04 | (2.96+/-0.02)e2 | -2.05 +/- 0.61 | K | RT 576 - OB CONE TEMP | |
| 4rt578t | 0.006 | 0.002 | (3.03+/-0.04)e2 | -3.57 +/- 0.99 | K | RT 578 - OB CONE TEMP | |
- MUPS
| Previous Quarter | |||||||
| MSID | MEAN | RMS | DELTA/YR | DELTA/YR/YR | UNITS | DESCRIPTION | |
| pm1thv1t | 0.036 | 0.006 | (3.54+/-0.13)e2 | -1.80 +/- 2.49 | K | MUPS 1 THRUSTER VALVE 01 TEMP | |
|---|---|---|---|---|---|---|---|
| pline02t | 0.043 | 0.005 | (3.37+/-0.12)e2 | -1.84 +/- 2.77 | K | PROP LINE TEMP 02 | |
| pline03t | 0.042 | 0.006 | (3.32+/-0.14)e2 | -0.32 +/- 2.78 | K | PROP LINE TEMP 03 | |
| pline04t | 0.043 | 0.005 | (3.19+/-0.11)e2 | -7.90 +/- 2.97 | K | PROP LINE TEMP 04 | |
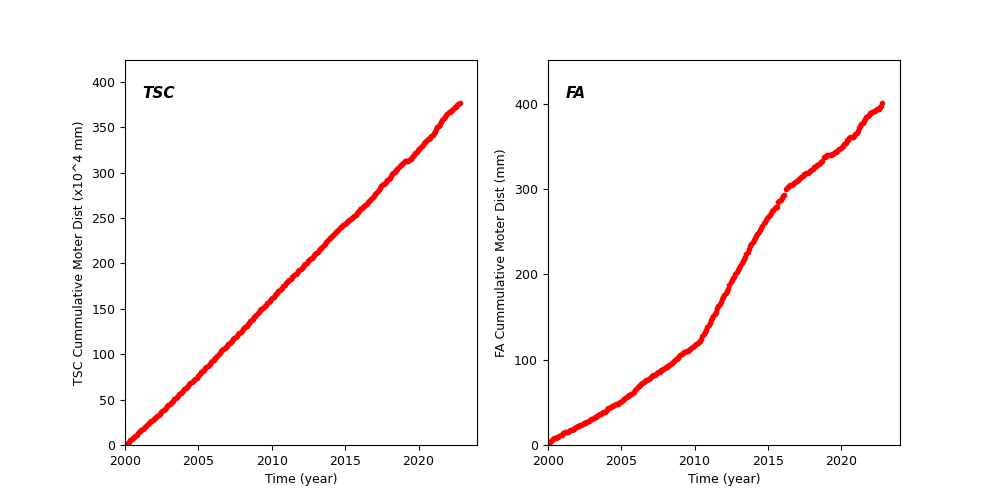
Spacecraft Motions
TSC and FA Cummulative Moter Distance
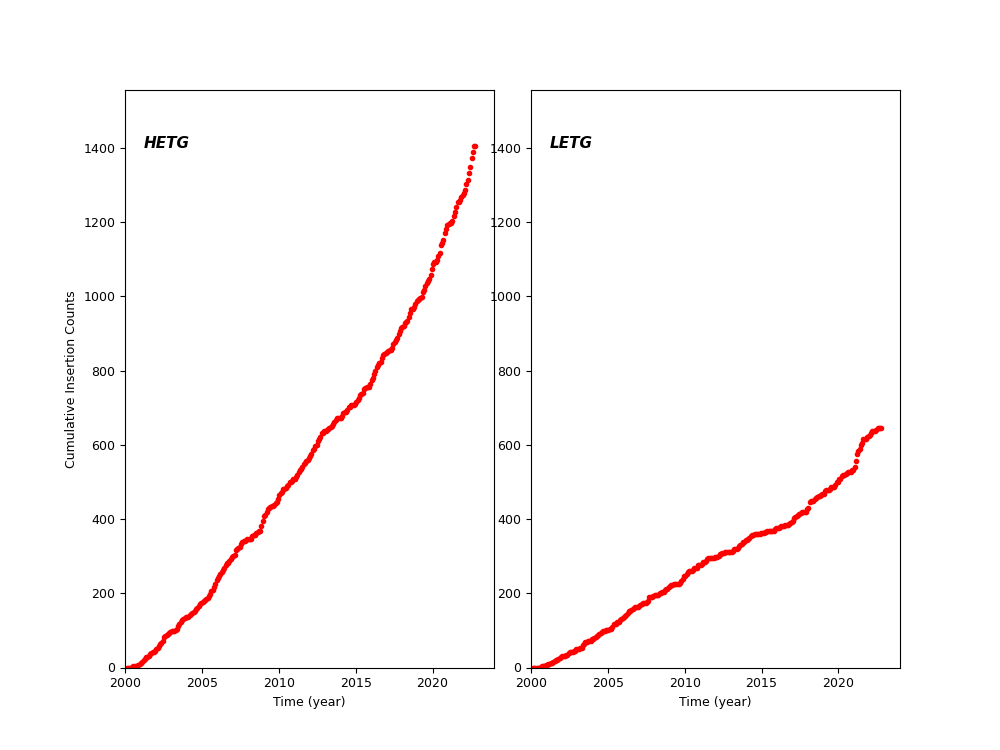
HETG and LETG Cummulative Insertion Counts
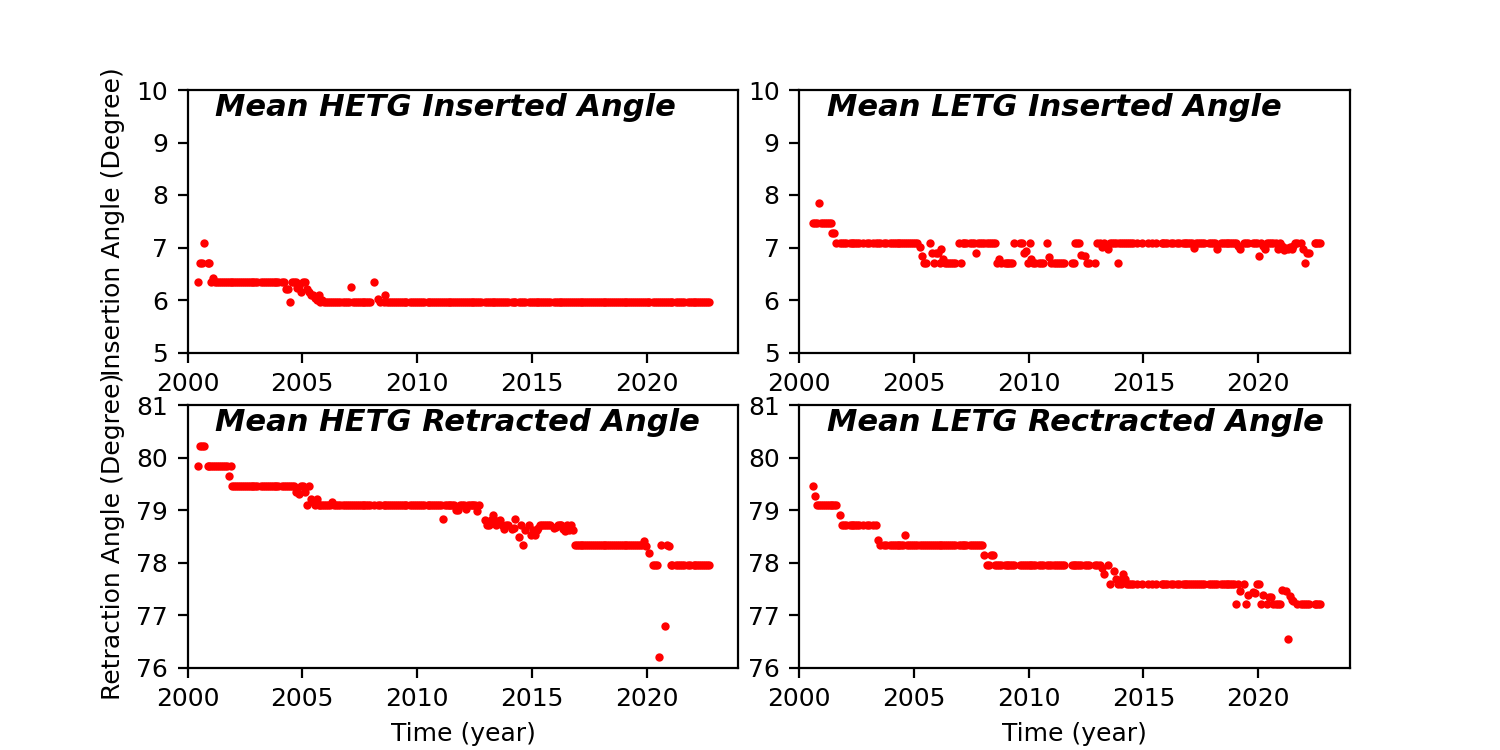
HETG/LETG Insertion/Retraction Angle
Reaction Wheel Rotations