ACIS
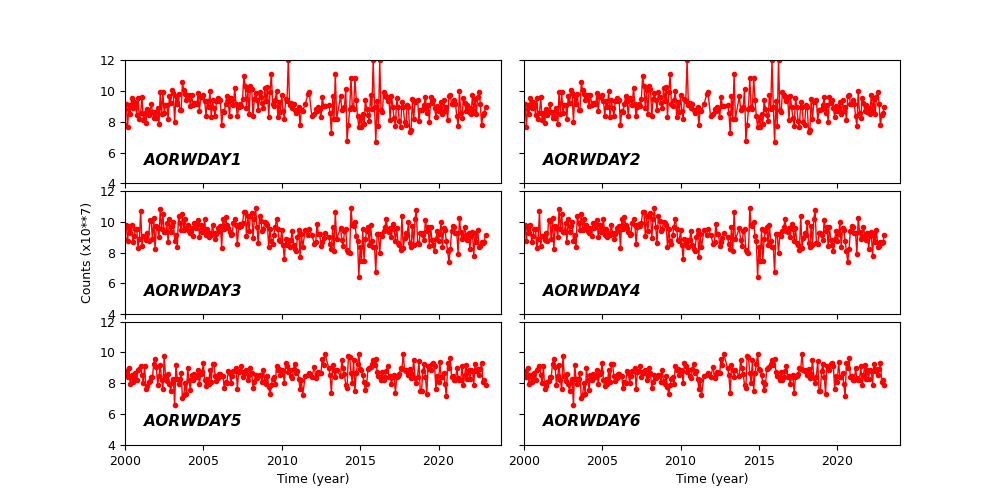
ACIS DOSE Registered-Photon-Map
The steps we took to compute the dose map are;
- Level 1 Event files for a specified month are obtained from archive.
- Image data including I2, I3, S2, S3 CCDs are extracted from all event files.
- All the extracted image data were merged to create a month long exposure map for the month.
- The exposure map is opened with ds9, and check a distribution of count rates against energy. From this, estimate the upper threshold value. Any events beyond this upper threshold are assumed erroneous events such as bad pixels.
- Using this upper threshold, the data is filtered, and create a cleaned exposure map for the month.
- The exposure map from each month from the Sep 1999 is added up to create a cumulative exposure map for each month.
- Using fimgstatistic, we compute count rate statistics for each CCDs.
- For observations with high data drop rates (e.g., Crab nebula, Cas A), we corrected the observations by adding events.
Please check more detail plots at Telemetered Photon Dose Trend page.
)
)
)
Statistics:
# IMAGE     NPIX     MEAN        RMS        MIN     MAX
ACIS_dec22 6004901       7.138         9.270           0.0     3278


I2 node 0  262654	5.748150	2.848402	0.0	 67.0
I2 node 1  262654	6.042105	3.037302	0.0	236.0
I2 node 2  262654	5.943696	2.889446	0.0	103.0
I2 node 3  262654	5.955309	7.984651	0.0	3004.0

I3 node 0  262654	8.166678	4.429669	0.0	1483.0
I3 node 1  262654	10.335383	6.253124	0.0	2522.0
I3 node 2  262654	9.438838	3.917827	0.0	104.0
I3 node 3  262654	6.903051	7.353573	0.0	3278.0

S2 node 0  262654	9.447760	6.398137	0.0	2174.0
S2 node 1  262654	10.259462	4.729515	0.0	434.0
S2 node 2  262654	9.585838	8.108628	0.0	3173.0
S2 node 3  262654	8.991915	4.691038	0.0	819.0

S3 node 0  262654	13.618045	10.370742	0.0	 93.0
S3 node 1  262654	16.883010	9.853503	0.0	1164.0
S3 node 2  262654	16.970535	11.975177	0.0	 96.0
S3 node 3  262654	10.785053	3.751009	0.0	 51.0
)
)
)
Statistics:
 IMAGE     NPIX      MEAN        RMS           MIN      MAX
ACIS_total   6004901       2613.243         3339.784           0.0   143332


I2 node 0  262654	2271.740609	458.284020	485.0	14028.0
I2 node 1  262654	2391.881647	654.788743	500.0	138606.0
I2 node 2  262654	2420.563780	512.228720	523.0	14793.0
I2 node 3  262654	2425.084455	625.634337	487.0	29059.0

I3 node 0  262654	2607.733537	639.824660	486.0	14104.0
I3 node 1  262654	2691.112991	1742.349505	513.0	55902.0
I3 node 2  262654	2403.862307	448.253953	483.0	14383.0
I3 node 3  262654	2385.106184	482.637629	454.0	35160.0

S2 node 0  262654	3043.251766	494.137224	1647.0	22440.0
S2 node 1  262654	3227.337776	733.803446	1833.0	17422.0
S2 node 2  262654	3569.228987	734.242008	2246.0	30896.0
S2 node 3  262654	3529.771498	589.762079	1982.0	75219.0

S3 node 0  262654	5403.278611	2949.425236	2373.0	54426.0
S3 node 1  262654	6612.633754	2370.970262	0.0	50564.0
S3 node 2  262654	5344.441456	1349.373386	2462.0	27339.0
S3 node 3  262654	4187.556781	761.462045	2528.0	26516.0
)
|
)
|
)
|
)
|
| Sep 2022 | Jun 2022 | Mar 2022 | Dec 2021 |
|---|
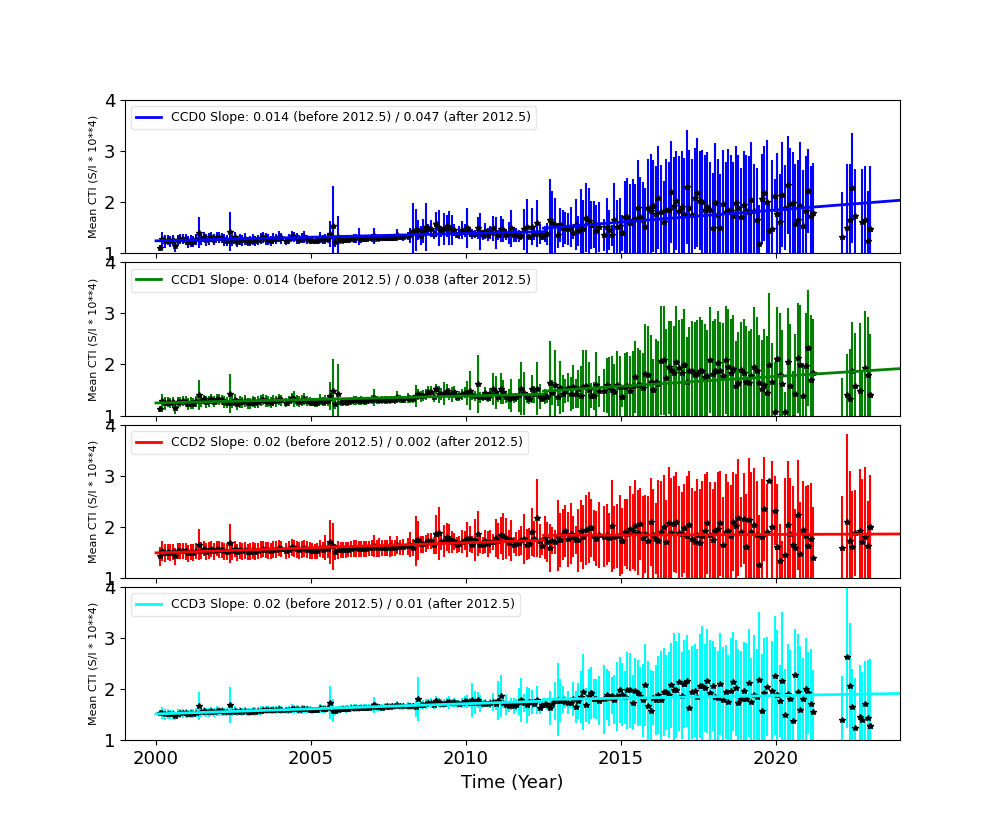
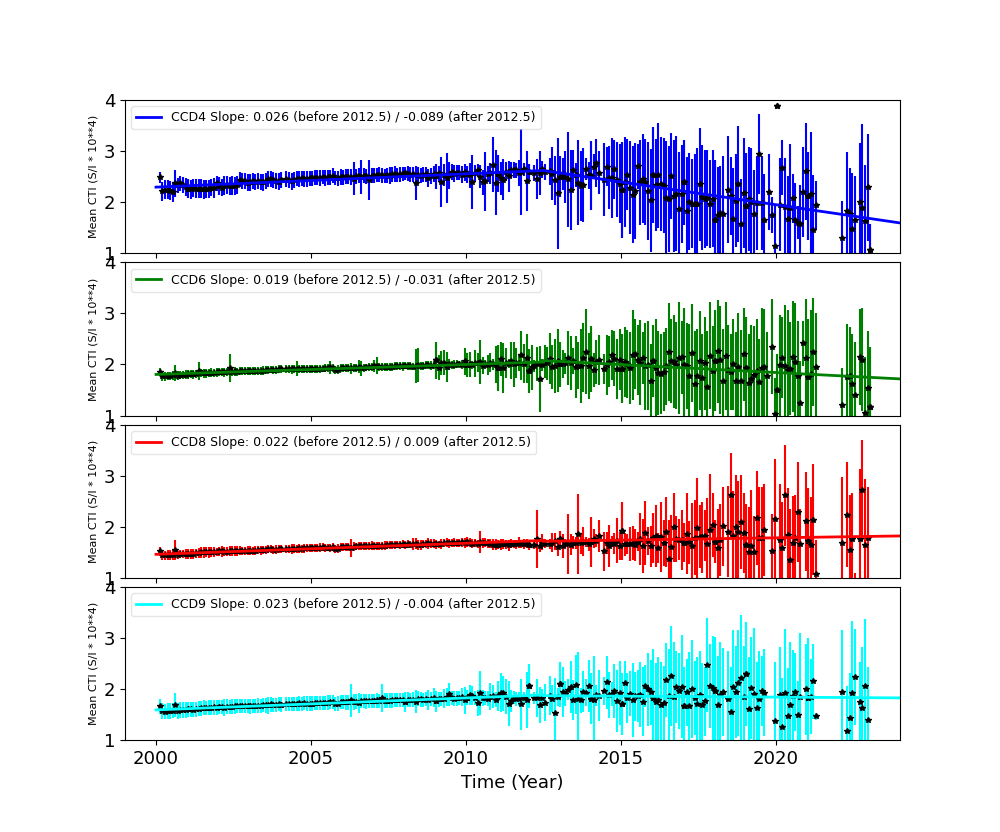
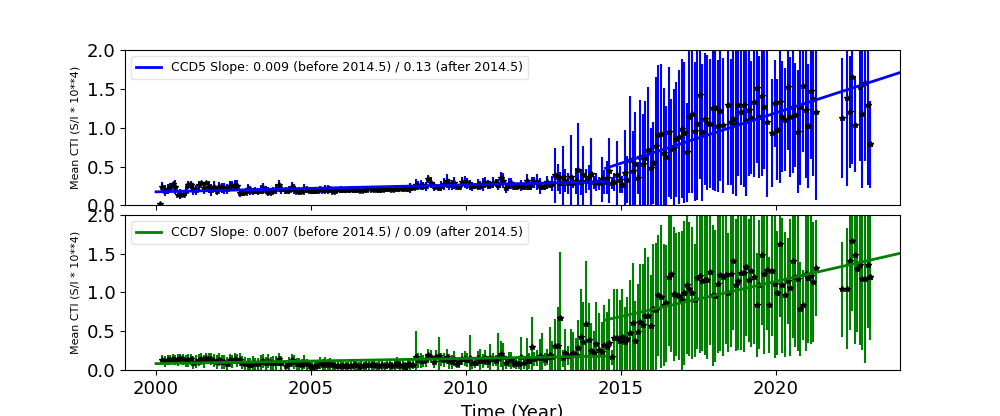
The Mean Detrended CTI
We report CTIs with a refined data definition. CTIs were computed for the temperature dependency corrected data. Please see CTI page for detailed explanation. CTI's are computed for Mn K alpha, and defined as slope/intercept x10^4 of row # vs ADU. Data file: here
Imaging CCDs
Spectral CCDs
Backside CCDs
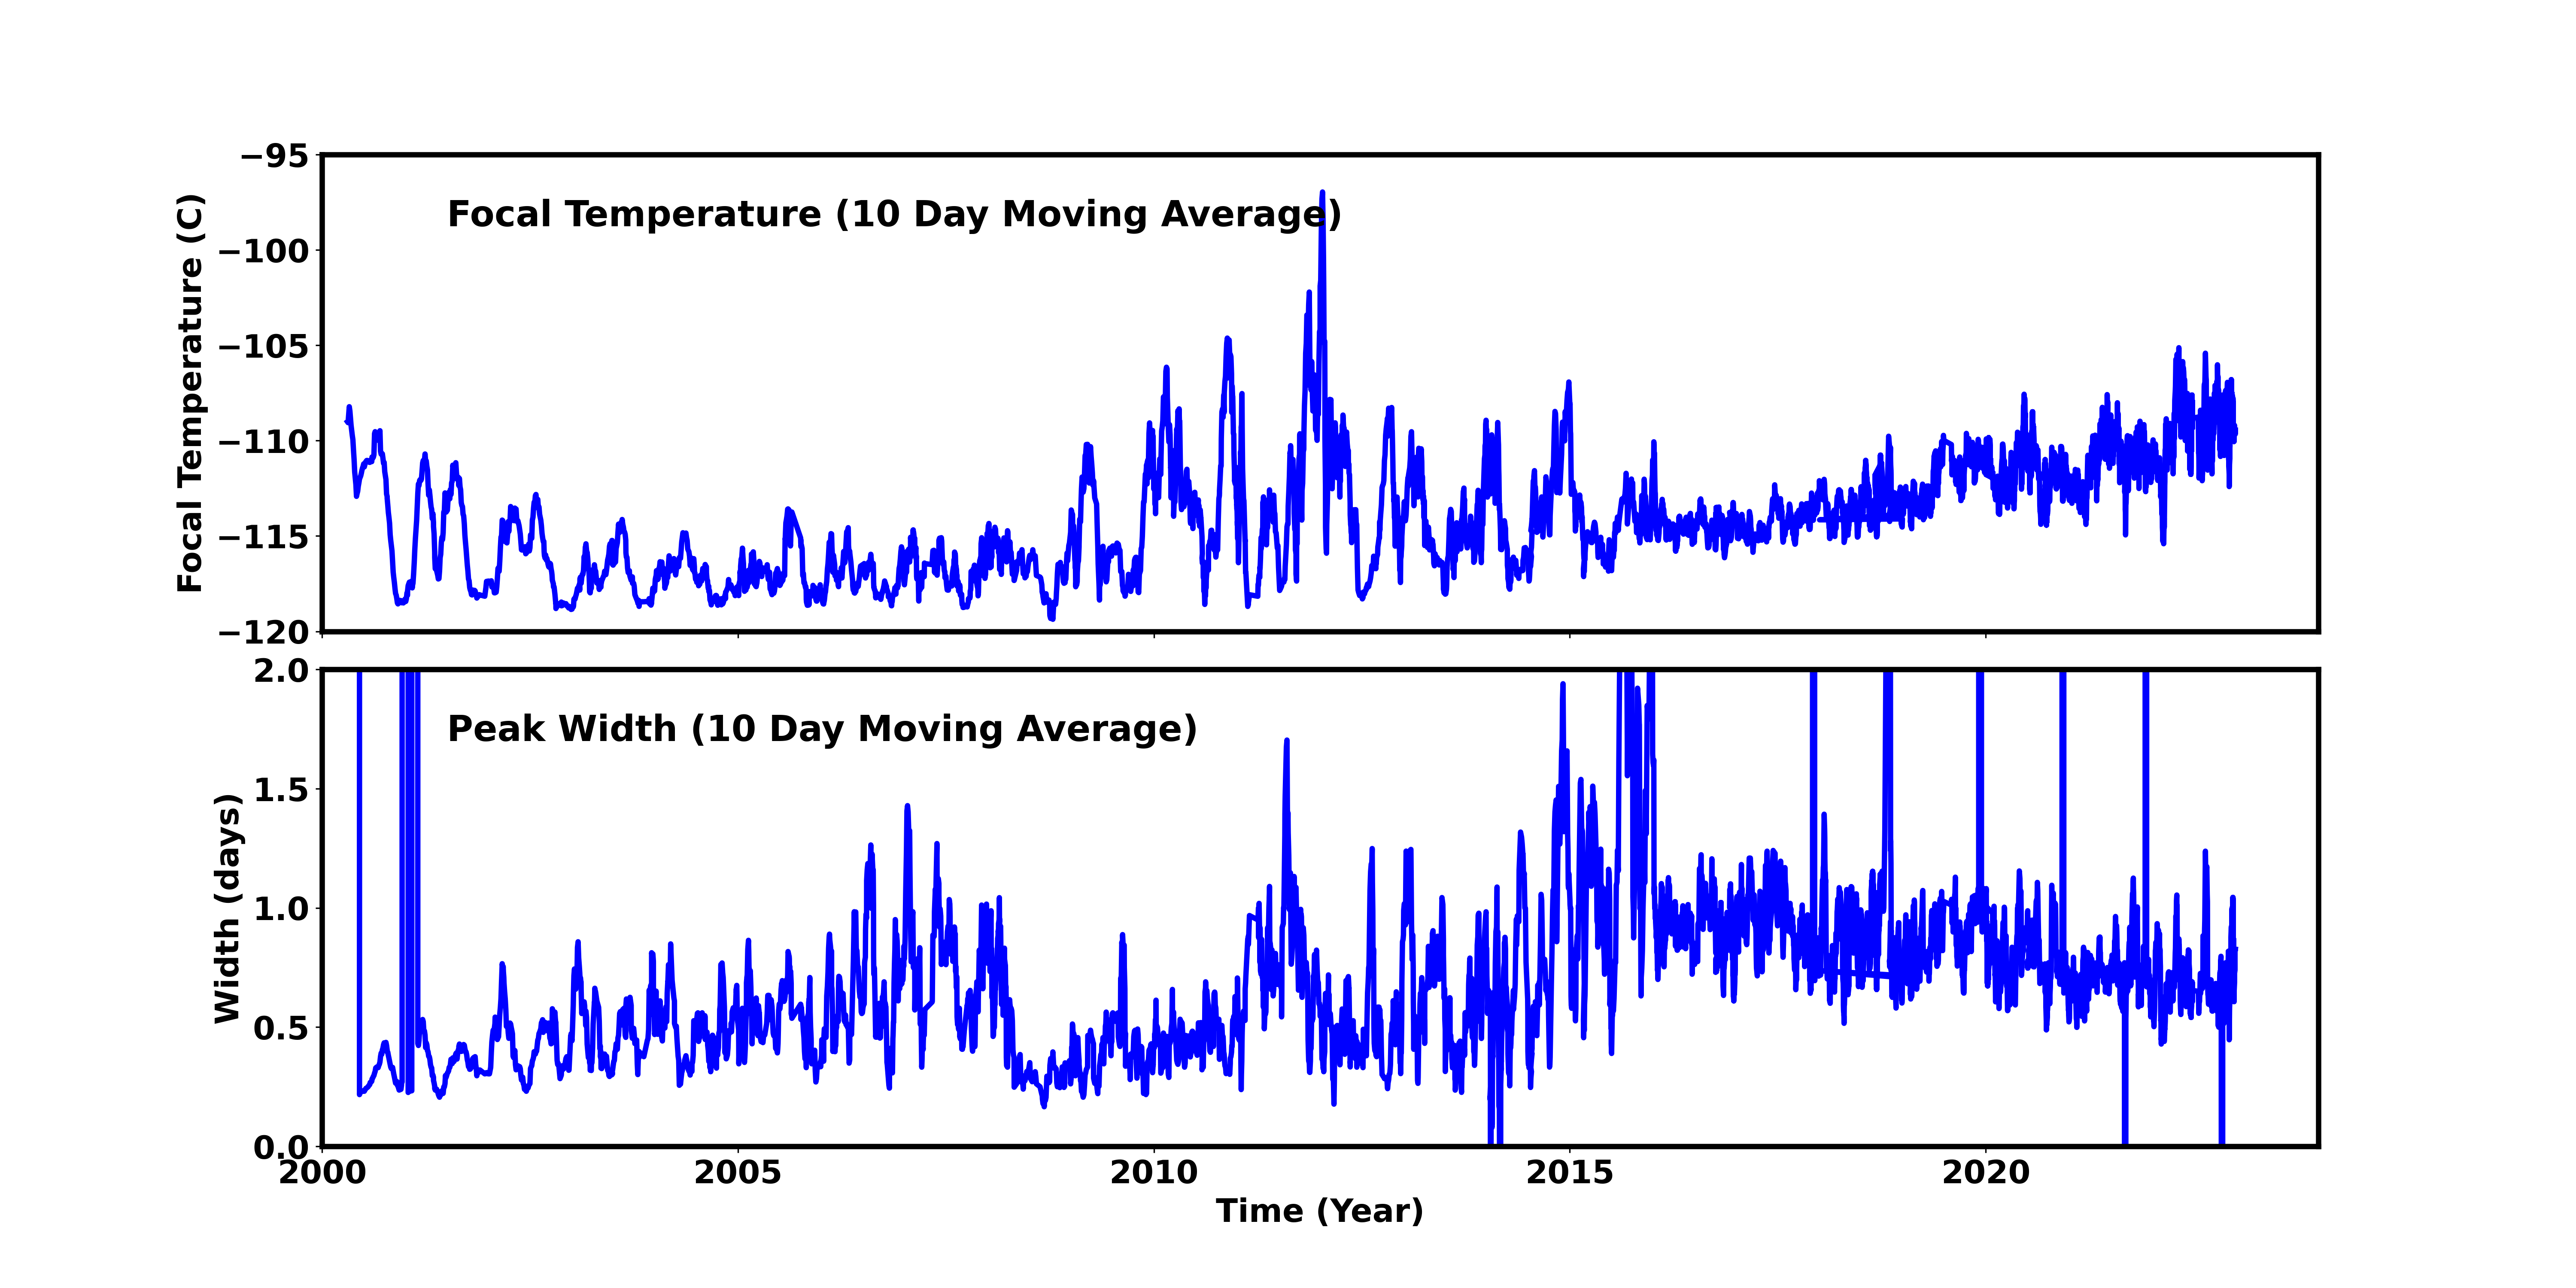
Focal Plane Temperature
Dec 2022 Focal Temperature
| The Mean (max) FPT: | |
|---|---|
| -109.35 | +/- 3.84 C |
| Mean Width: | |
| 0.78 | +/- 0.48 days |
Averaged Focal Plane Temperature
We are using 10 period moving averages to show trends of peak temperatures and peak widths. Note, the gaps in the width plot are due to missing/corrupted data.
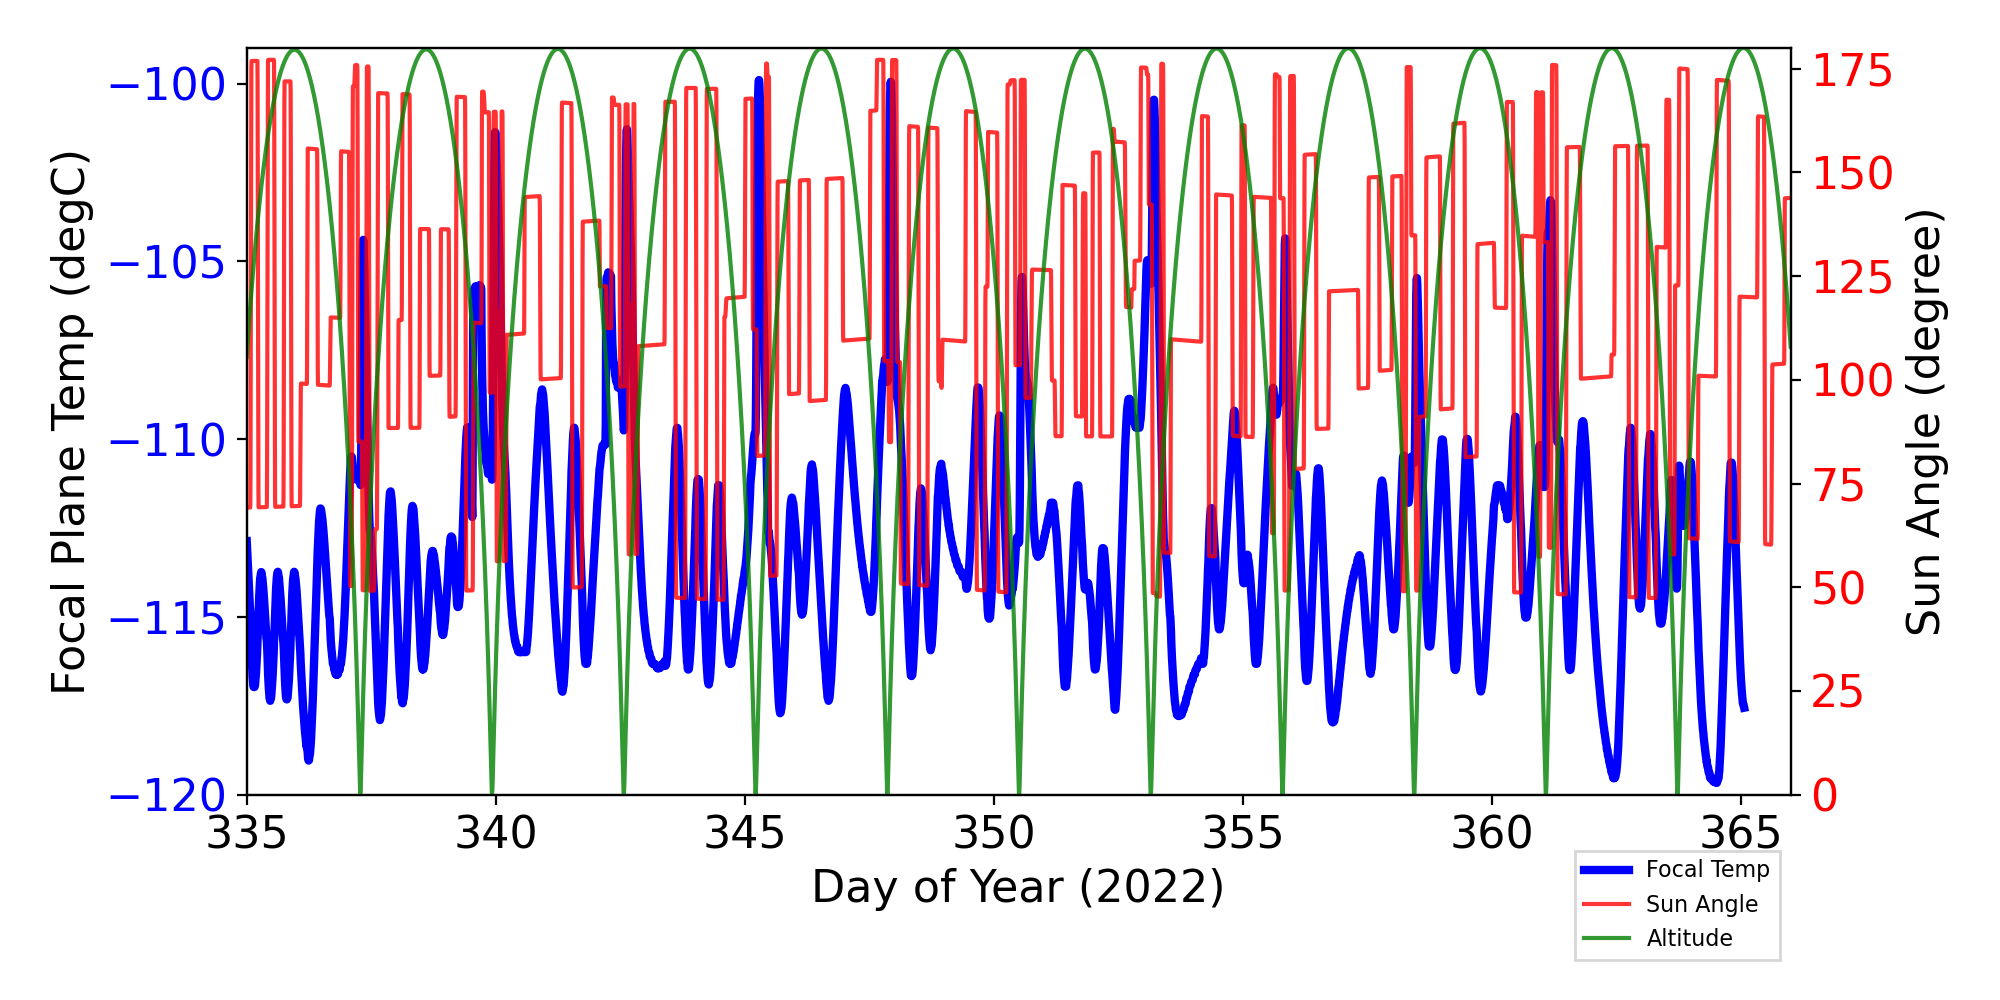
Focal Plane Temperature, Sun Angle and Altitude
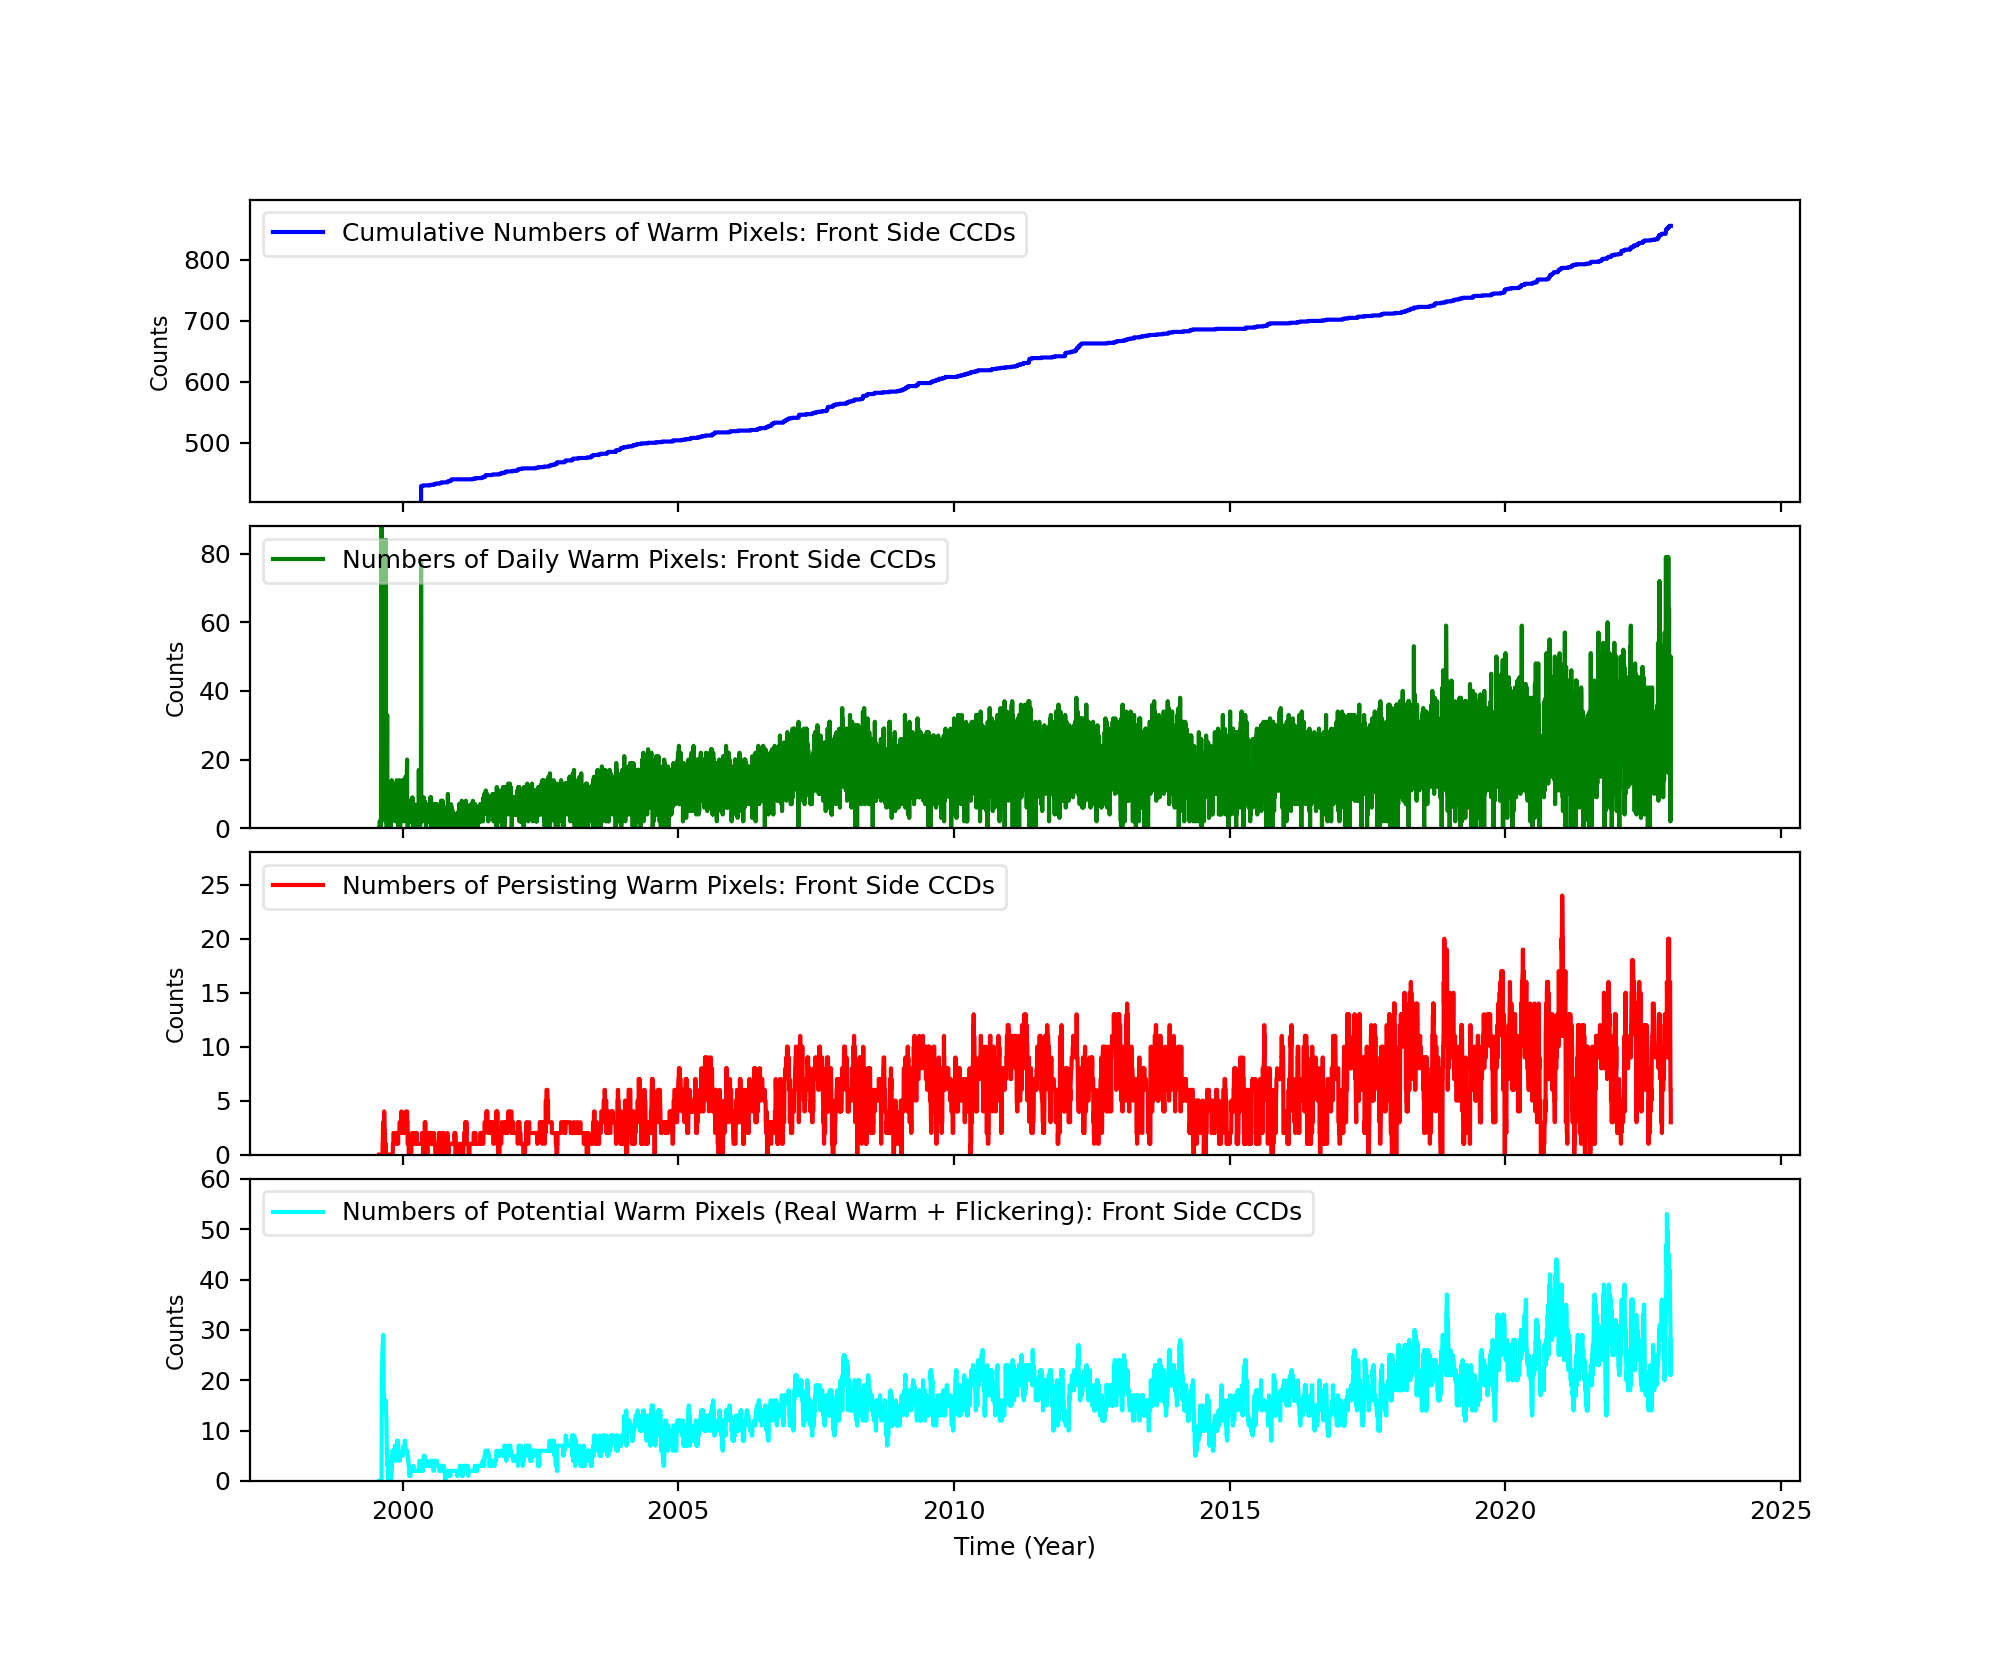
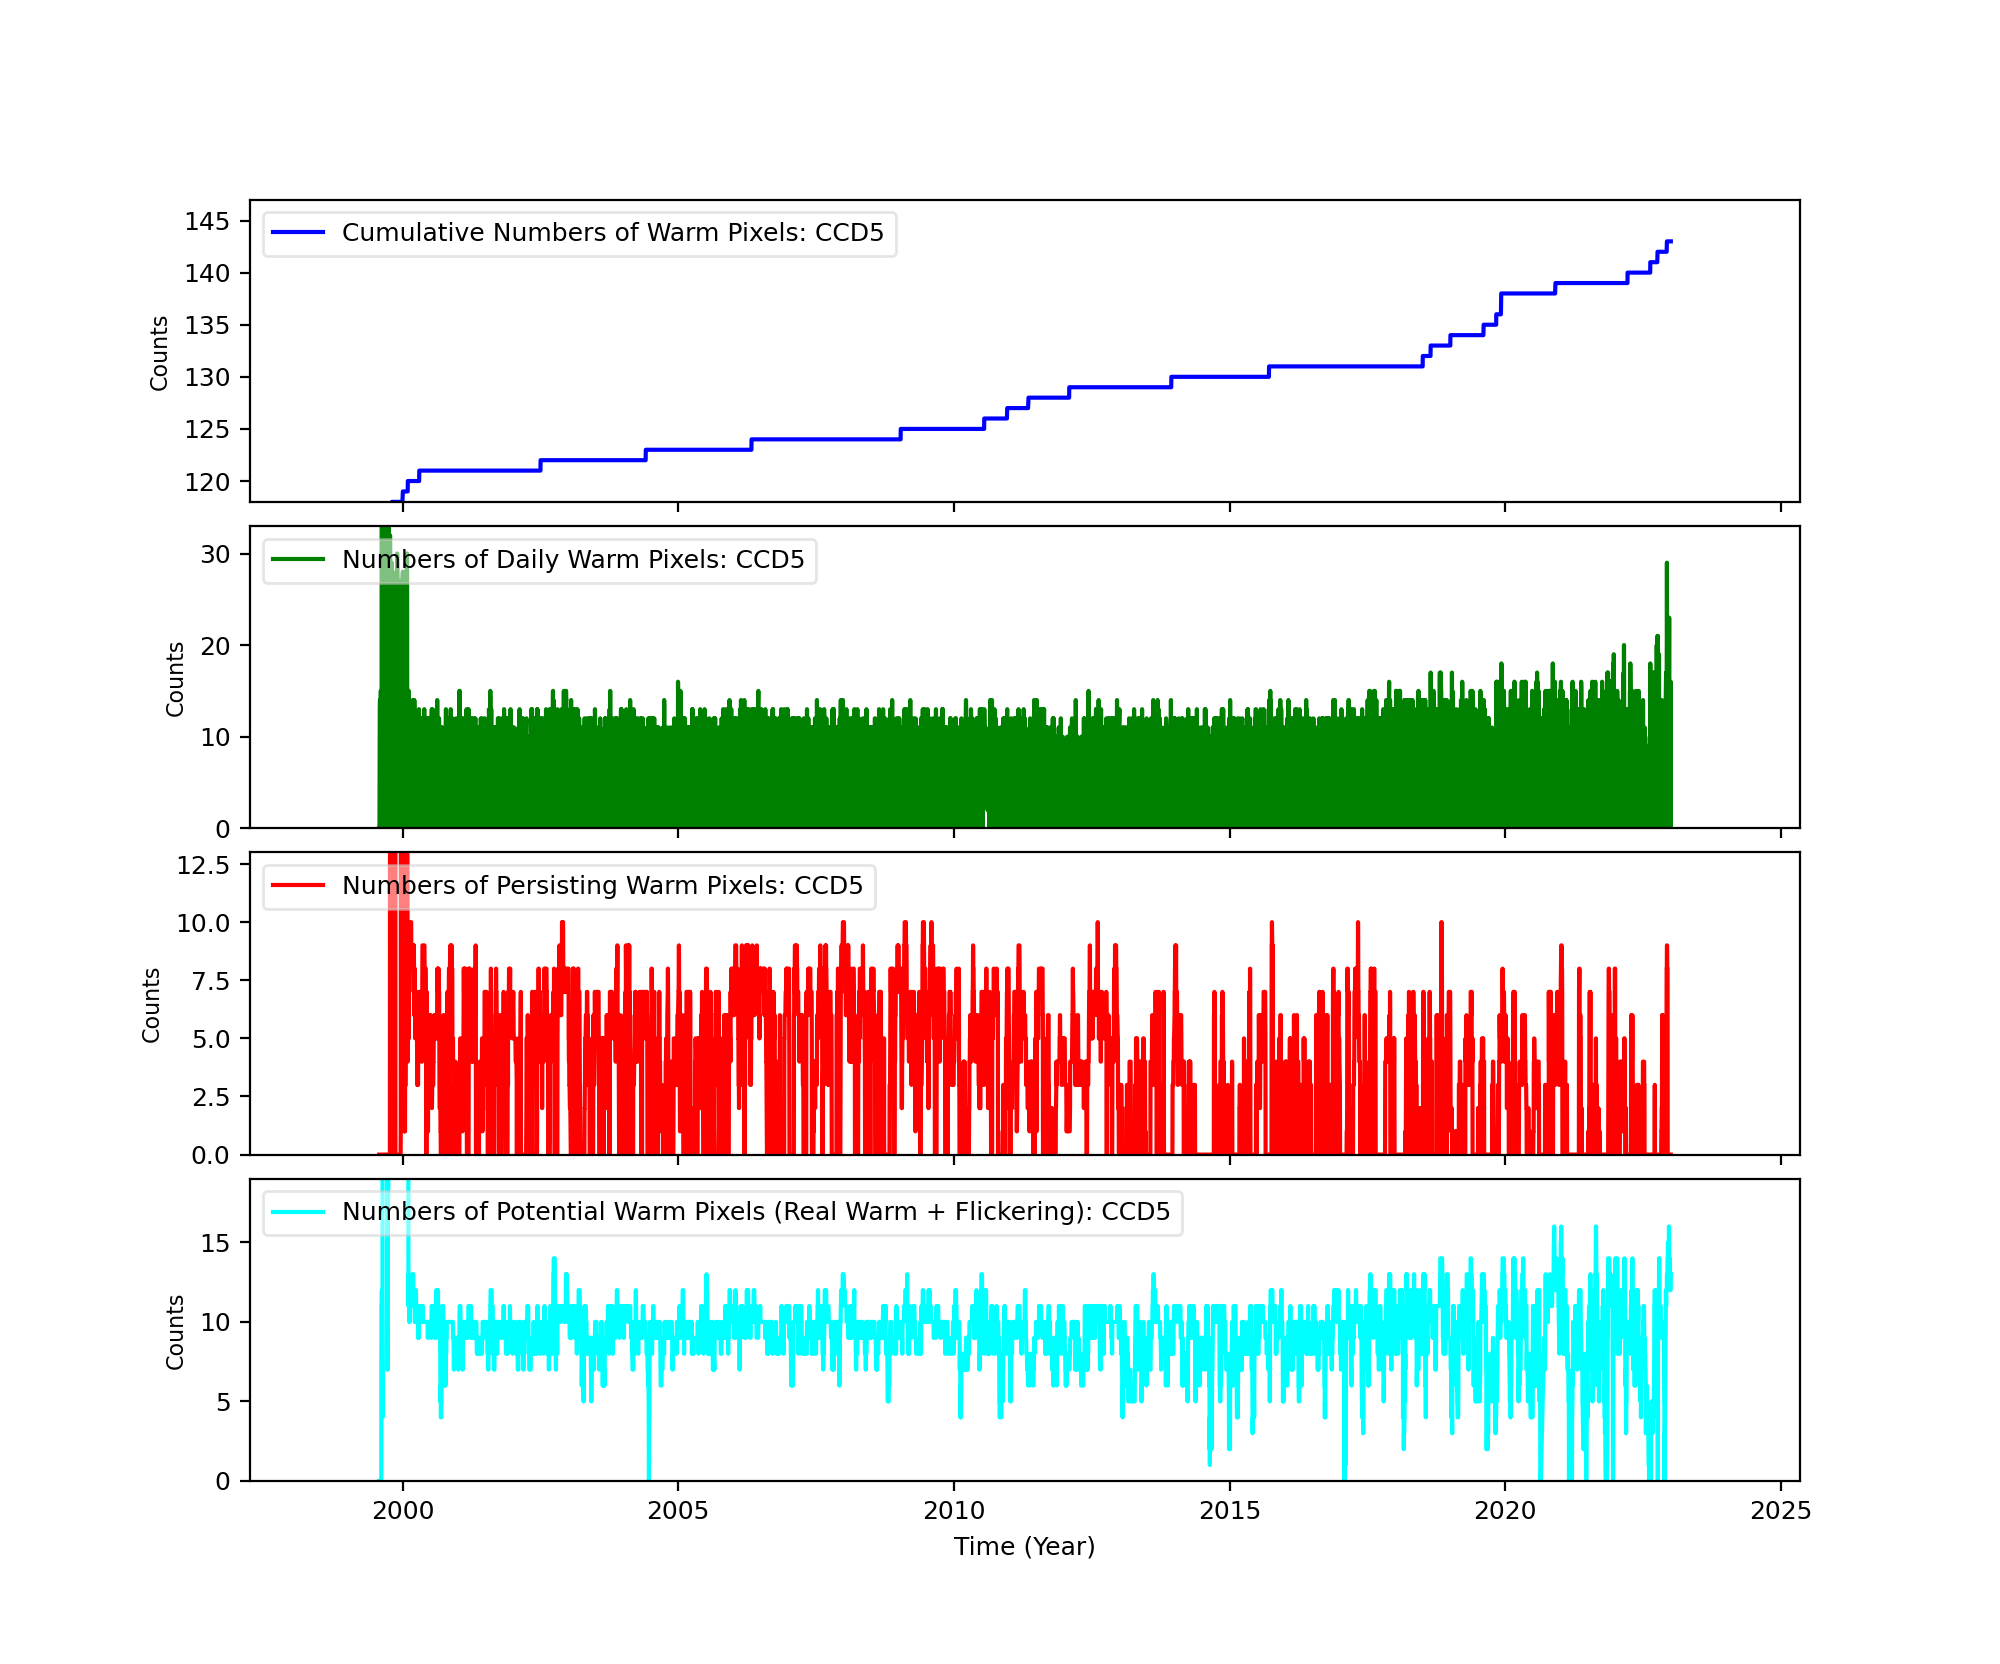
Bad Pixels
The plots below were generated with a new warm pixel finding script. Please see Acis Bad Pixel Page for details.
Front Side CCDs
Back Side CCD (CCD5)
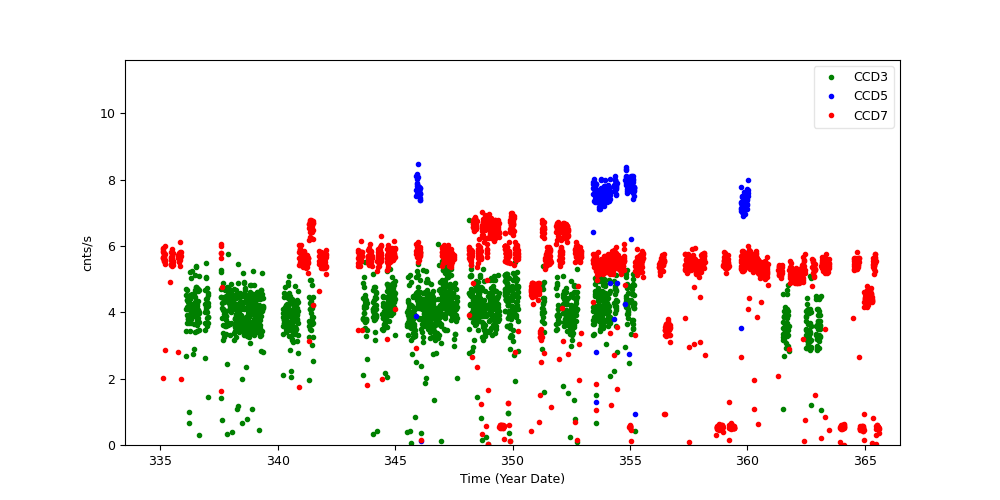
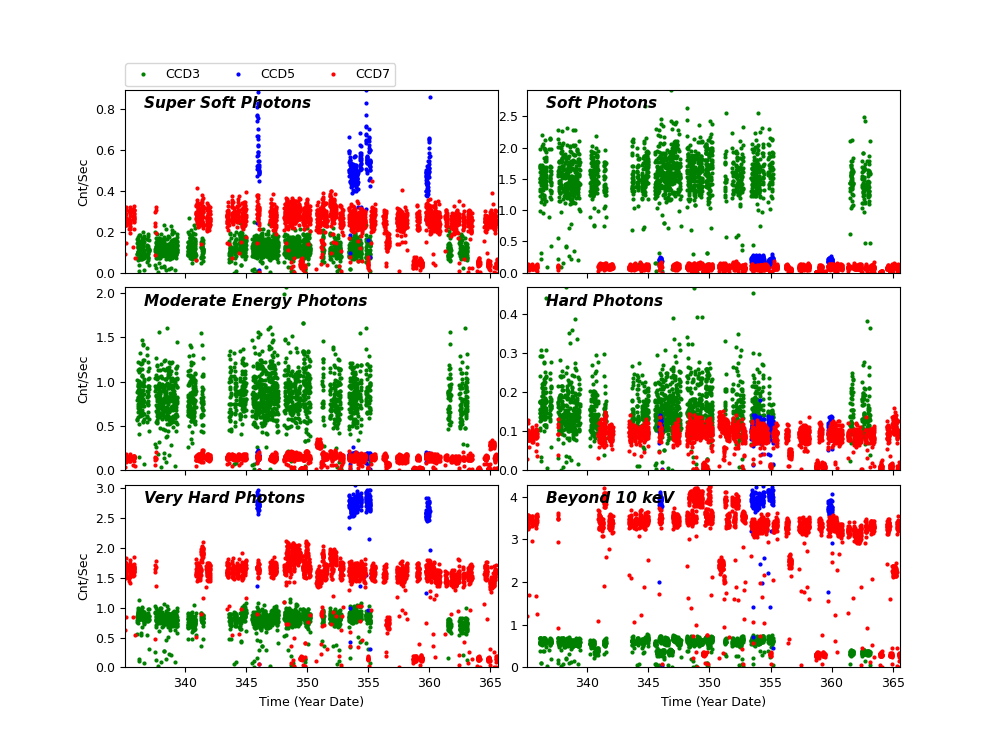
Science Instrument Background Rates
| Name | Low (keV) | High(KeV) | Description |
|---|---|---|---|
| SSoft | 0.00 | 0.50 | Super soft photons |
| Soft | 0.50 | 1.00 | Soft photons |
| Med | 1.00 | 3.00 | Moderate energy photons |
| Hard | 3.00 | 5.00 | Hard Photons |
| Harder | 5.00 | 10.00 | Very Hard photons |
| Hardest | 10.00 | Beyond 10 keV |
HRC
DOSE of Central 4K Pore-Pairs
Please refer to Maximum Dose Trends for more details.
No Data
)
IMAGE                       NPIX      MEAN    STDDEV      MIN       MAX
HRCI_08_1999_12_2022.fits  16777216	na	na	na	na
No Data
)
IMAGE                       NPIX      MEAN    STDDEV      MIN       MAX
HRCS_08_1999_12_2022.fits  16777216	na	na	na	na
|
|
Max dose trend plots corrected for events that "pile-up"
in the center of the taps due to bad position information.
|
)
|
)
|
)
|
)
|
| Sep 2022 | Jun 2022 | Mar 2022 | Dec 2021 |
|---|
)
|
)
|
)
|
)
|
| Sep 2022 | Jun 2022 | Mar 2022 | Dec 2021 |
|---|
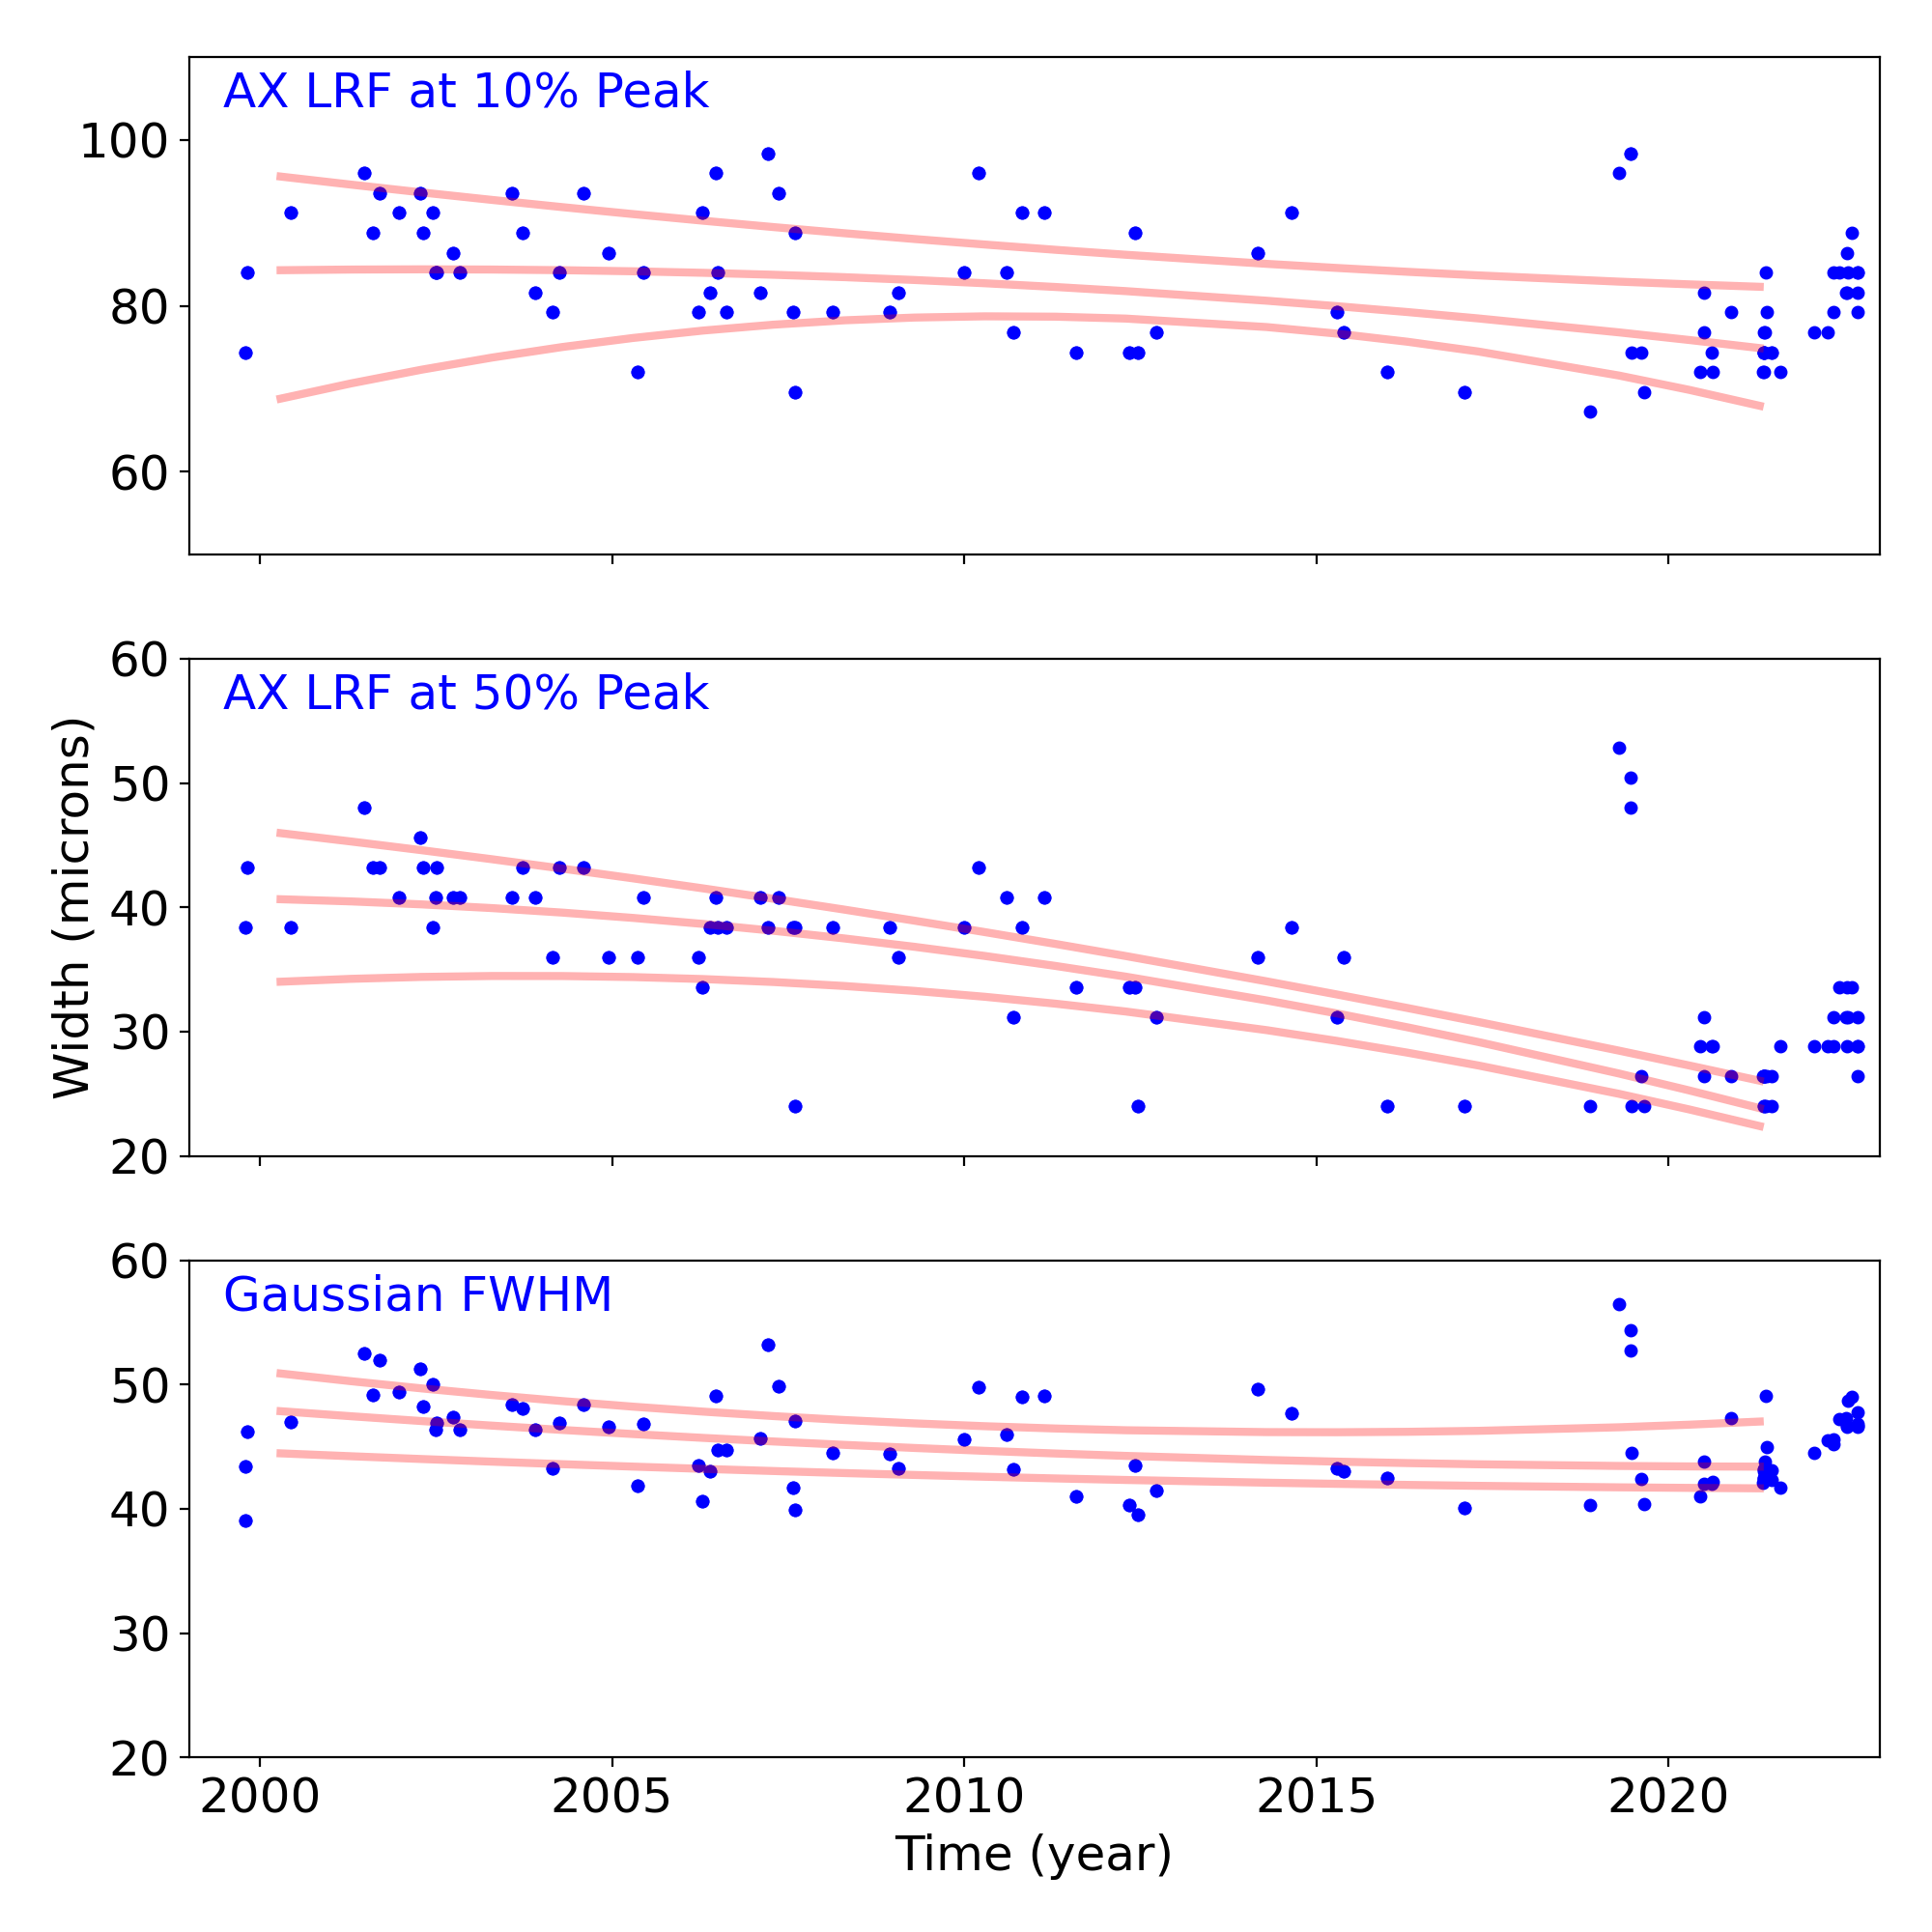
Gratings
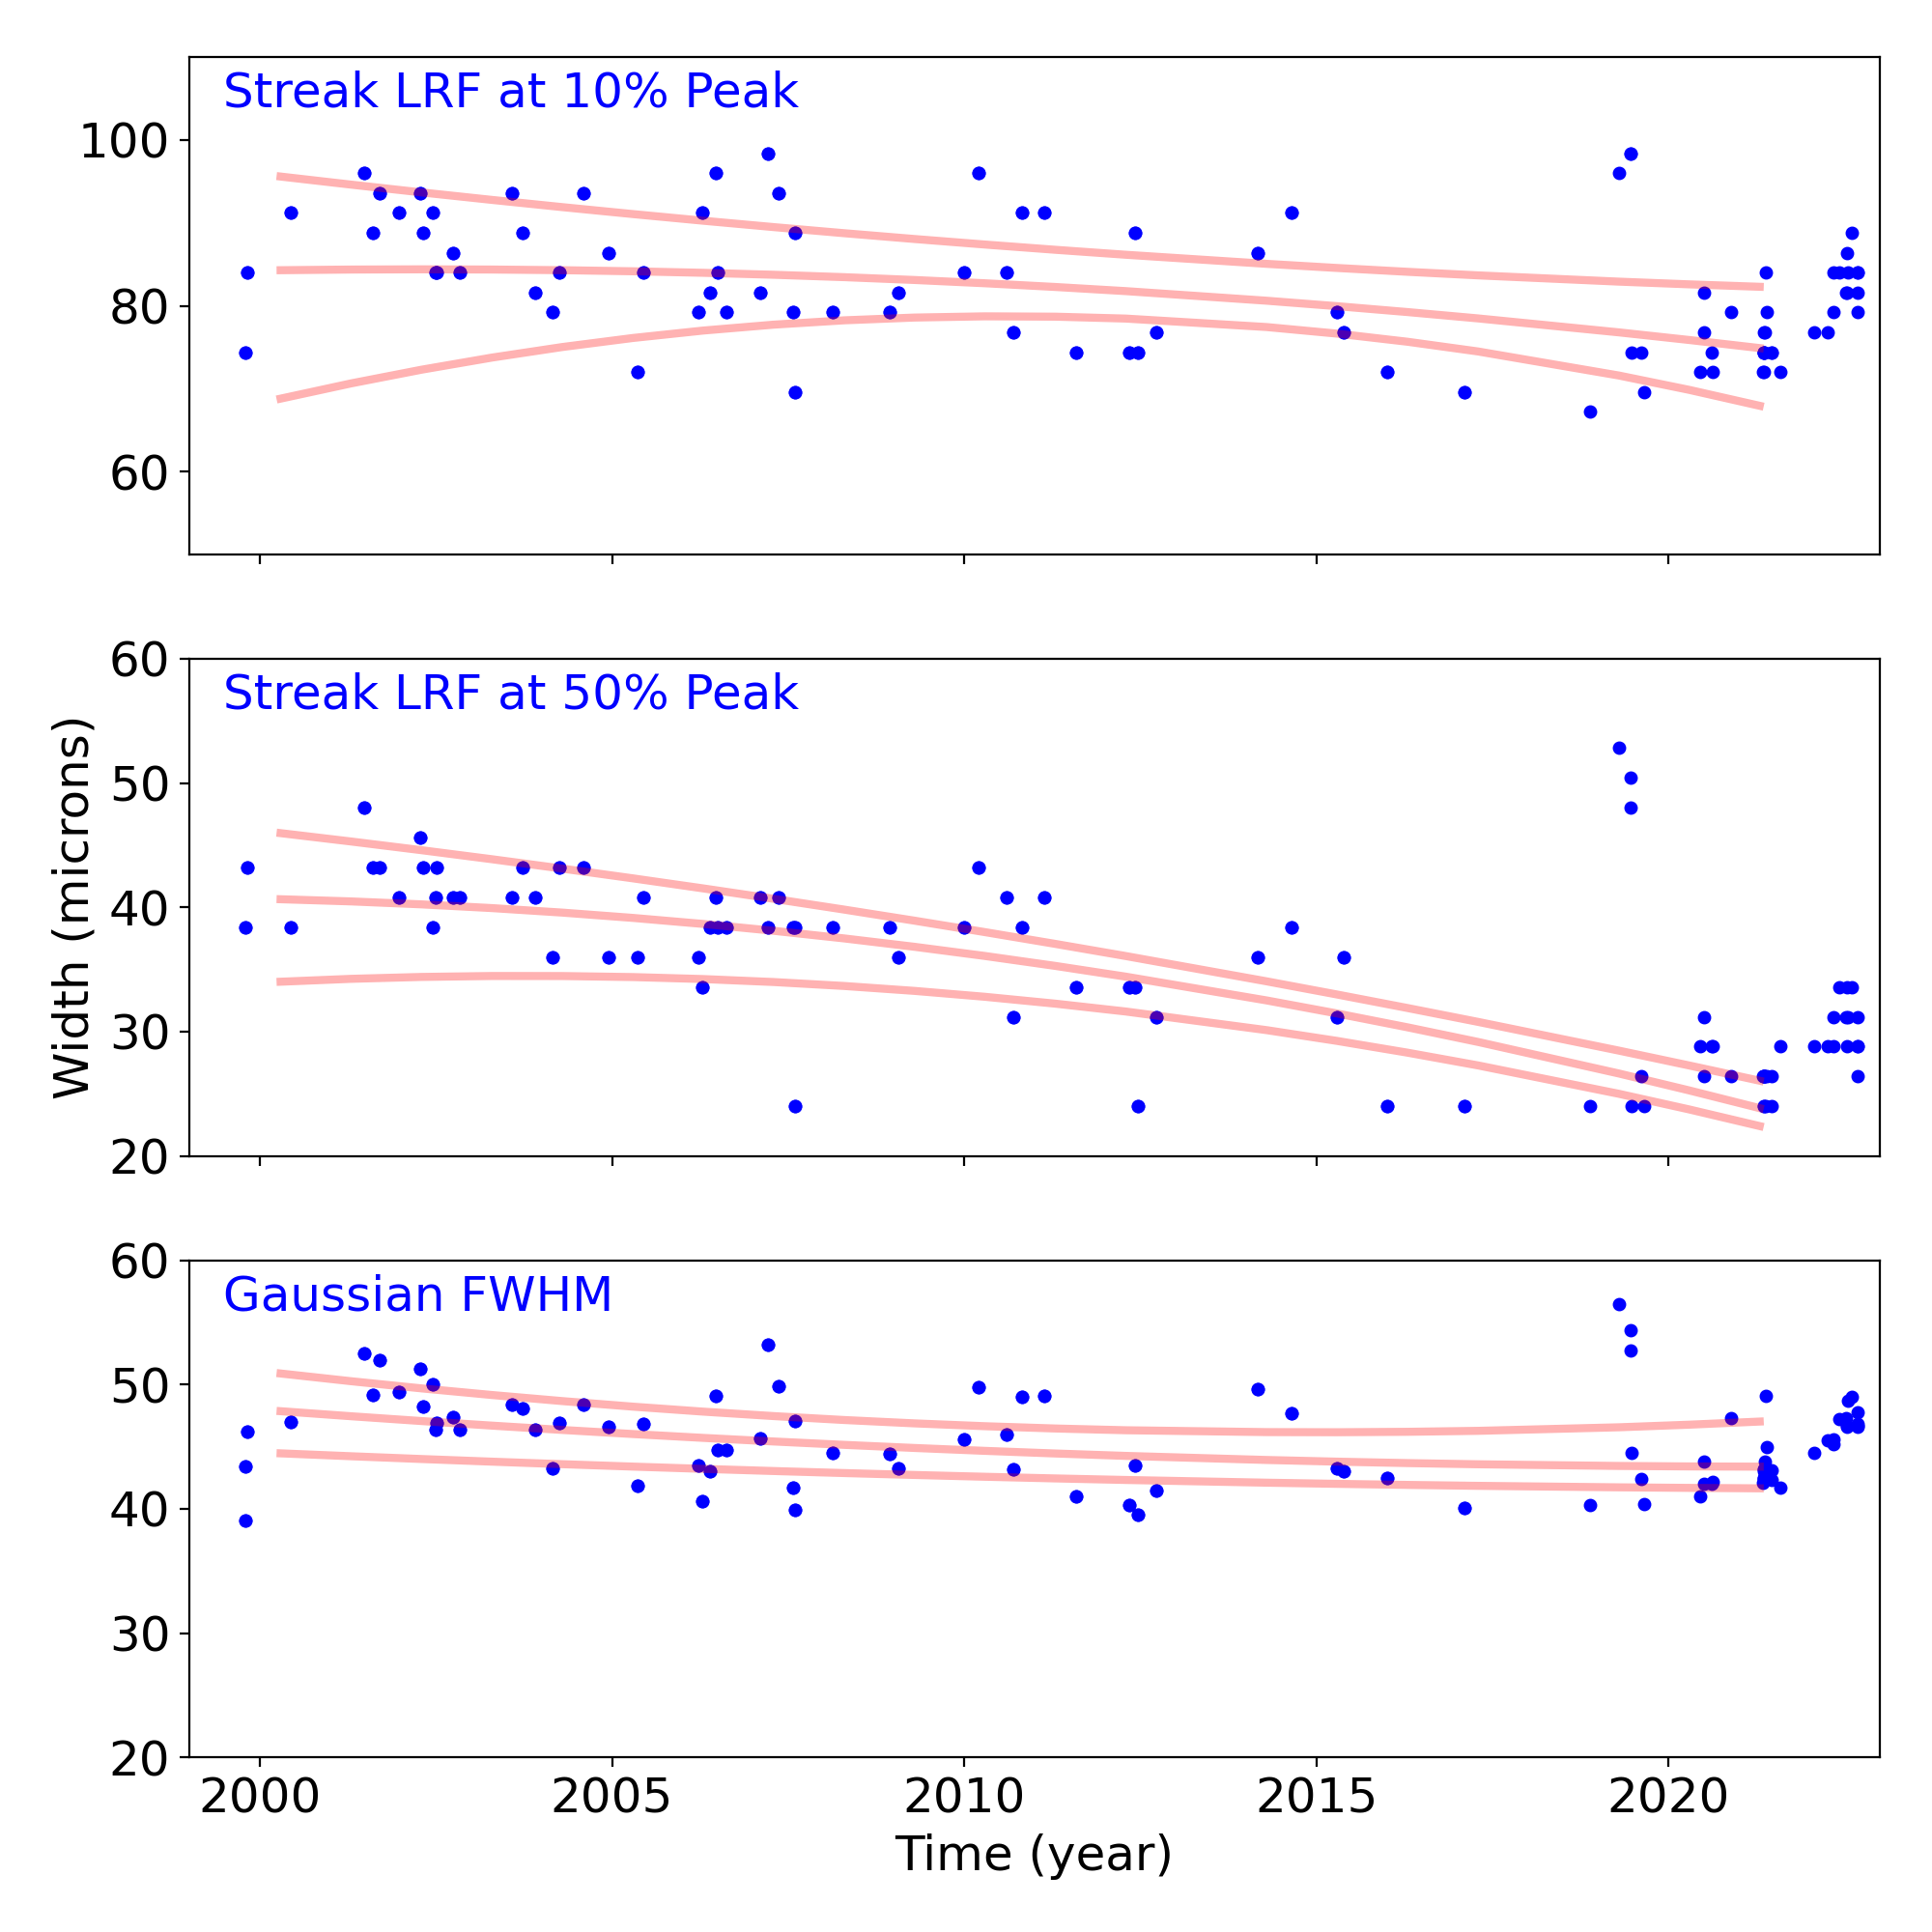
Grating Trends/Focus
We plot the width of the zero order streak of ACIS/HETG observations and the width of the zero order image for HRC/LETG observations of point sources. No significant defocusing trend is seen at this time. See Gratings Trends pages.
PCAD
ACA Trending
| ACIS |
)
|
)
|
)
|
|
|---|---|---|---|---|
)
|
)
|
)
| ||
| HRCI |
)
|
)
|
)
|
)
|
| HRCI |
)
|
)
|
)
|
)
|
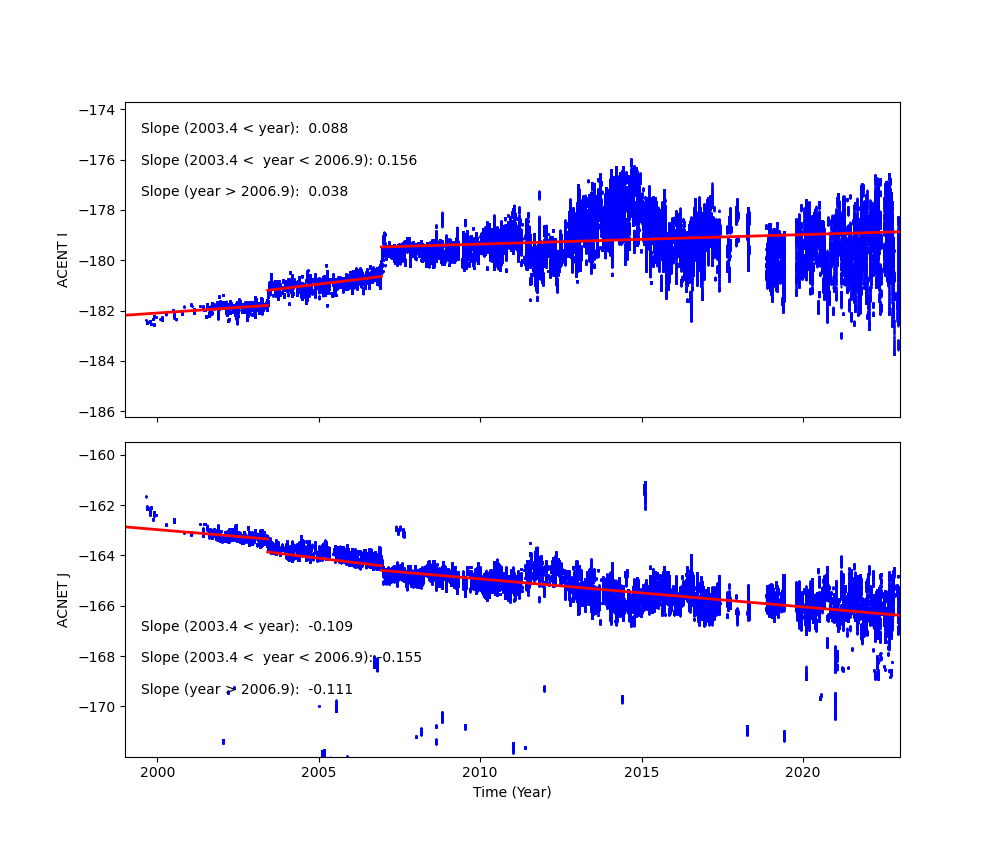
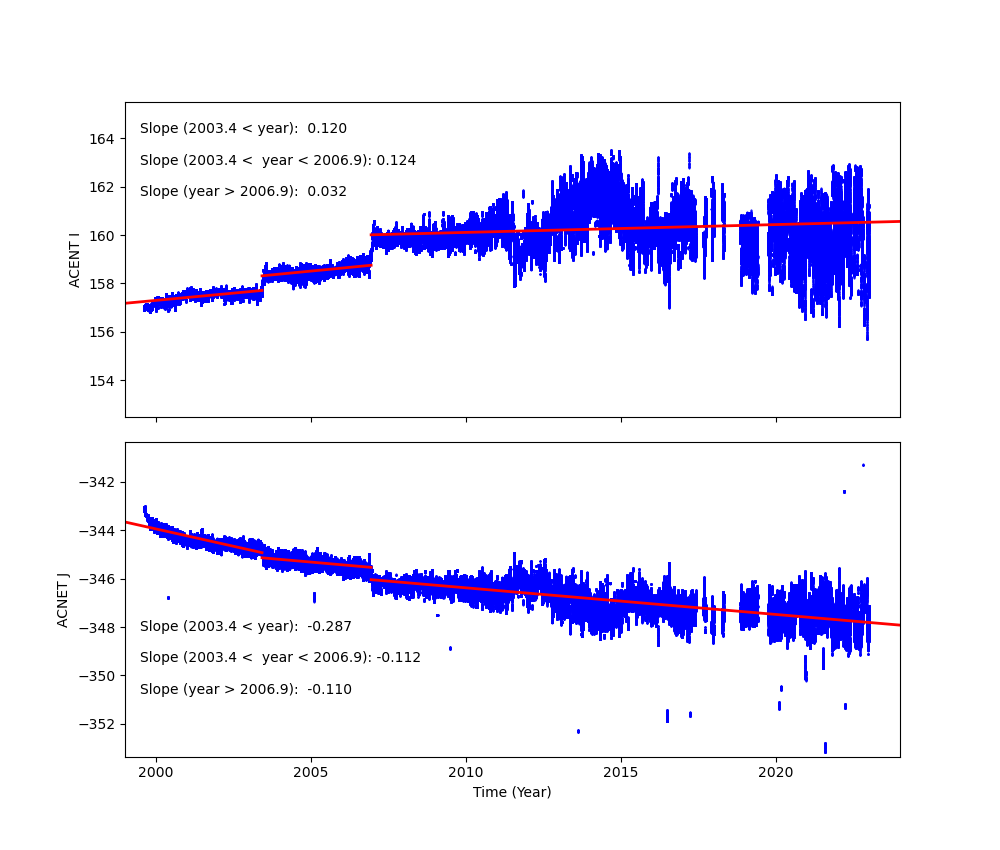
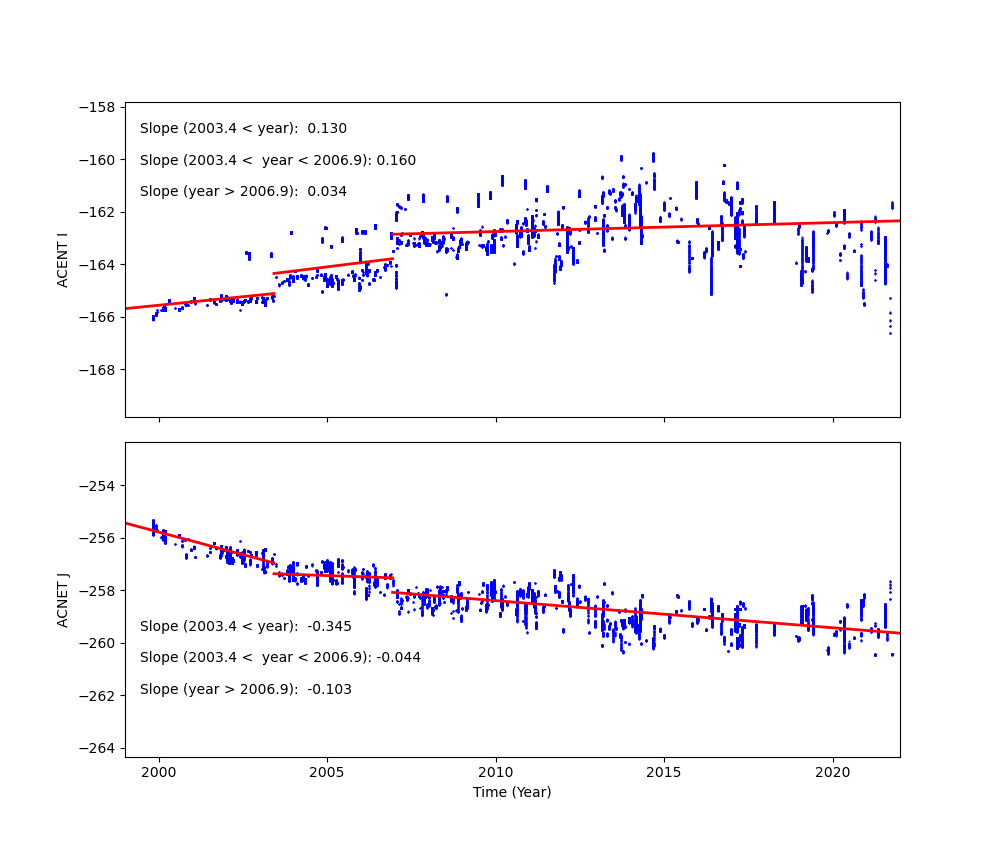
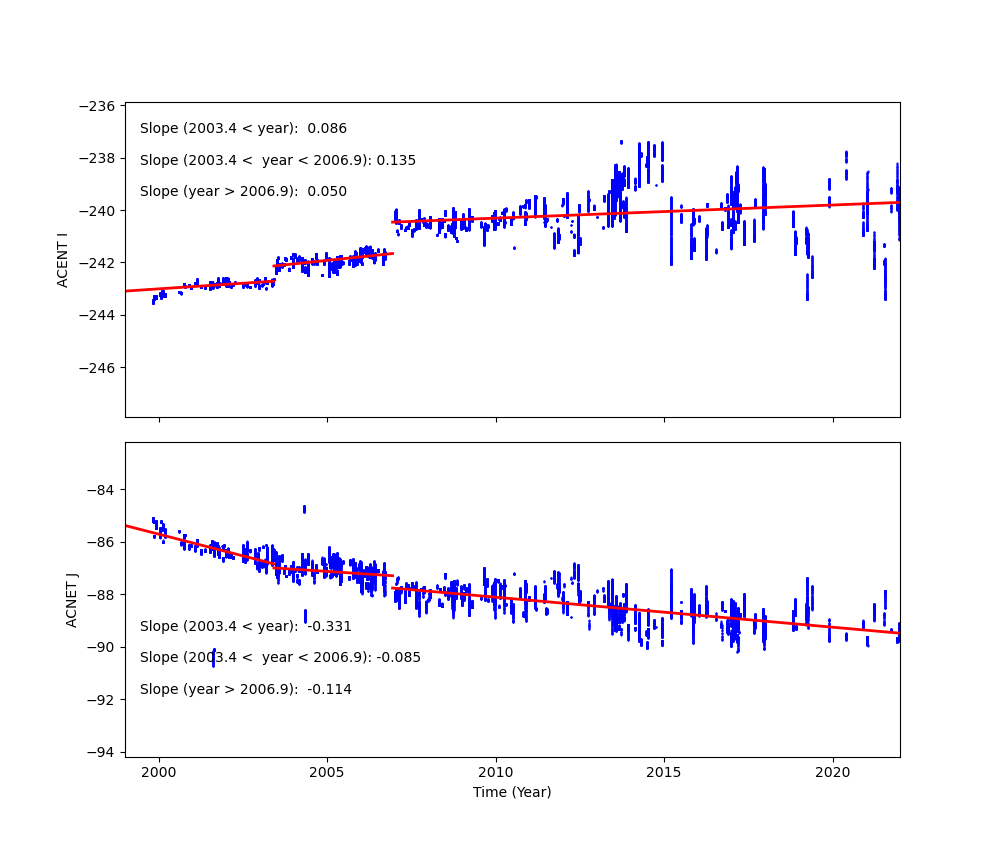
Fid Light Drift
Fid light positions on ACA drift with time. The drift trends of Fid light 2 with ACIS-I and ACIS-S configurations are shown below.
The top panel shows Fid light 2 drift in ACENT I (app. along with -Y axis), and the
bottom panel shows that in ACENT J (app. along with Z axis). The unit is a pixel, and
one pixel is approximately 0.5 arcsec. The slope listed at the top right corner is
the change in a position per year (arcsec/yr). The vertical line on DOM = 1411 (Jun 1, 2003)
indicates a transition date of use of IRU-1 to IRU-2.
See also Tom Aldcroft's updated page:
https://cxc.cfa.harvard.edu/mta/ASPECT/fid_drift
Fid 2 (ACIS-I)
Fid 2 (ACIS-S)
Fid 8 (HRC-I)
Fid 12 (HRC-S)
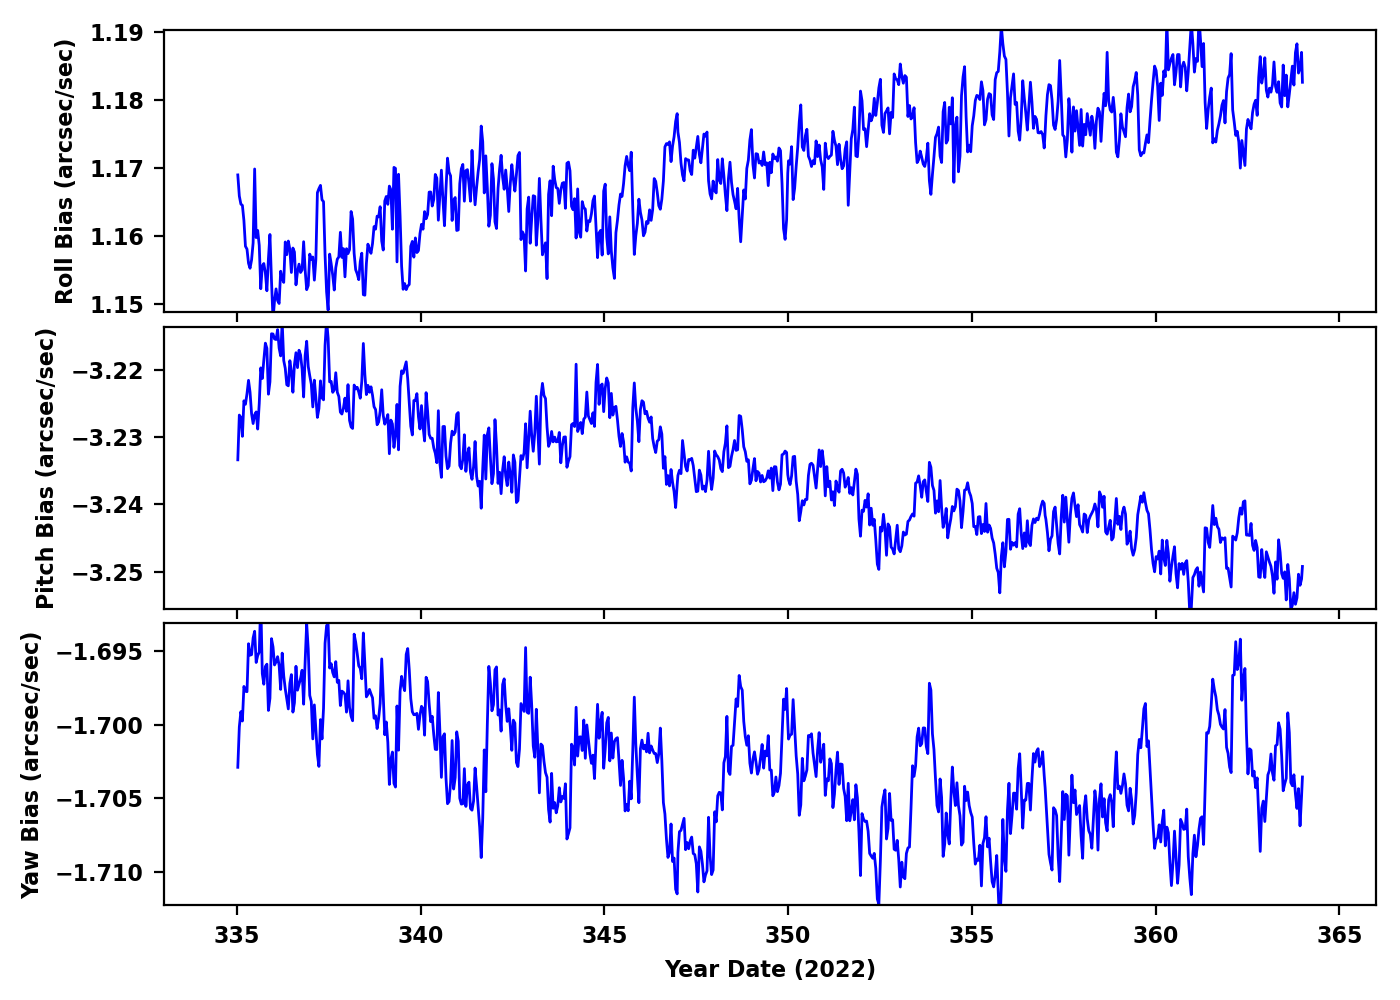
Gyro Bias Drift
Radiation History
Radiation Count Rates of Dec 2022

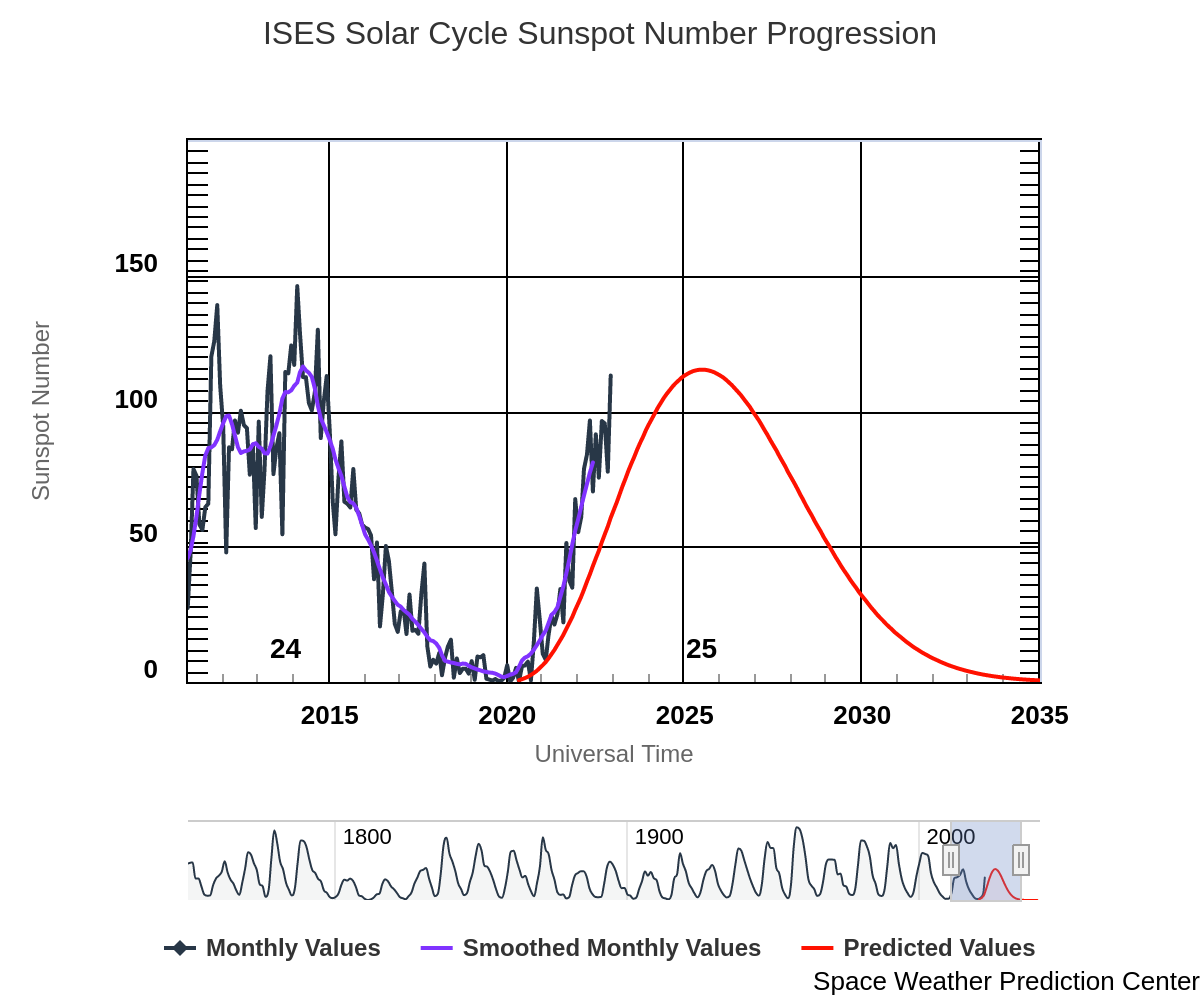
Sun Spot History (See:NOAA Page)
Trending
Critical Trends
| ACIS Temperatures - Daily Maximums | |||||||
|---|---|---|---|---|---|---|---|
| MSID | MEAN | RMS | DELTA/YR | DELTA/YR/YR | UNITS | DESCRIPTION | |
| 1pdeaat | 9.675e-04 | 0.003 | (3.02+/-0.06)e2 | -2.84 +/- 1.80 | K | PSMC DEA PS A TEMP | |
| HRMA Computed Averages - Daily Maximums | |||||||
|---|---|---|---|---|---|---|---|
| MSID | MEAN | RMS | DELTA/YR | DELTA/YR/YR | UNITS | DESCRIPTION | |
| obaavg | -0.009 | 0.001 | (2.99+/-0.03)e2 | 1.94 +/- 0.71 | TEMP | OBA/TFTE | |
| EPHIN Temperatures - Daily Maximums | |||||||
|---|---|---|---|---|---|---|---|
| MSID | MEAN | RMS | DELTA/YR | DELTA/YR/YR | UNITS | DESCRIPTION | |
| teio | 0.050 | 0.009 | (3.30+/-0.22)e2 | 1.73 +/- 3.81 | K | EPHIN ELECTRONICS HOUSING TEMP | |
| tephin | 0.043 | 0.004 | (3.38+/-0.08)e2 | 4.41 +/- 2.62 | K | EPHIN SENSOR HOUSING TEMP | |
| S/C Main Temperatures - Daily Maximums | |||||||
|---|---|---|---|---|---|---|---|
| MSID | MEAN | RMS | DELTA/YR | DELTA/YR/YR | UNITS | DESCRIPTION | |
| tcylfmzm | 0.022 | 0.006 | (3.18+/-0.13)e2 | -3.76 +/- 2.02 | K | CNT CYL TEMP:-Z SIDE UNDER LAE-1 | |
| tcylfmzp | 0.027 | 0.005 | (3.21+/-0.12)e2 | -3.28 +/- 1.84 | K | CNT CYL TEMP:-Z SIDE UNDER LAE-2 | |
| S/C Ancillary Temperatures - Daily Maximums | |||||||
|---|---|---|---|---|---|---|---|
| MSID | MEAN | RMS | DELTA/YR | DELTA/YR/YR | UNITS | DESCRIPTION | |
| tfssbkt1 | 0.057 | 0.012 | (3.50+/-0.27)e2 | -3.97 +/- 4.31 | K | FSS BRAC | |
| tfssbkt2 | 0.056 | 0.012 | (3.45+/-0.29)e2 | -3.60 +/- 4.39 | K | FSS BRAC | |
| tsctsf1 | 0.036 | 0.002 | (3.24+/-0.05)e2 | -0.42 +/- 1.59 | K | SC-TS FITTING -1 TEMP | |
| tsctsf6 | 0.034 | 0.002 | (3.23+/-0.05)e2 | -1.08 +/- 1.69 | K | SC-TS FITTING -6 TEMP | |
| MUPS - Daily Maximums | |||||||
|---|---|---|---|---|---|---|---|
| MSID | MEAN | RMS | DELTA/YR | DELTA/YR/YR | UNITS | DESCRIPTION | |
| pm1thv1t | 0.006 | 0.006 | (3.55+/-0.14)e2 | 0.78 +/- 2.65 | K | MUPS 1 THRUSTER VALVE 01 TEMP | |
| pm2thv1t | 0.002 | 0.018 | (3.29+/-0.42)e2 | 6.50 +/- 7.47 | K | MUPS 2 THRUSTER VALVE 01 TEMP | |
| pm1thv2t | 0.007 | 0.006 | (3.57+/-0.13)e2 | 0.94 +/- 2.80 | K | MUPS 1 THRUSTER VALVE 02 TEMP | |
| pm2thv2t | -0.049 | 0.021 | (3.23+/-0.49)e2 | 2.19 +/- 9.17 | K | MUPS 2 THRUSTER VALVE 02 TEMP | |
| pline02t | 0.020 | 0.005 | (3.37+/-0.11)e2 | 2.91 +/- 2.71 | K | PROP LINE TEMP 02 | |
| pline03t | 0.014 | 0.006 | (3.32+/-0.14)e2 | 1.40 +/- 2.37 | K | PROP LINE TEMP 03 | |
| pline04t | 0.032 | 0.005 | (3.20+/-0.11)e2 | 1.13 +/- 2.65 | K | PROP LINE TEMP 04 | |
Quarterly Trends
- HRMA Struts
| Previous Quarter | |||||||
| MSID | MEAN | RMS | DELTA/YR | DELTA/YR/YR | UNITS | DESCRIPTION | |
| 4rt584t | -6.525e-04 | 7.726e-04 | (3.02+/-0.02)e2 | 1.64 +/- 0.51 | K | RT 584 - STRUT TEMP | |
|---|---|---|---|---|---|---|---|
| 4rt585t | -3.621e-04 | 7.774e-04 | (3.02+/-0.02)e2 | 1.66 +/- 0.51 | K | RT 585 - STRUT TEMP | |
| 4rt586t | -0.003 | 6.795e-04 | (2.98+/-0.02)e2 | 1.51 +/- 0.42 | K | RT 586 - STRUT TEMP | |
| 4rt587t | -0.006 | 5.515e-04 | (2.92+/-0.01)e2 | 1.24 +/- 0.31 | K | RT 587 - STRUT TEMP | |
| 4rt597t | 0.003 | 0.002 | (3.10+/-0.04)e2 | 1.67 +/- 1.08 | K | RT 597 - TFTE TEMP | |
| 4rt598t | 0.004 | 0.002 | (3.09+/-0.04)e2 | 1.73 +/- 1.07 | K | RT 598 - TFTE TEMP | |
- OB Forward Bulkhead
| Previous Quarter | |||||||
| MSID | MEAN | RMS | DELTA/YR | DELTA/YR/YR | UNITS | DESCRIPTION | |
| 4rt705t | -0.005 | 9.397e-04 | (2.93+/-0.02)e2 | 1.34 +/- 0.62 | K | RT 705 - OB BUL | |
|---|---|---|---|---|---|---|---|
| 4rt706t | -0.005 | 9.550e-04 | (2.91+/-0.02)e2 | 1.39 +/- 0.63 | K | RT 706 - OB BUL | |
| 4rt707t | -0.004 | 9.656e-04 | (2.94+/-0.02)e2 | 1.59 +/- 0.62 | K | RT 707 - OB BULKHEAD TEMP | |
| 4rt708t | -0.001 | 0.001 | (2.99+/-0.02)e2 | 1.41 +/- 0.69 | K | RT 708 - OB BULKHEAD TEMP | |
| 4rt709t | -5.030e-04 | 0.001 | (3.01+/-0.03)e2 | 1.40 +/- 0.74 | K | RT 709 - OB BULKHEAD TEMP | |
| 4rt710t | 6.896e-04 | 0.001 | (3.03+/-0.03)e2 | 1.56 +/- 0.78 | K | RT 710 - OB BULKHEAD TEMP | |
- HRMA Thermal
- HRMA Thermal
| Previous Quarter | |||||||
| MSID | MEAN | RMS | DELTA/YR | DELTA/YR/YR | UNITS | DESCRIPTION | |
| 4rt568t | -8.765e-04 | 0.001 | (3.00+/-0.02)e2 | 1.90 +/- 0.69 | K | RT 568 - HRMA TEMP | |
|---|---|---|---|---|---|---|---|
| 4rt569t | -0.002 | 3.118e-04 | (2.97+/-0.01)e2 | 0.83 +/- 0.15 | K | RT 569 - HRMA TEMP | |
| 4rt570t | -0.002 | 1.682e-04 | (2.96+/-0.00)e2 | 0.43 +/- 0.07 | K | RT 570 - HRMA TEMP | |
| 4rt575t | 2.201e-04 | 0.001 | (3.05+/-0.03)e2 | 1.74 +/- 0.88 | K | RT 575 - OB CONE TEMP | |
| 4rt576t | -0.004 | 0.001 | (2.96+/-0.02)e2 | 1.84 +/- 0.69 | K | RT 576 - OB CONE TEMP | |
| 4rt578t | 0.003 | 0.002 | (3.03+/-0.04)e2 | 1.86 +/- 1.07 | K | RT 578 - OB CONE TEMP | |
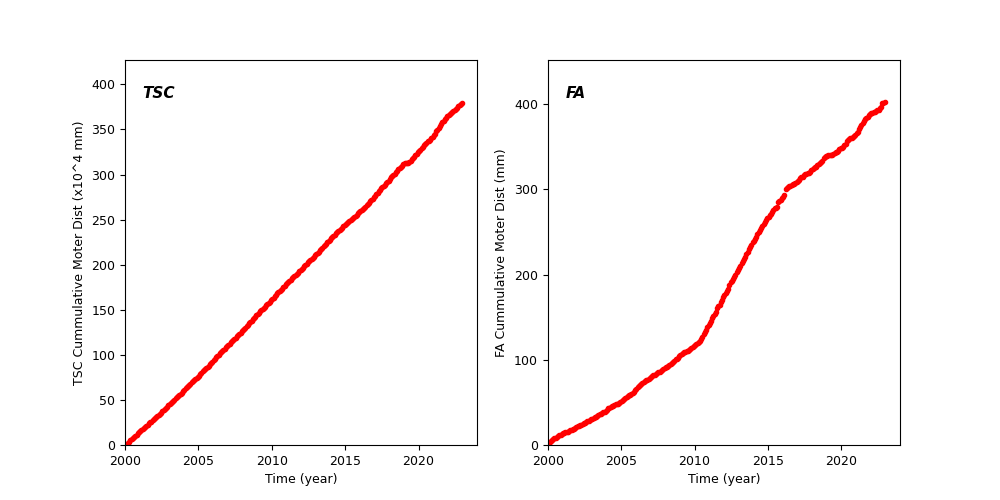
Spacecraft Motions
TSC and FA Cummulative Moter Distance
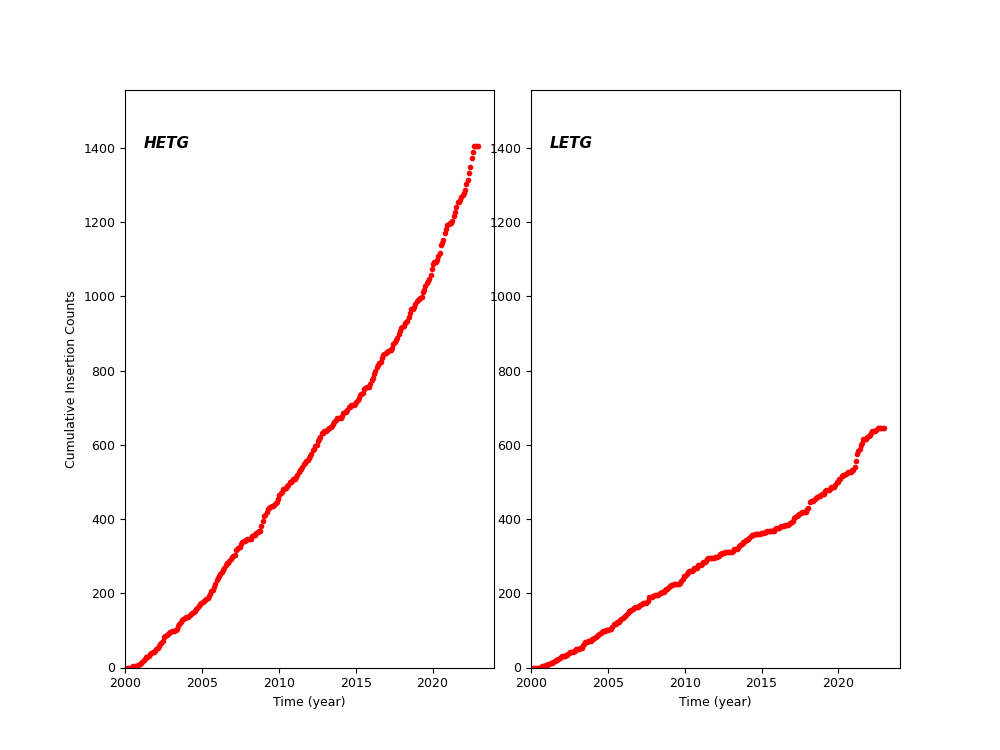
HETG and LETG Cummulative Insertion Counts
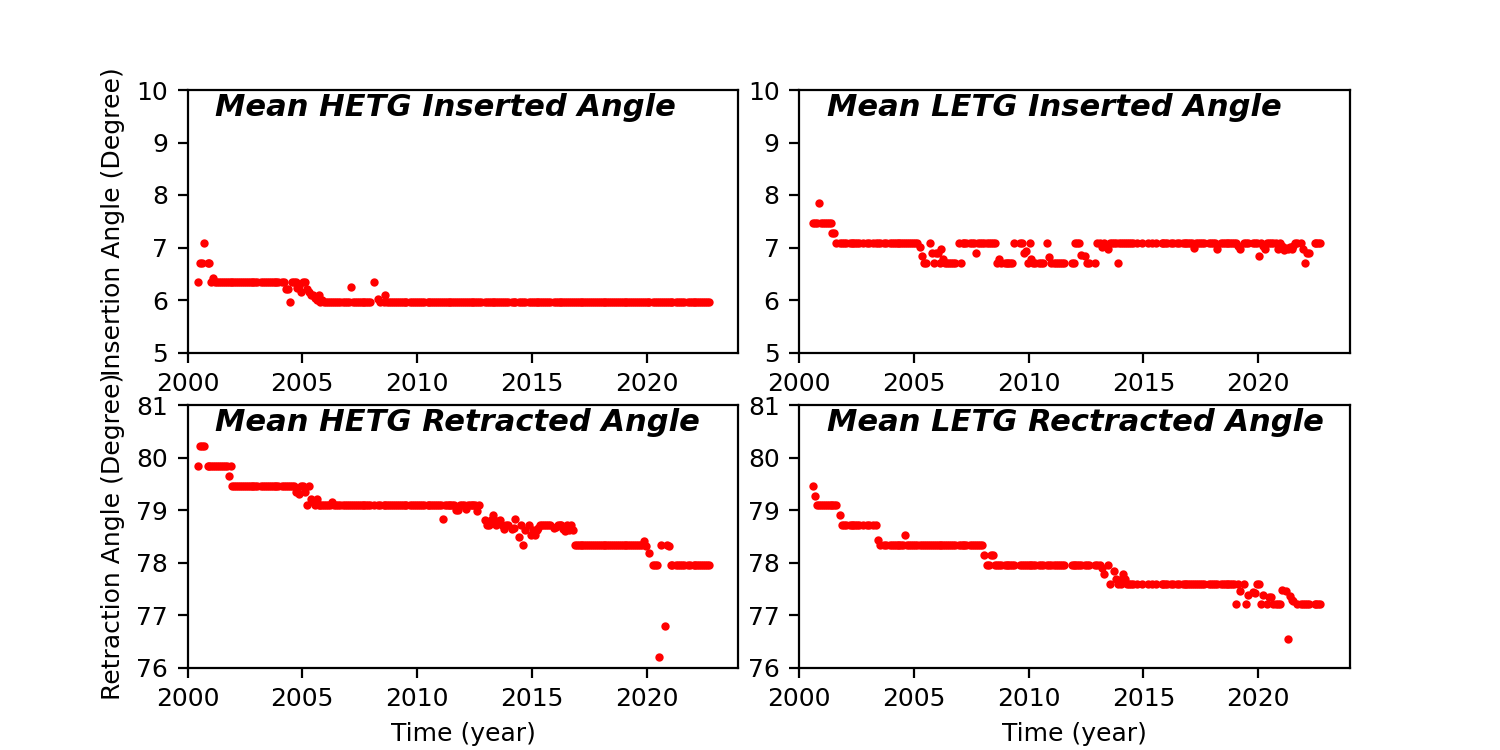
HETG/LETG Insertion/Retraction Angle
Reaction Wheel Rotations