ACIS
ACIS DOSE Registered-Photon-Map
The steps we took to compute the dose map are;
- Level 1 Event files for a specified month are obtained from archive.
- Image data including I2, I3, S2, S3 CCDs are extracted from all event files.
- All the extracted image data were merged to create a month long exposure map for the month.
- The exposure map is opened with ds9, and check a distribution of count rates against energy. From this, estimate the upper threshold value. Any events beyond this upper threshold are assumed erroneous events such as bad pixels.
- Using this upper threshold, the data is filtered, and create a cleaned exposure map for the month.
- The exposure map from each month from the Sep 1999 is added up to create a cumulative exposure map for each month.
- Using fimgstatistic, we compute count rate statistics for each CCDs.
- For observations with high data drop rates (e.g., Crab nebula, Cas A), we corrected the observations by adding events.
Please check more detail plots at Telemetered Photon Dose Trend page.
)
)
)
Statistics:
# IMAGE     NPIX     MEAN        RMS        MIN     MAX
ACIS_mar23 6004901       4.830         13.001           0.0     5359


I2 node 0  262654	3.894589	2.343013	0.0	 69.0
I2 node 1  262654	4.105411	2.649966	0.0	390.0
I2 node 2  262654	4.068833	2.384168	0.0	174.0
I2 node 3  262654	4.069468	2.703339	0.0	389.0

I3 node 0  262654	4.817200	2.690171	0.0	121.0
I3 node 1  262654	4.689327	28.439959	0.0	5353.0
I3 node 2  262654	4.386447	2.416707	0.0	 94.0
I3 node 3  262654	4.632266	23.016223	0.0	5359.0

S2 node 0  262654	6.471052	10.744530	0.0	5053.0
S2 node 1  262654	6.850093	3.590990	0.0	409.0
S2 node 2  262654	8.111405	36.847853	0.0	4692.0
S2 node 3  262654	8.024272	13.136416	0.0	5297.0

S3 node 0  262654	10.569309	10.265832	0.0	203.0
S3 node 1  262654	11.306026	9.896786	0.0	2926.0
S3 node 2  262654	10.520952	6.247941	0.0	117.0
S3 node 3  262654	8.529213	3.215515	0.0	 49.0
)
)
)
Statistics:
 IMAGE     NPIX      MEAN        RMS           MIN      MAX
ACIS_total   6004901       2629.125         3356.427           0.0   144868


I2 node 0  262654	2283.581423	461.107148	489.0	14202.0
I2 node 1  262654	2404.368318	661.406463	503.0	142862.0
I2 node 2  262654	2432.898109	515.010616	527.0	15093.0
I2 node 3  262654	2437.279129	629.085257	488.0	29958.0

I3 node 0  262654	2621.847948	643.259430	490.0	14247.0
I3 node 1  262654	2704.909254	1744.456939	514.0	55918.0
I3 node 2  262654	2417.261039	451.108232	486.0	14499.0
I3 node 3  262654	2398.701000	486.165722	457.0	35273.0

S2 node 0  262654	3063.027037	496.978814	1658.0	22471.0
S2 node 1  262654	3248.375307	738.632255	1842.0	17539.0
S2 node 2  262654	3594.088833	738.954446	2256.0	31322.0
S2 node 3  262654	3555.728955	595.023179	1991.0	76797.0

S3 node 0  262654	5442.337780	2965.024143	2390.0	54601.0
S3 node 1  262654	6654.872775	2379.510915	0.0	59026.0
S3 node 2  262654	5385.867869	1361.004764	2489.0	27375.0
S3 node 3  262654	4214.113975	761.876368	2546.0	26547.0
)
|
)
|
)
|
)
|
| Dec 2022 | Sep 2022 | Jun 2022 | Mar 2022 |
|---|
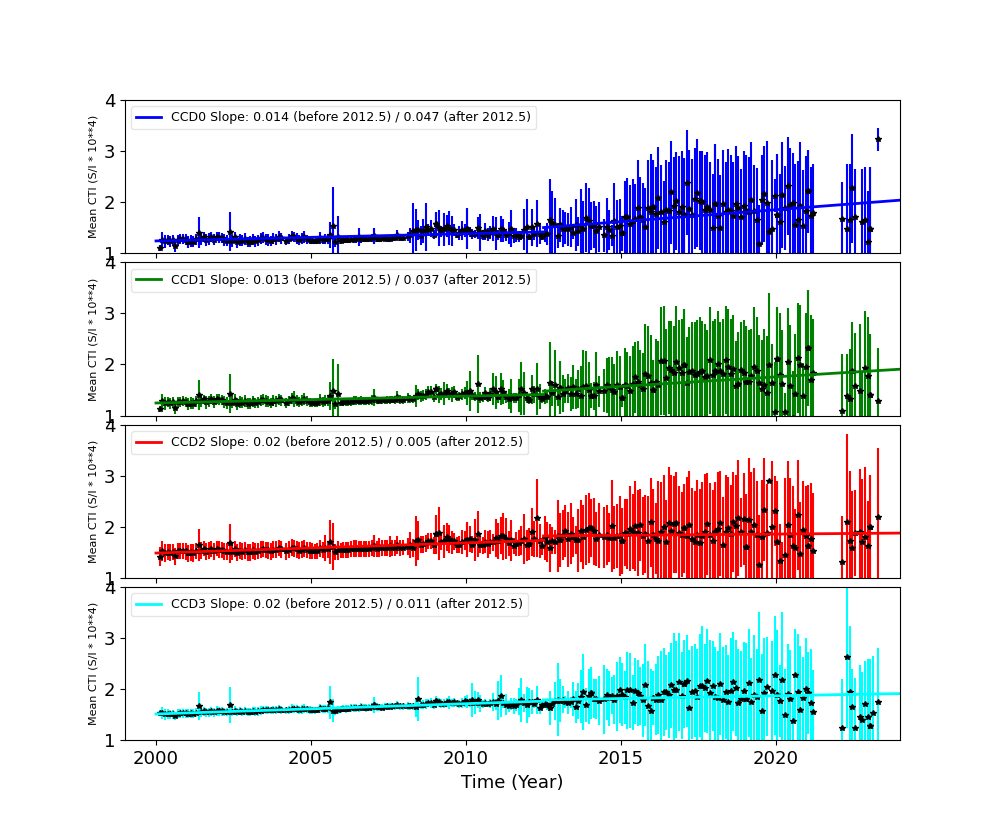
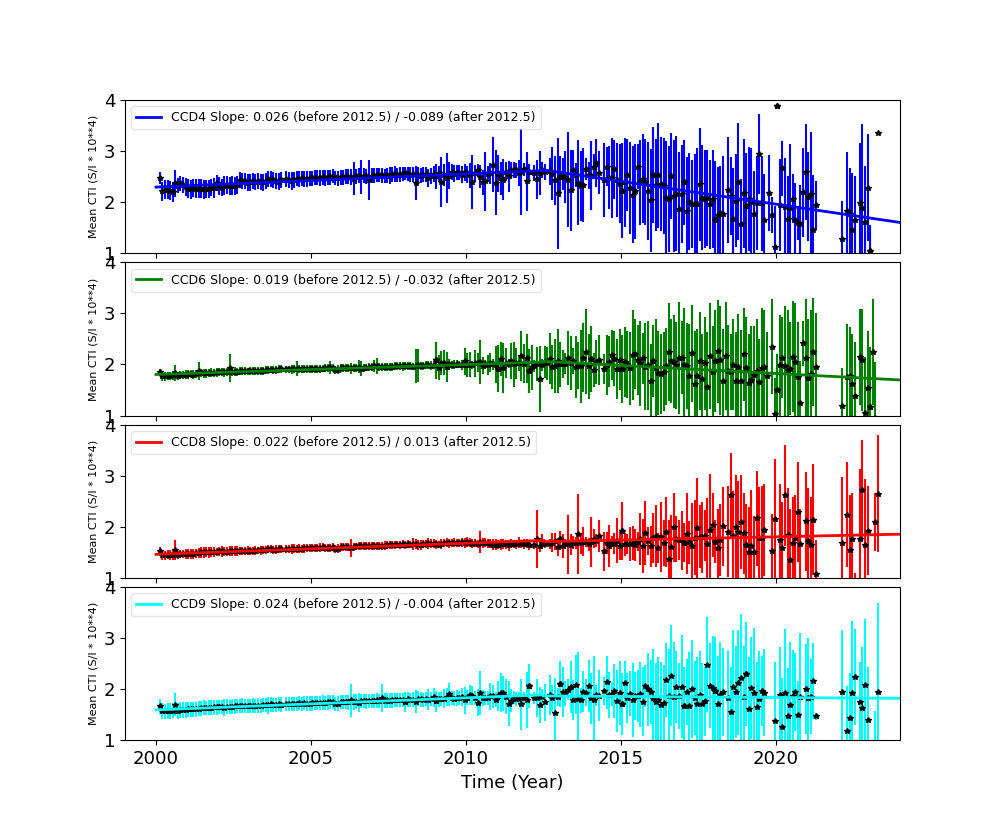
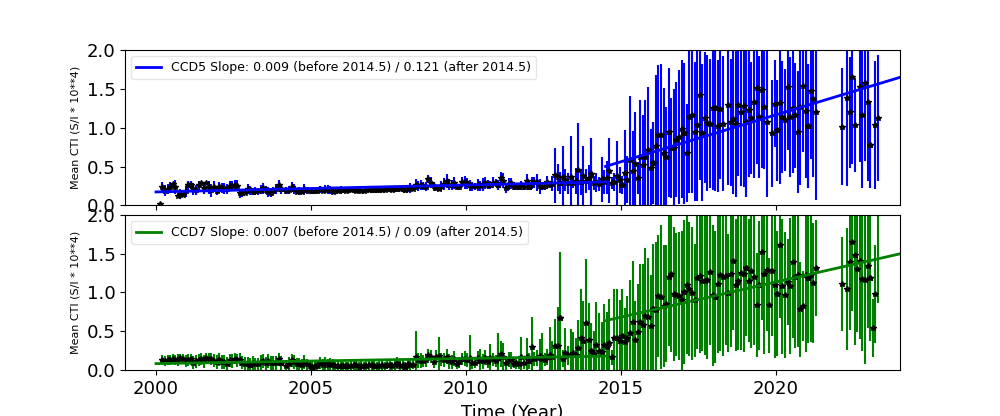
The Mean Detrended CTI
We report CTIs with a refined data definition. CTIs were computed for the temperature dependency corrected data. Please see CTI page for detailed explanation. CTI's are computed for Mn K alpha, and defined as slope/intercept x10^4 of row # vs ADU. Data file: here
Imaging CCDs
Spectral CCDs
Backside CCDs
Focal Plane Temperature
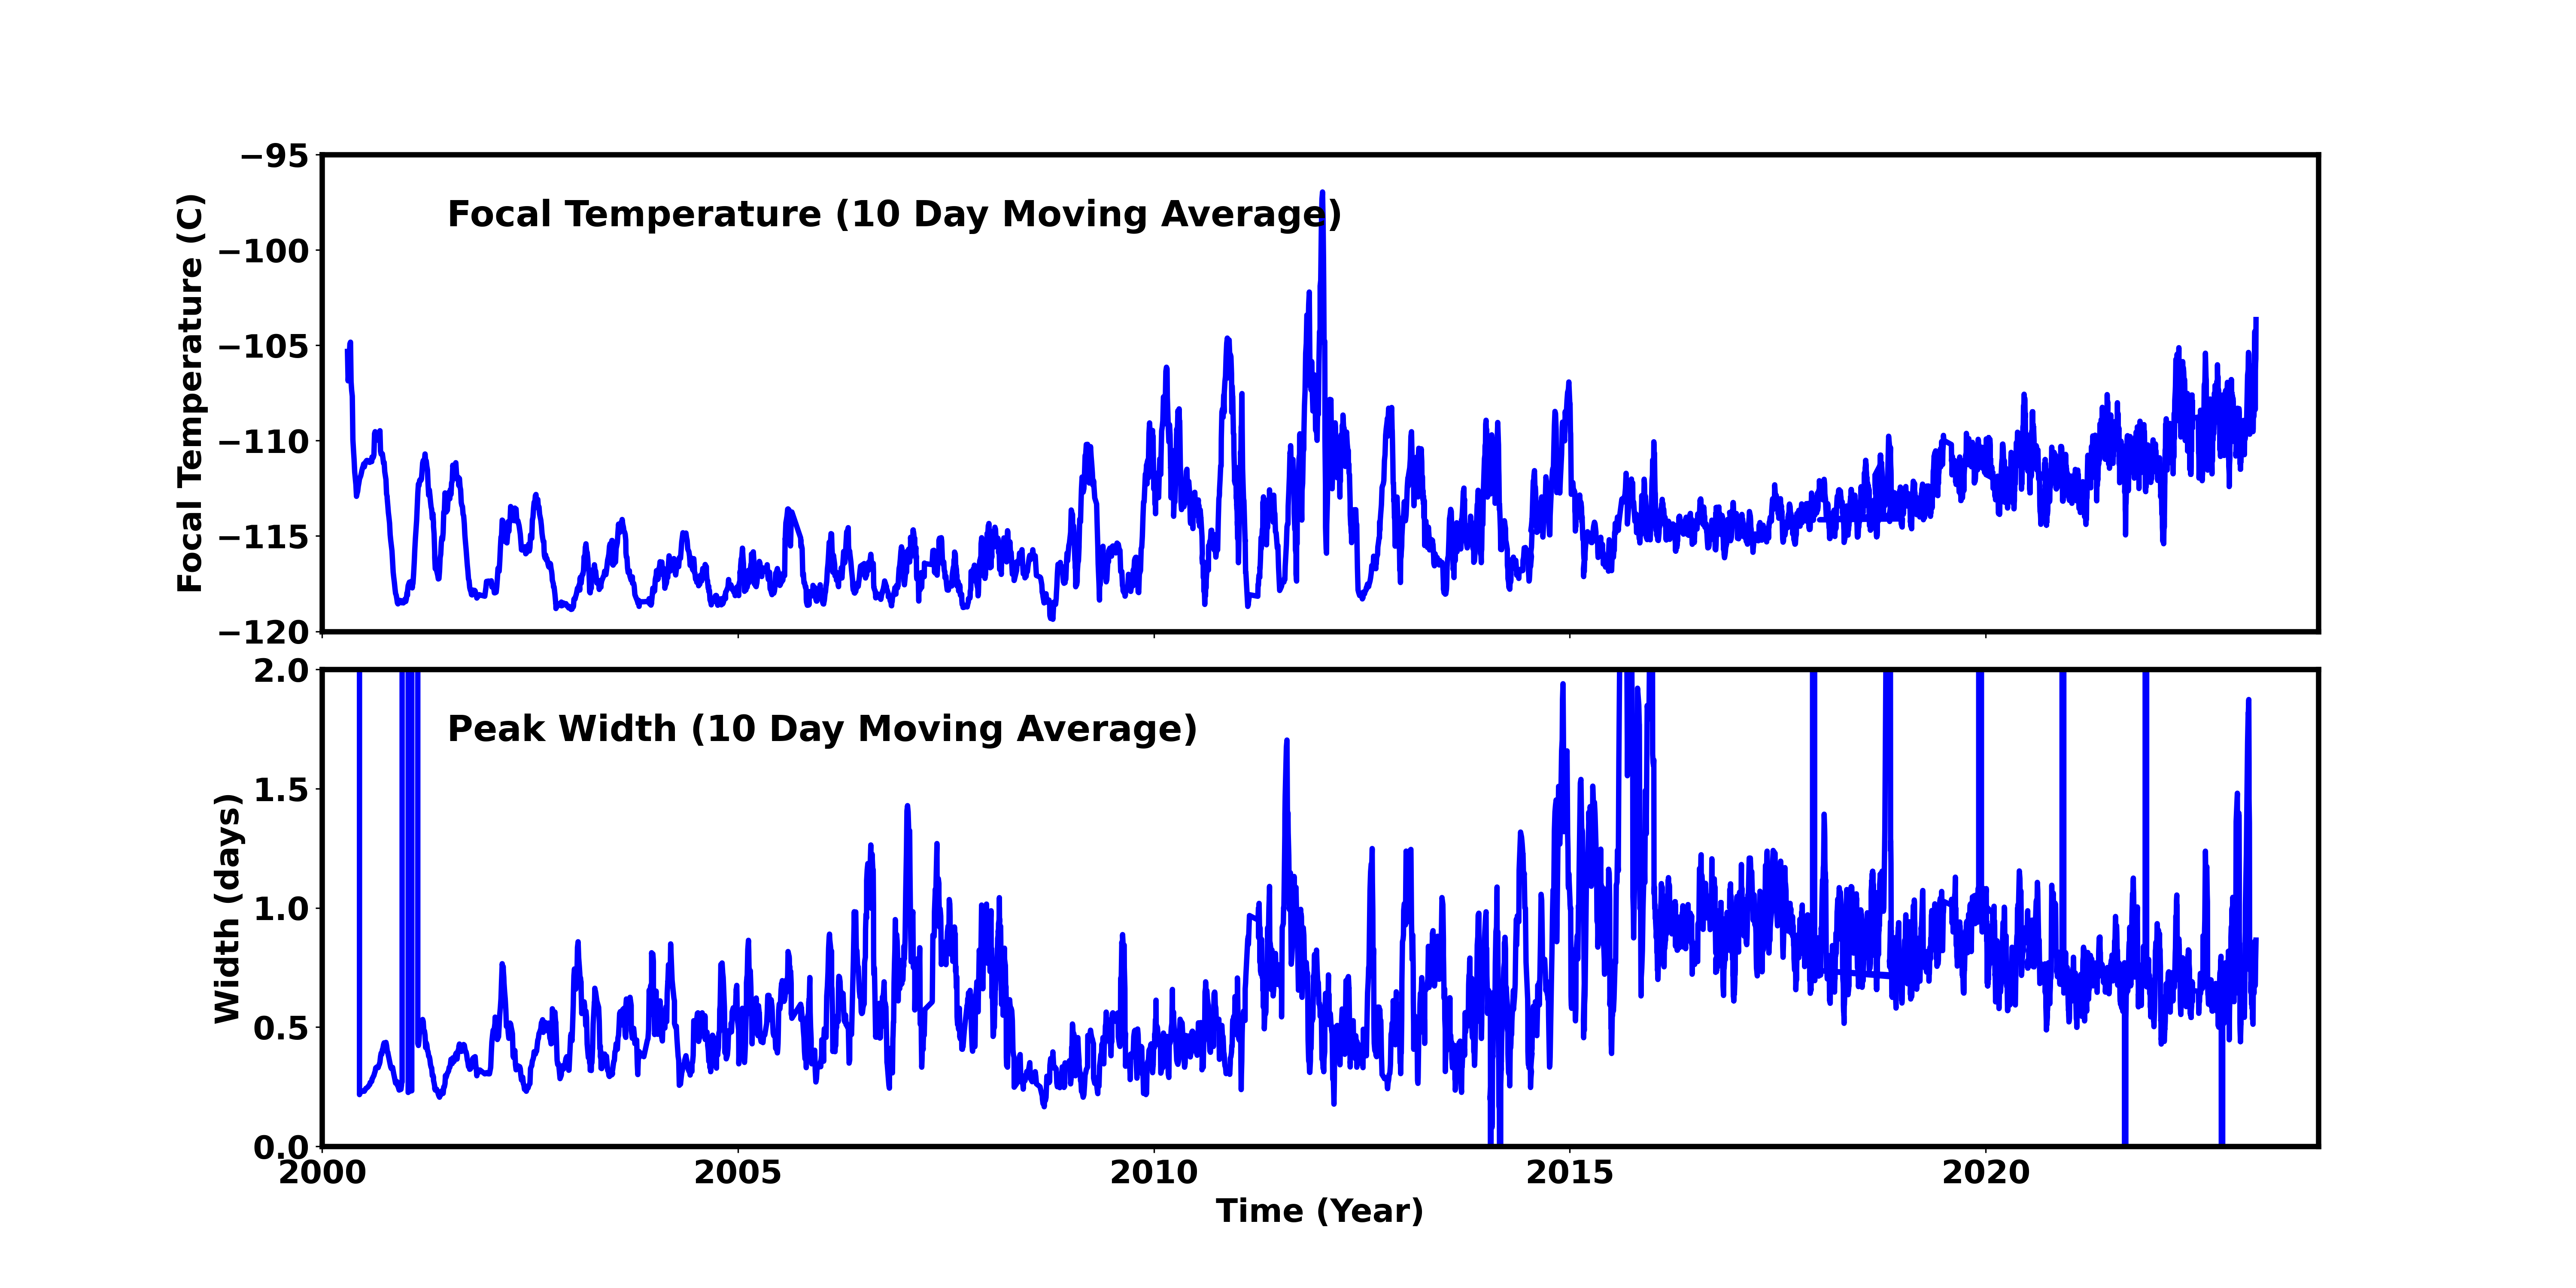
Mar 2023 Focal Temperature
| The Mean (max) FPT: | |
|---|---|
| -107.11 | +/- 7.9 C |
| Mean Width: | |
| 0.69 | +/- 0.39 days |
Averaged Focal Plane Temperature
We are using 10 period moving averages to show trends of peak temperatures and peak widths. Note, the gaps in the width plot are due to missing/corrupted data.
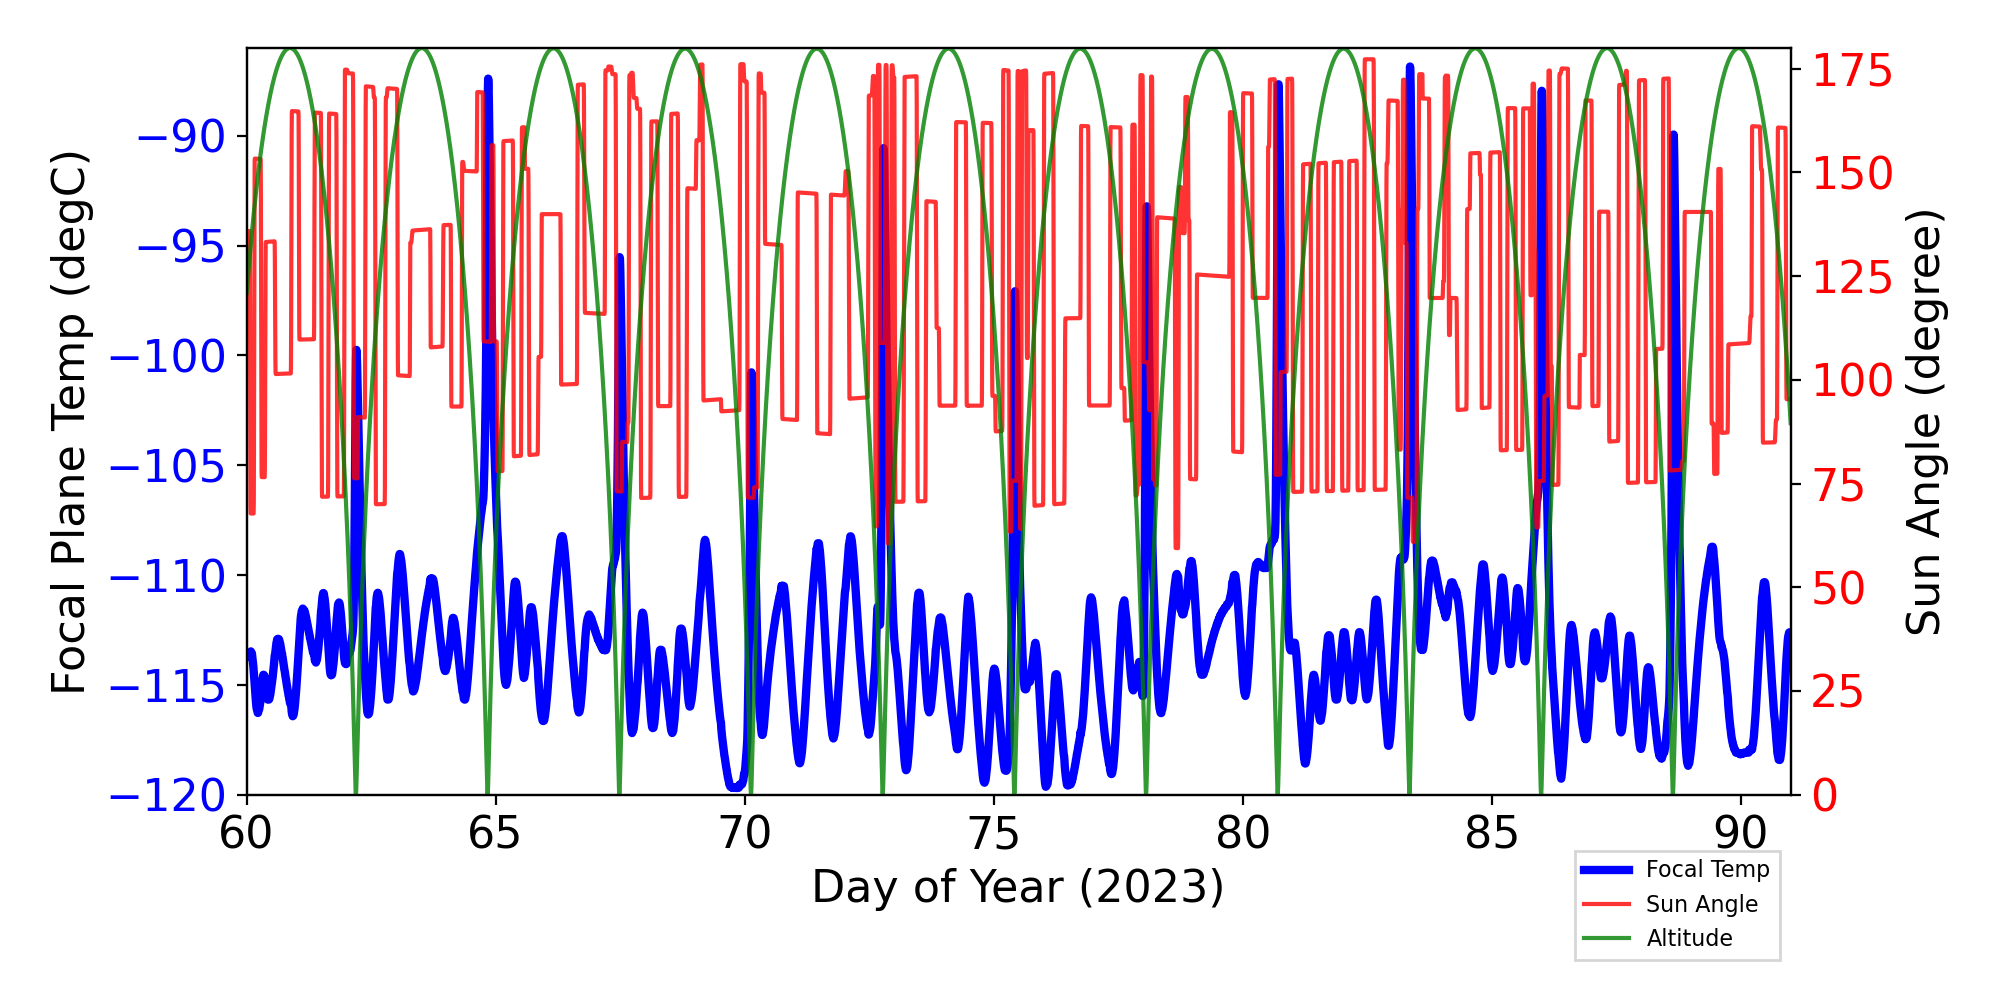
Focal Plane Temperature, Sun Angle and Altitude
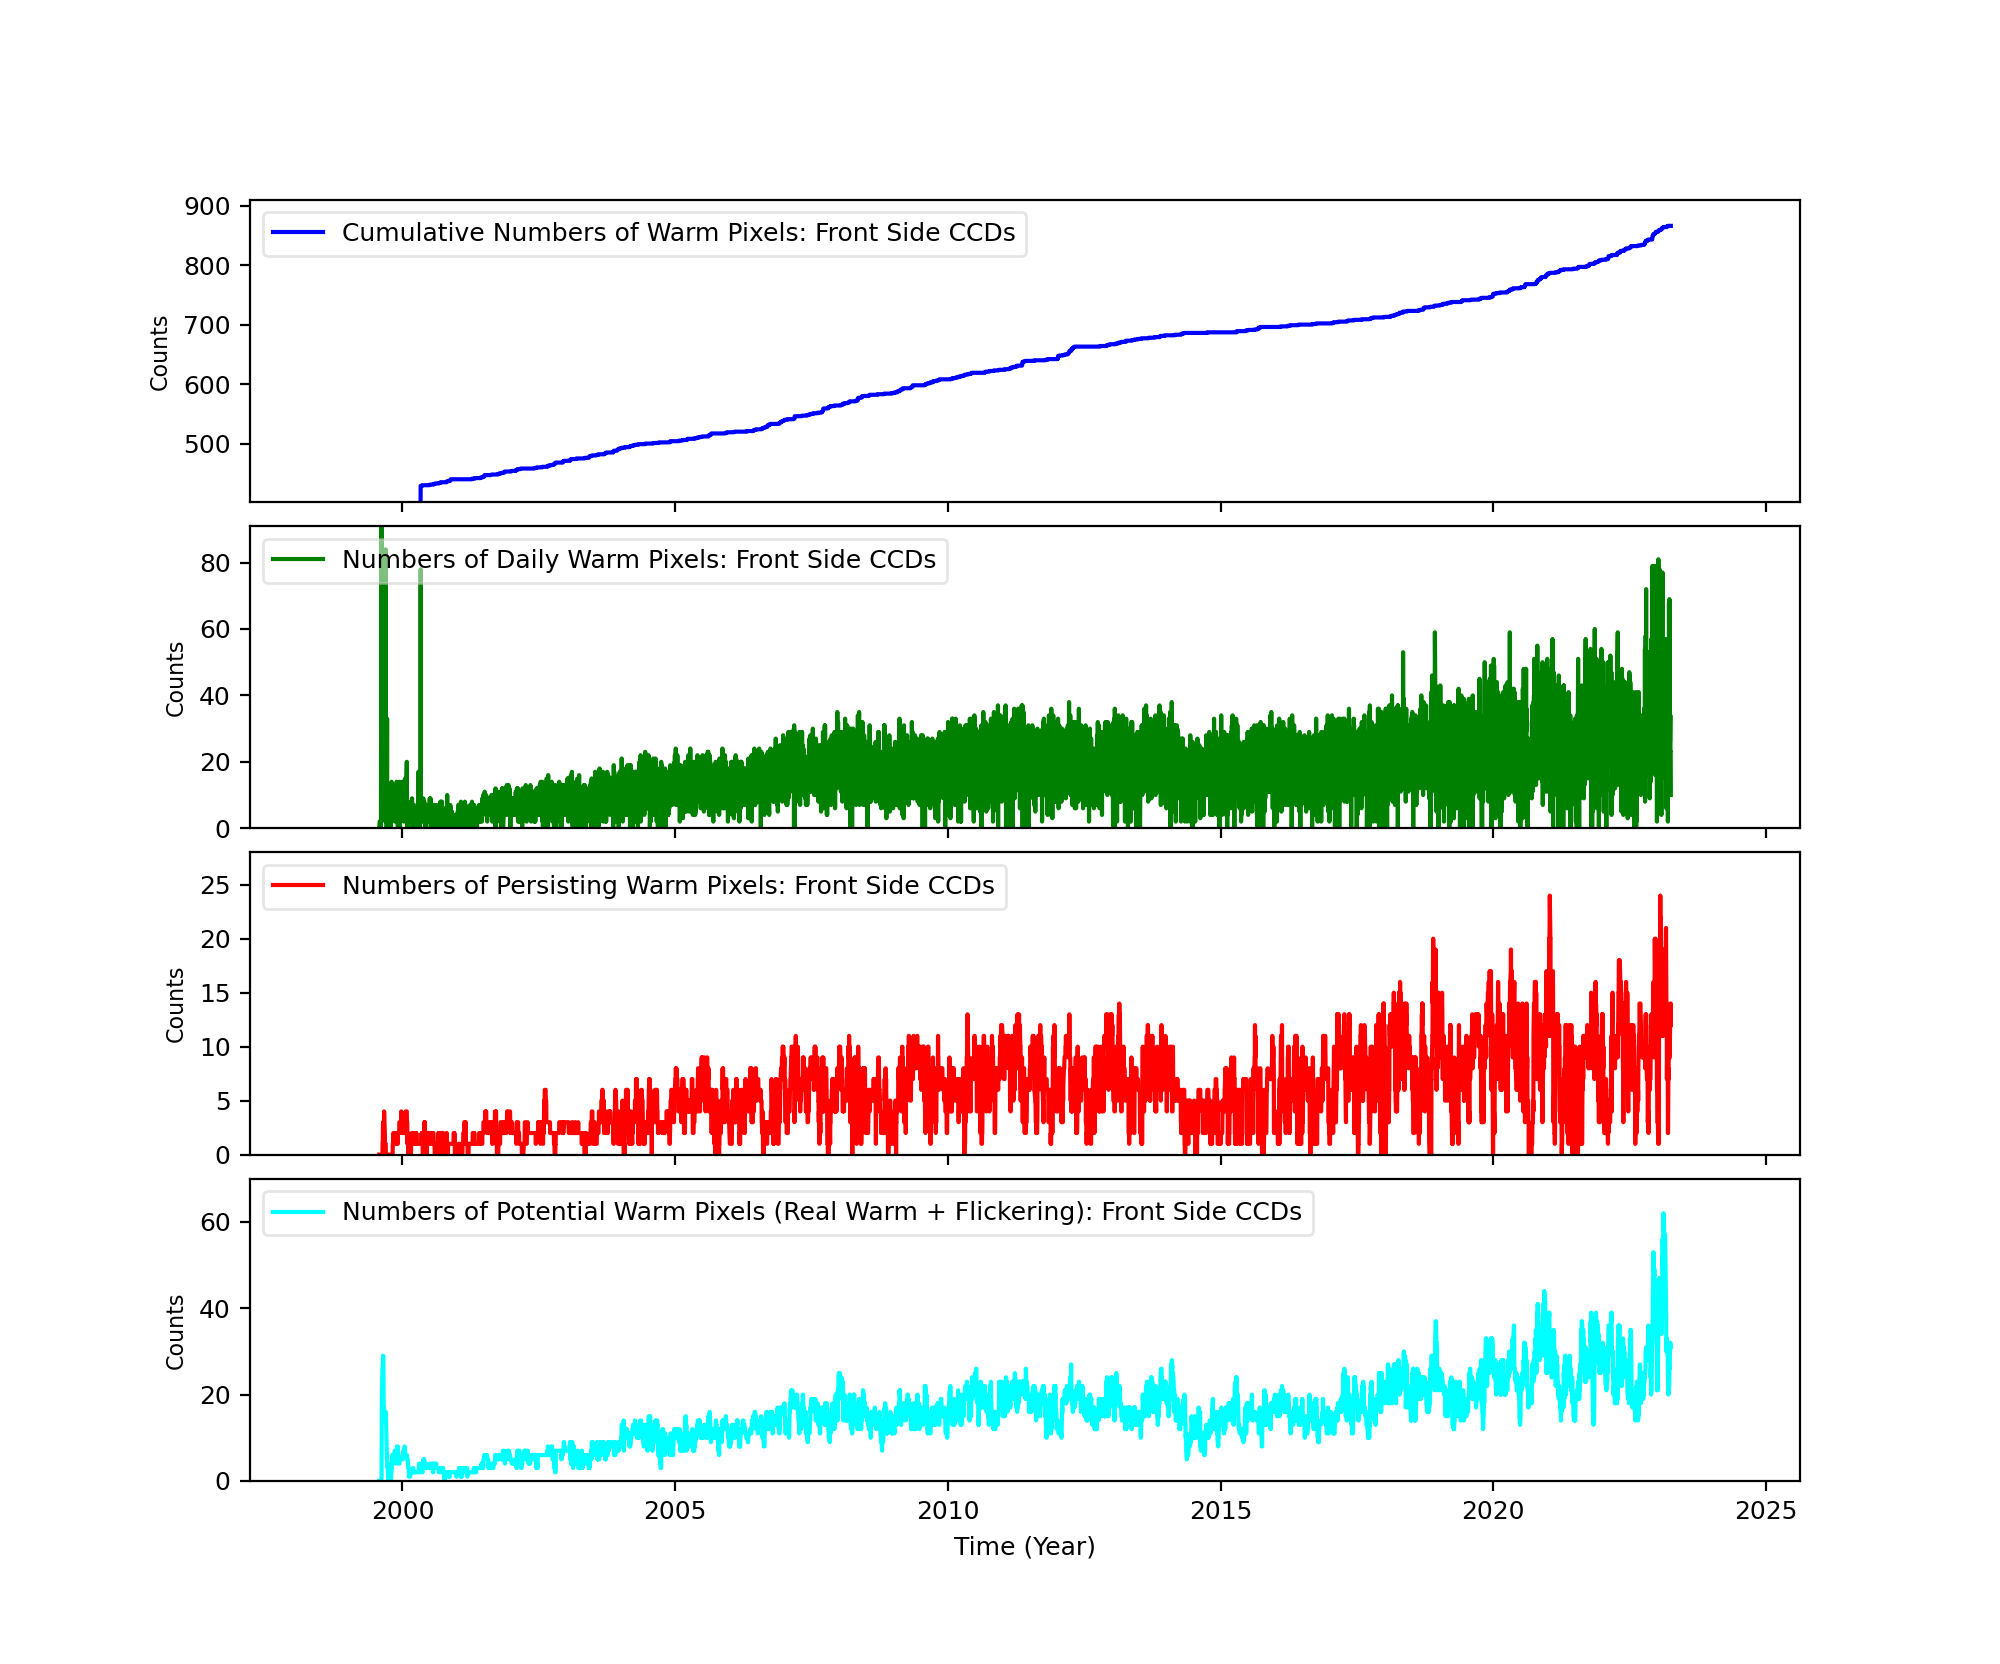
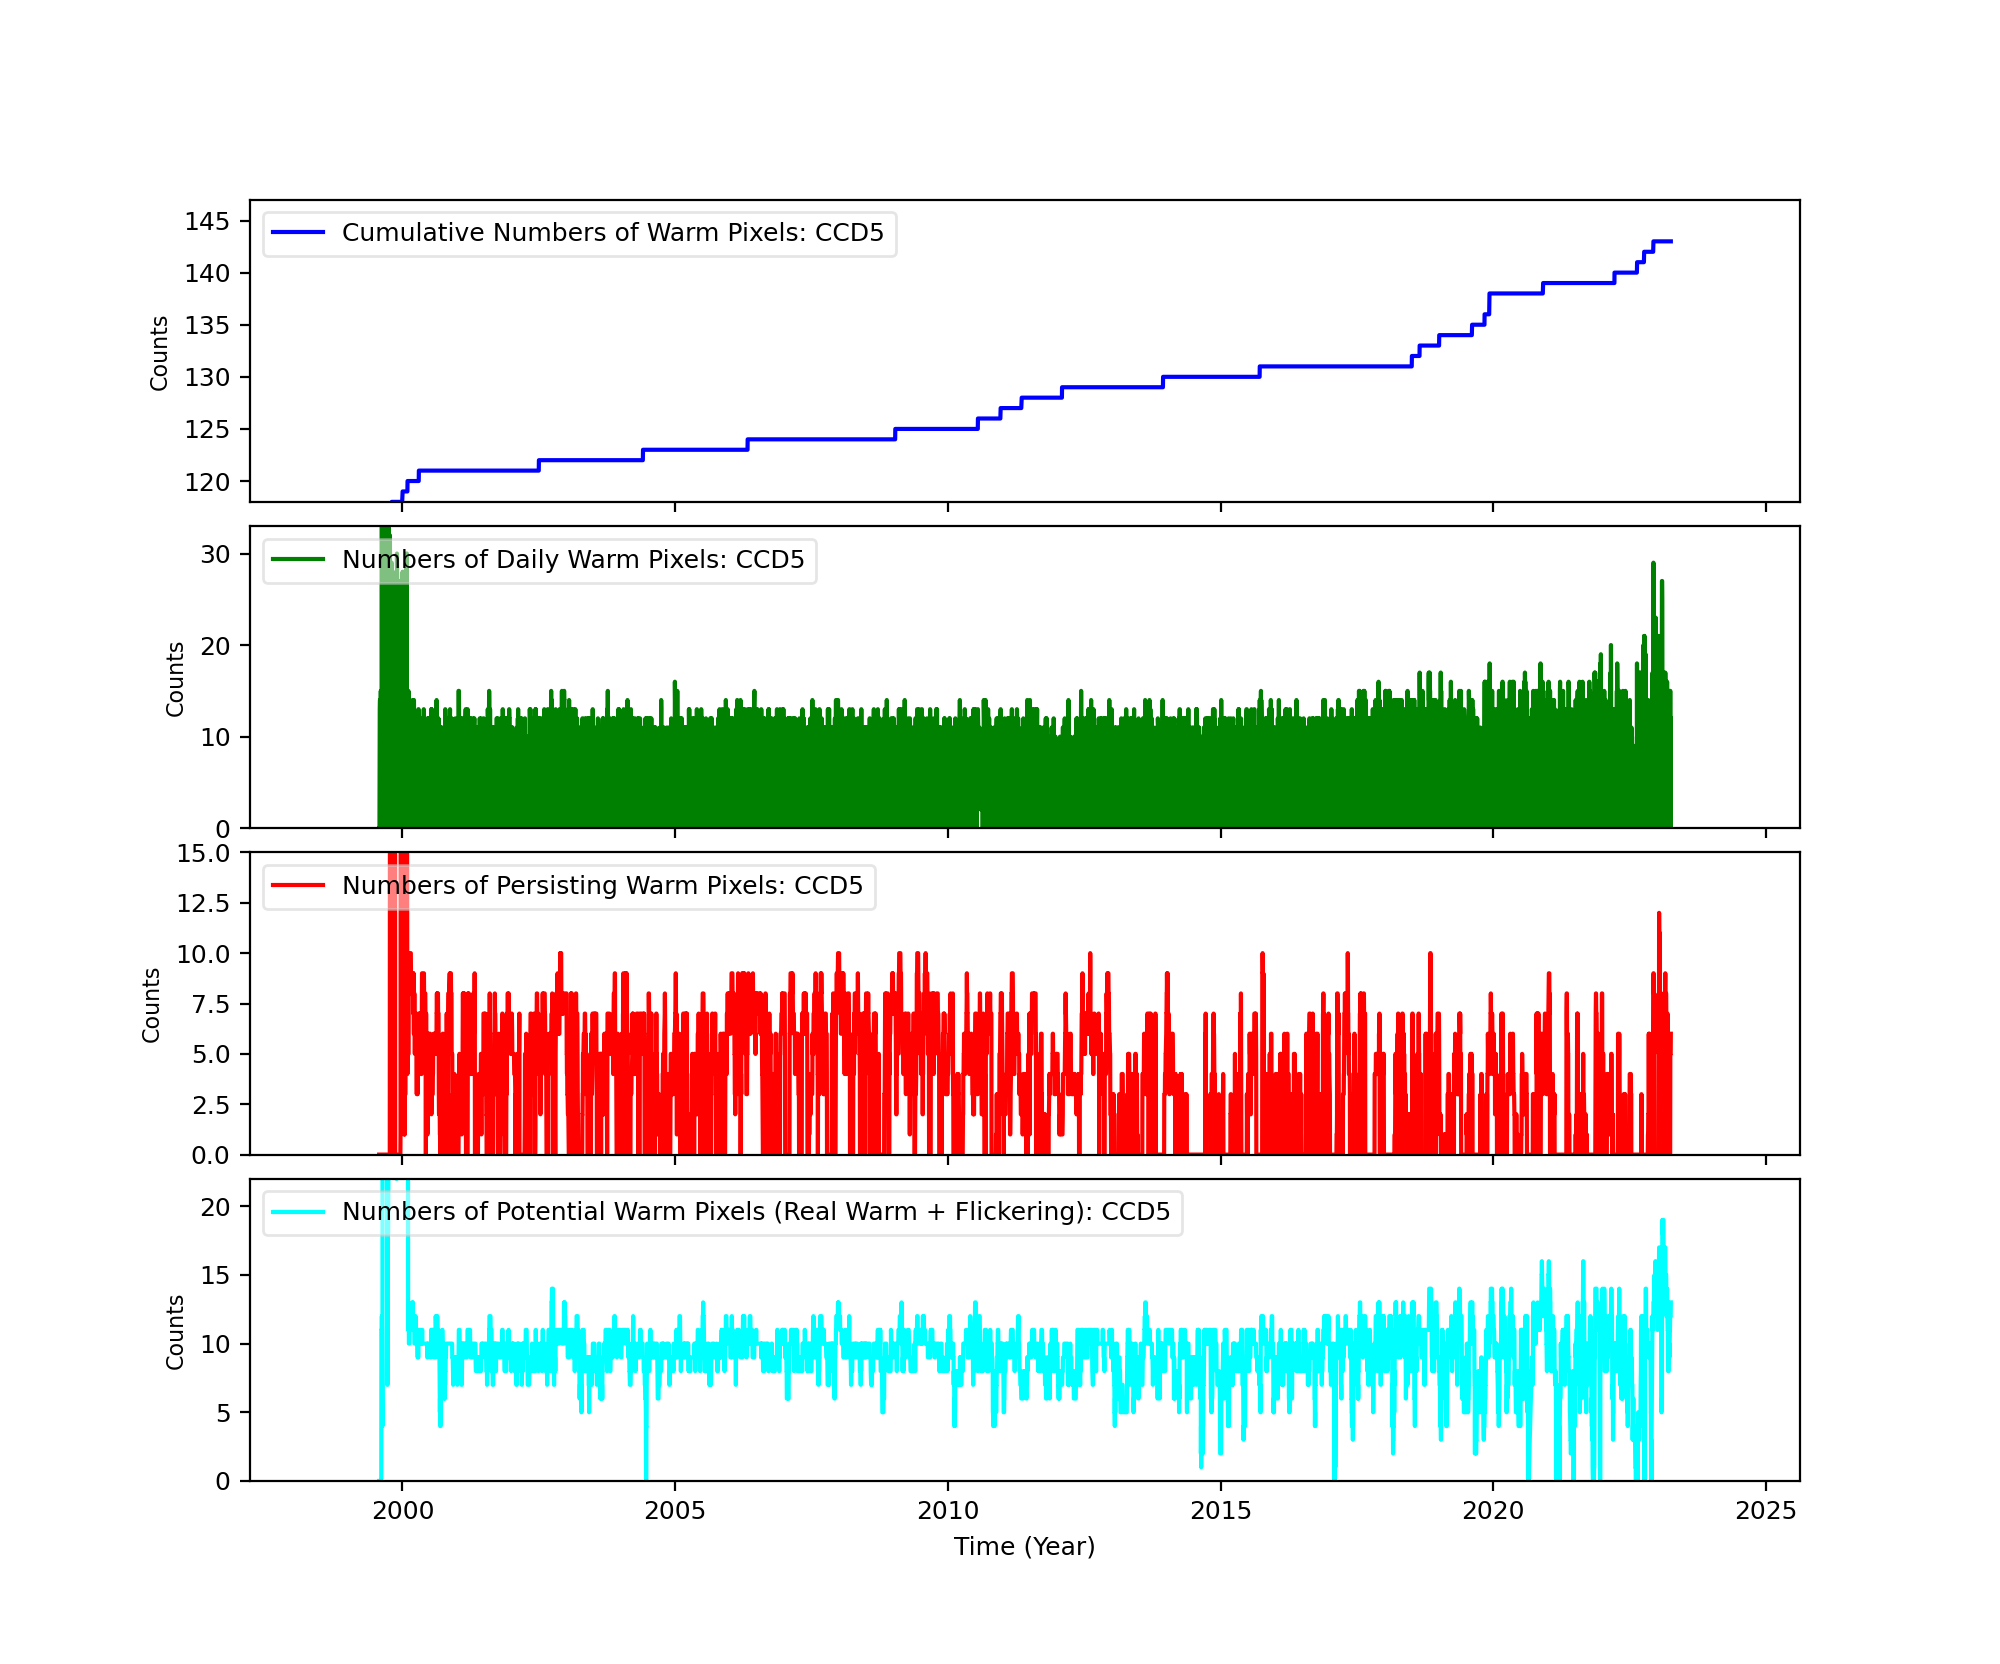
Bad Pixels
The plots below were generated with a new warm pixel finding script. Please see Acis Bad Pixel Page for details.
Front Side CCDs
Back Side CCD (CCD5)
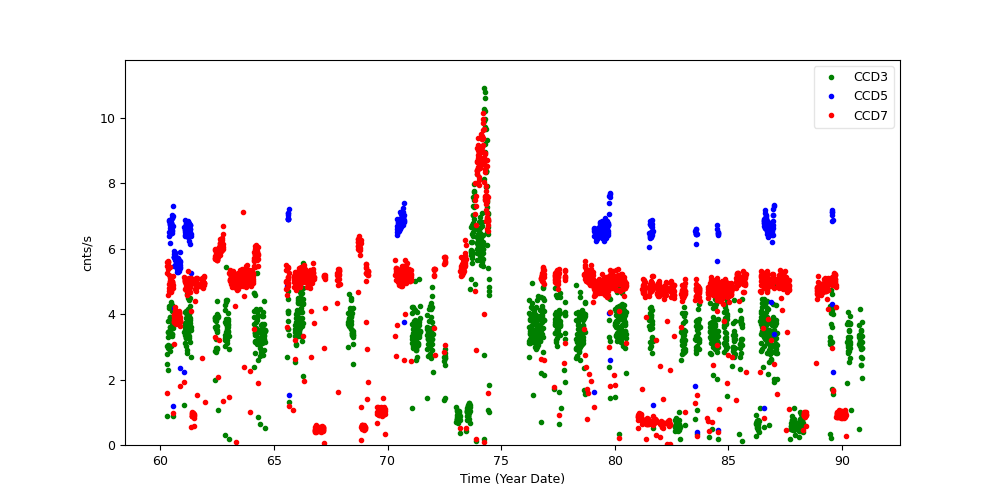
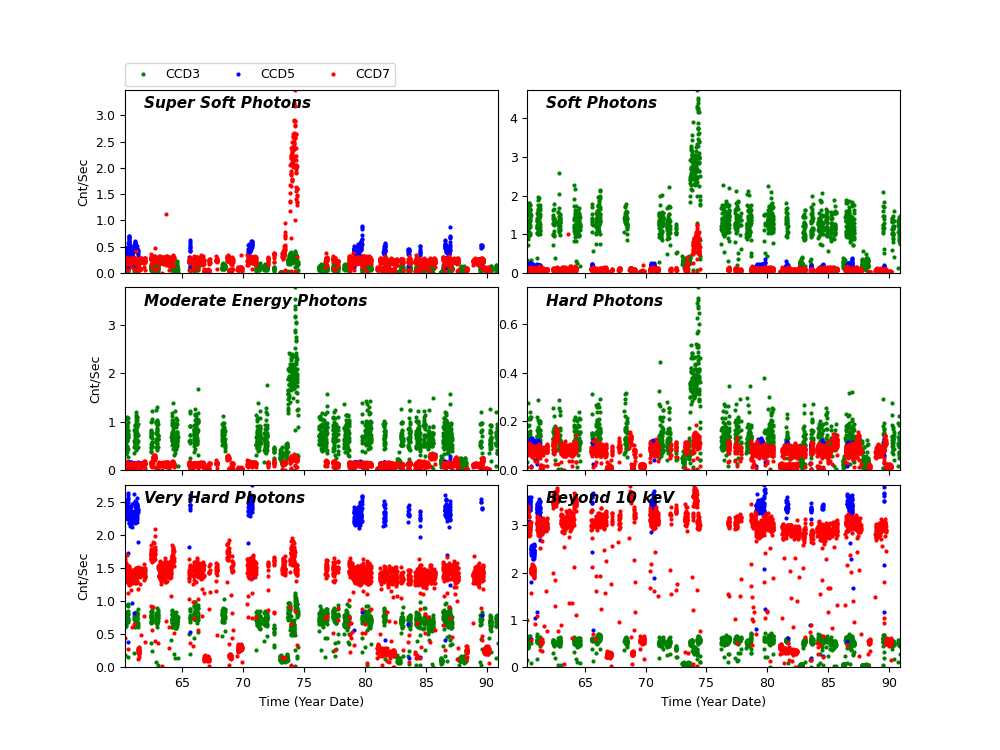
Science Instrument Background Rates
| Name | Low (keV) | High(KeV) | Description |
|---|---|---|---|
| SSoft | 0.00 | 0.50 | Super soft photons |
| Soft | 0.50 | 1.00 | Soft photons |
| Med | 1.00 | 3.00 | Moderate energy photons |
| Hard | 3.00 | 5.00 | Hard Photons |
| Harder | 5.00 | 10.00 | Very Hard photons |
| Hardest | 10.00 | Beyond 10 keV |
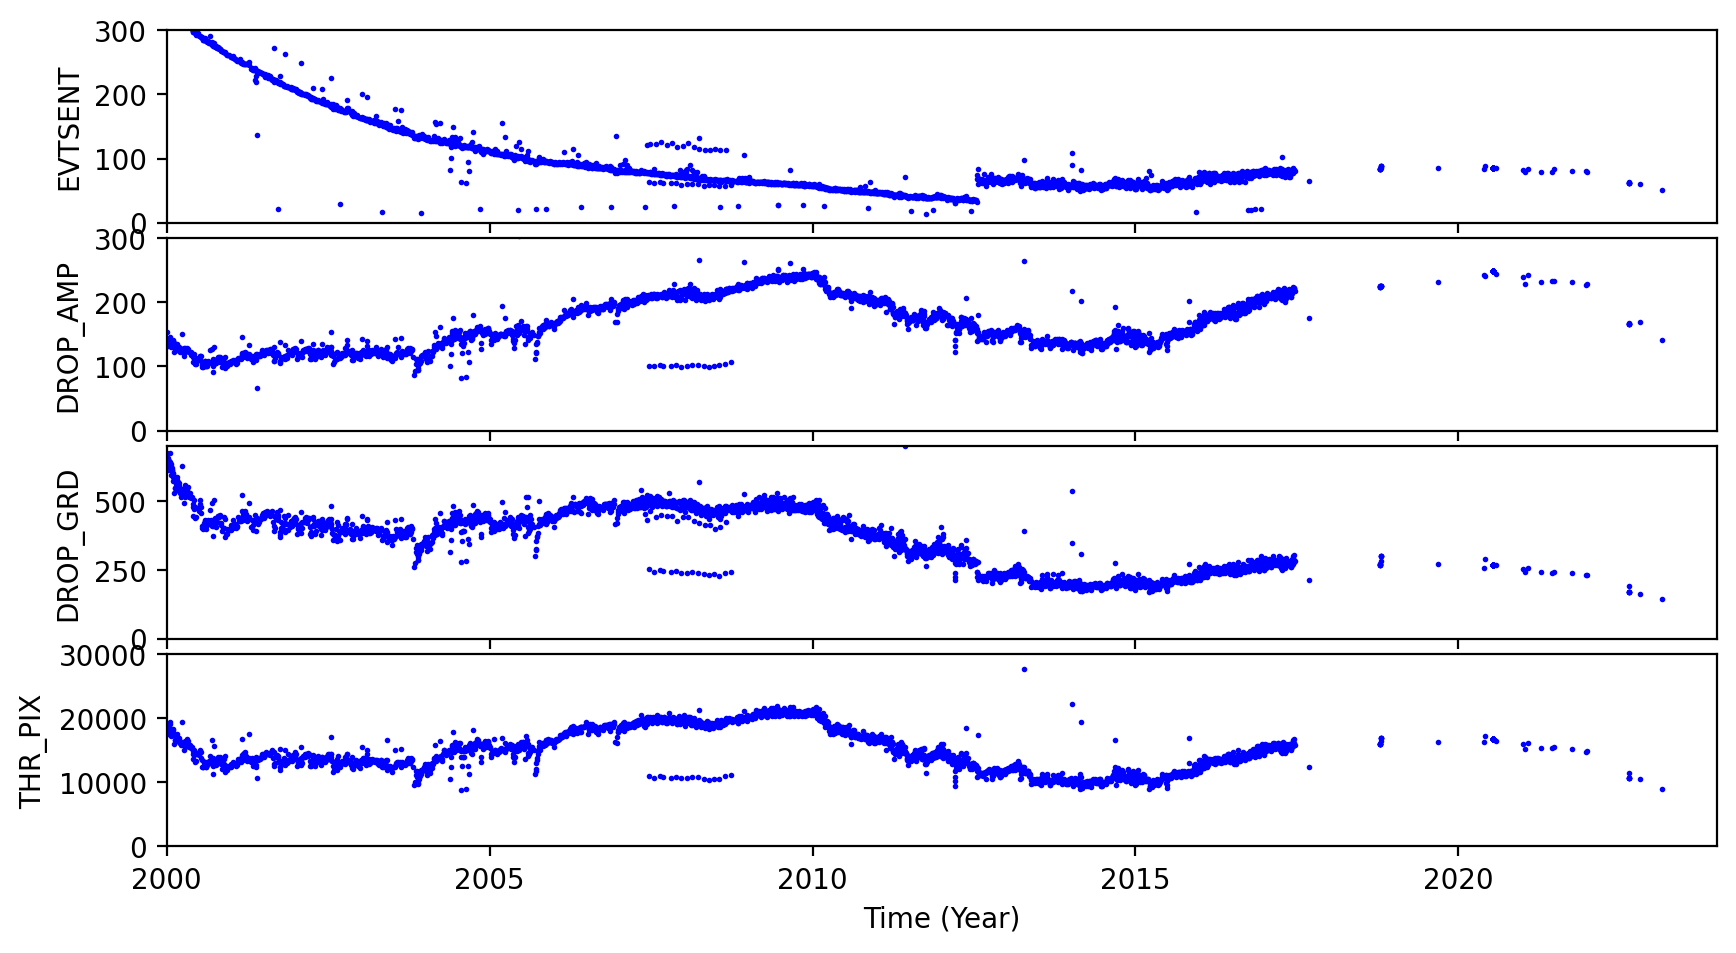
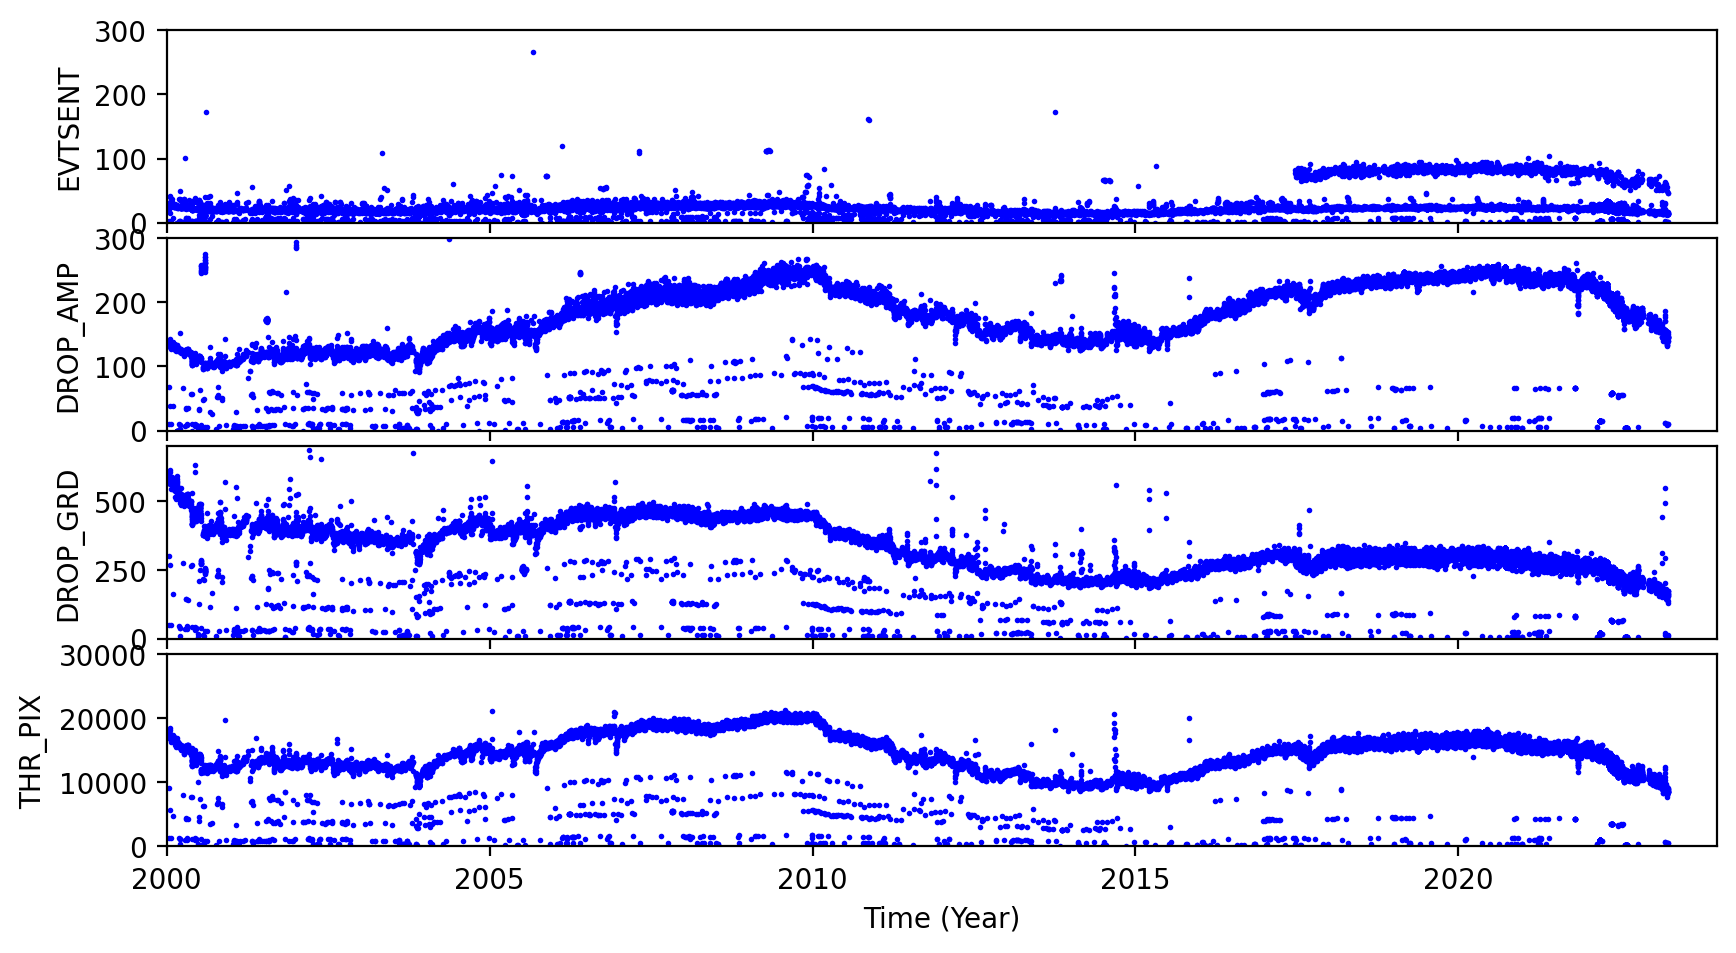
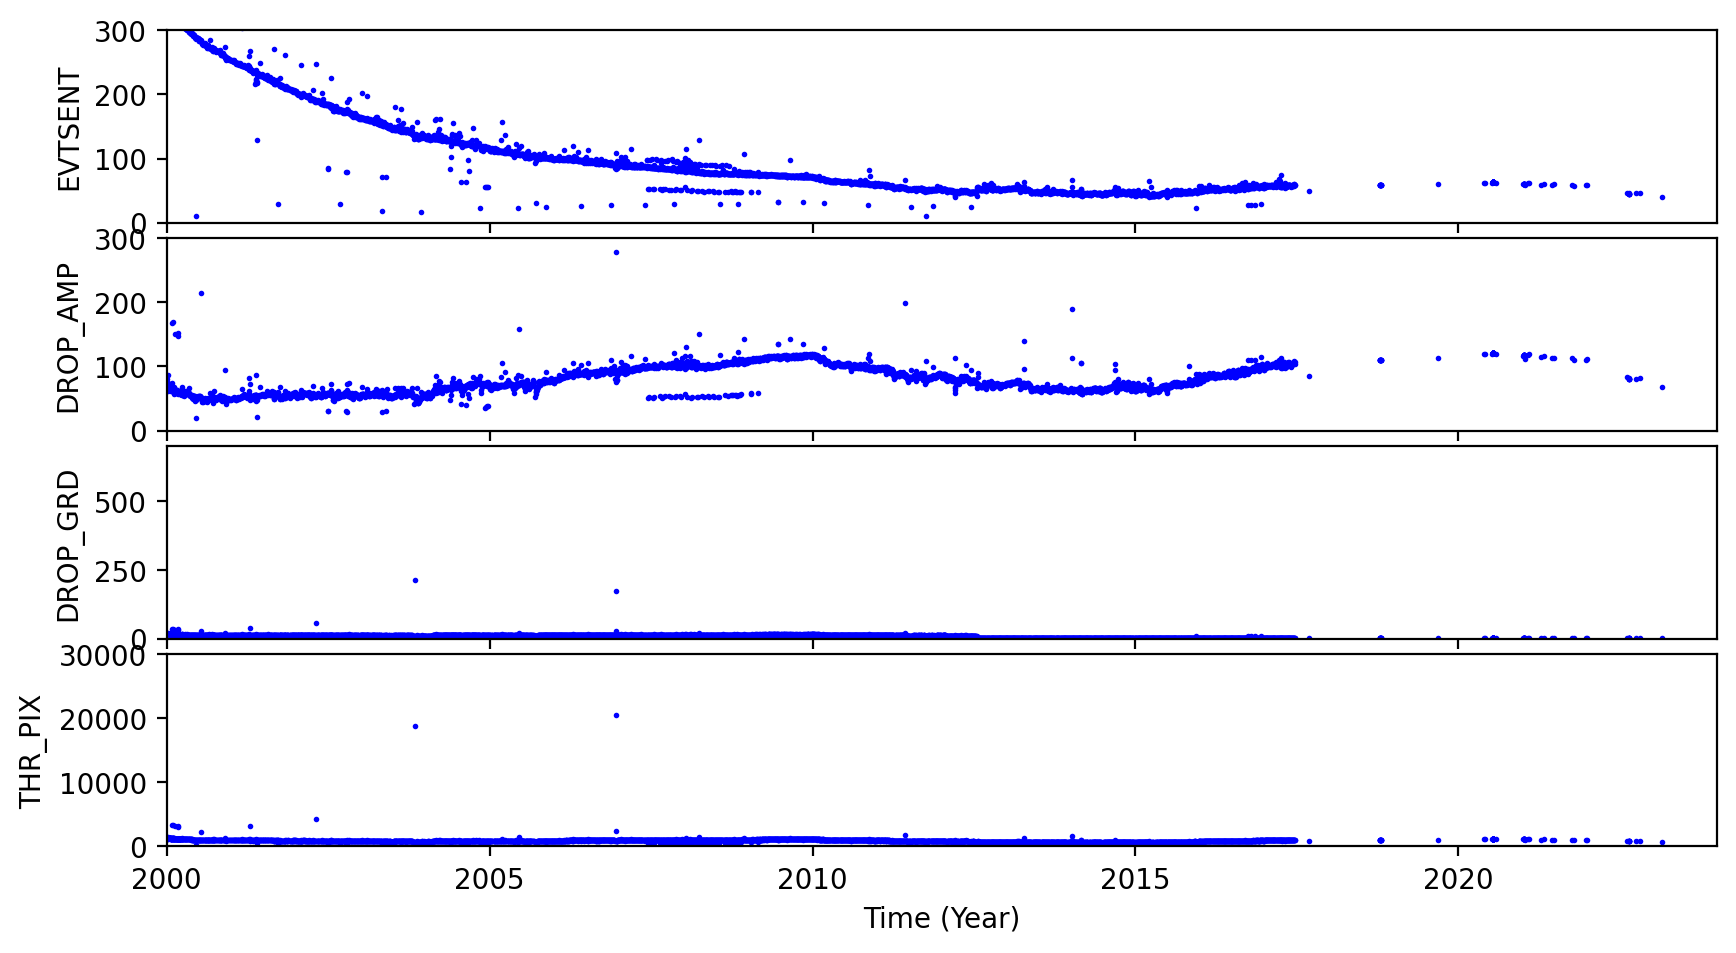
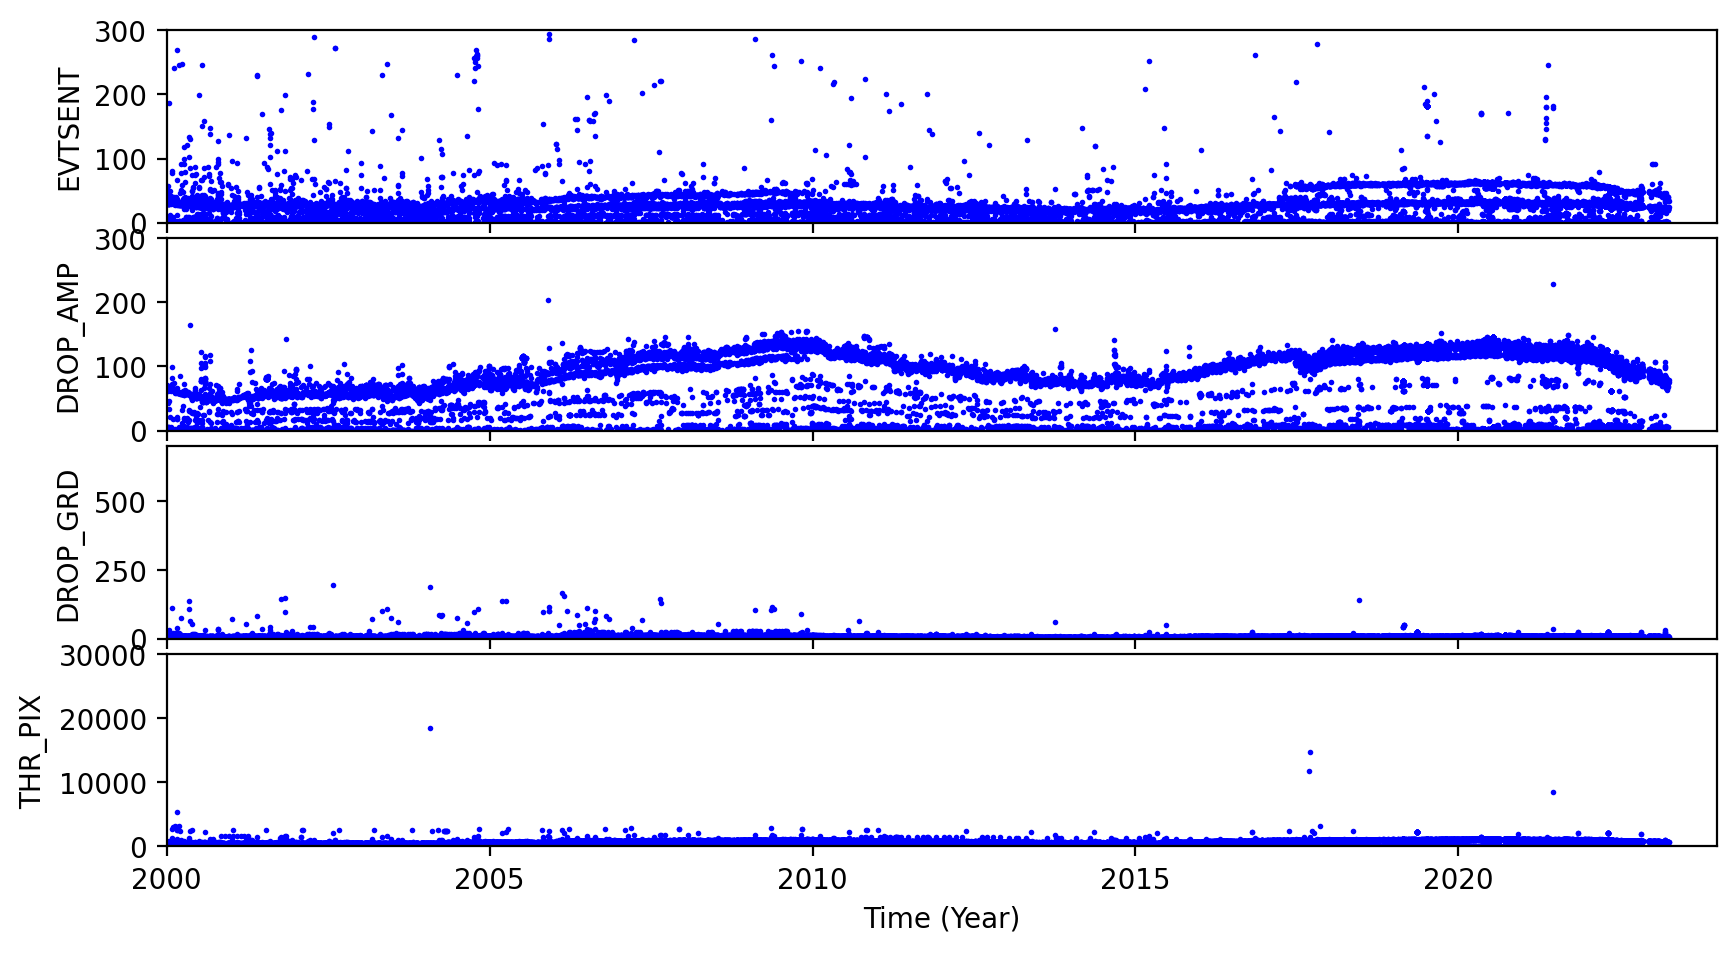
ACIS Rejected Events
The links below are plots of stat1 quantities, showing on-board rejected events. The average EVTSENT, DROP_AMP, DROP_POS, DROP_GRD, THR_PIX, and maximum BERR_SUM obtained from L1 acis*stat1.fits files are plotted for each observation. CTI observations are plotted separately from regular science observations.
Column definitions:
- EVTSENT - number of events sent in data record
- DROP_AMP - number of discarded events due to corrected amplitude
- DROP_POS - number of discarded events due to CCD position
- DROP_GRD - number of discarded events due to grade code
- THR_PIX - number of pixels above respective threshold level
- BERR_SUM - number of pixel bias errors so far in science run
Note the half-life decline of the CTI source is clearly evidenced in the steady janline of EVTSENT.
CCD3 Observations
| CTI | Science |
|
|
|---|
CCD7 Observations
| CTI | Science |
|
|
|---|
ACIS Gain Trends
We computed ACIS gain and offset from ACIS event1 files used in CTI computation, following the step described by C. Grant ACIS gain @ -120C page.
Instead computing gains and offsets from individual observations, we combined all data from each month and computed an monthly averaged gain and offset.
The following plots show CCD3 and CCD5 gains and offset trends.
| CCD 3 | |
)
|
)
|
| CCD 5 | |
)
|
)
|
[an error occurred while processing this directive]
HRC
DOSE of Central 4K Pore-Pairs
Please refer to Maximum Dose Trends for more details.
No Data
)
IMAGE                       NPIX      MEAN    STDDEV      MIN       MAX
HRCI_08_1999_03_2023.fits  16777216	na	na	na	na
No Data
)
IMAGE                       NPIX      MEAN    STDDEV      MIN       MAX
HRCS_08_1999_03_2023.fits  16777216	na	na	na	na
|
|
Max dose trend plots corrected for events that "pile-up"
in the center of the taps due to bad position information.
|
)
|
)
|
)
|
)
|
| Dec 2022 | Sep 2022 | Jun 2022 | Mar 2022 |
|---|
)
|
)
|
)
|
)
|
| Dec 2022 | Sep 2022 | Jun 2022 | Mar 2022 |
|---|
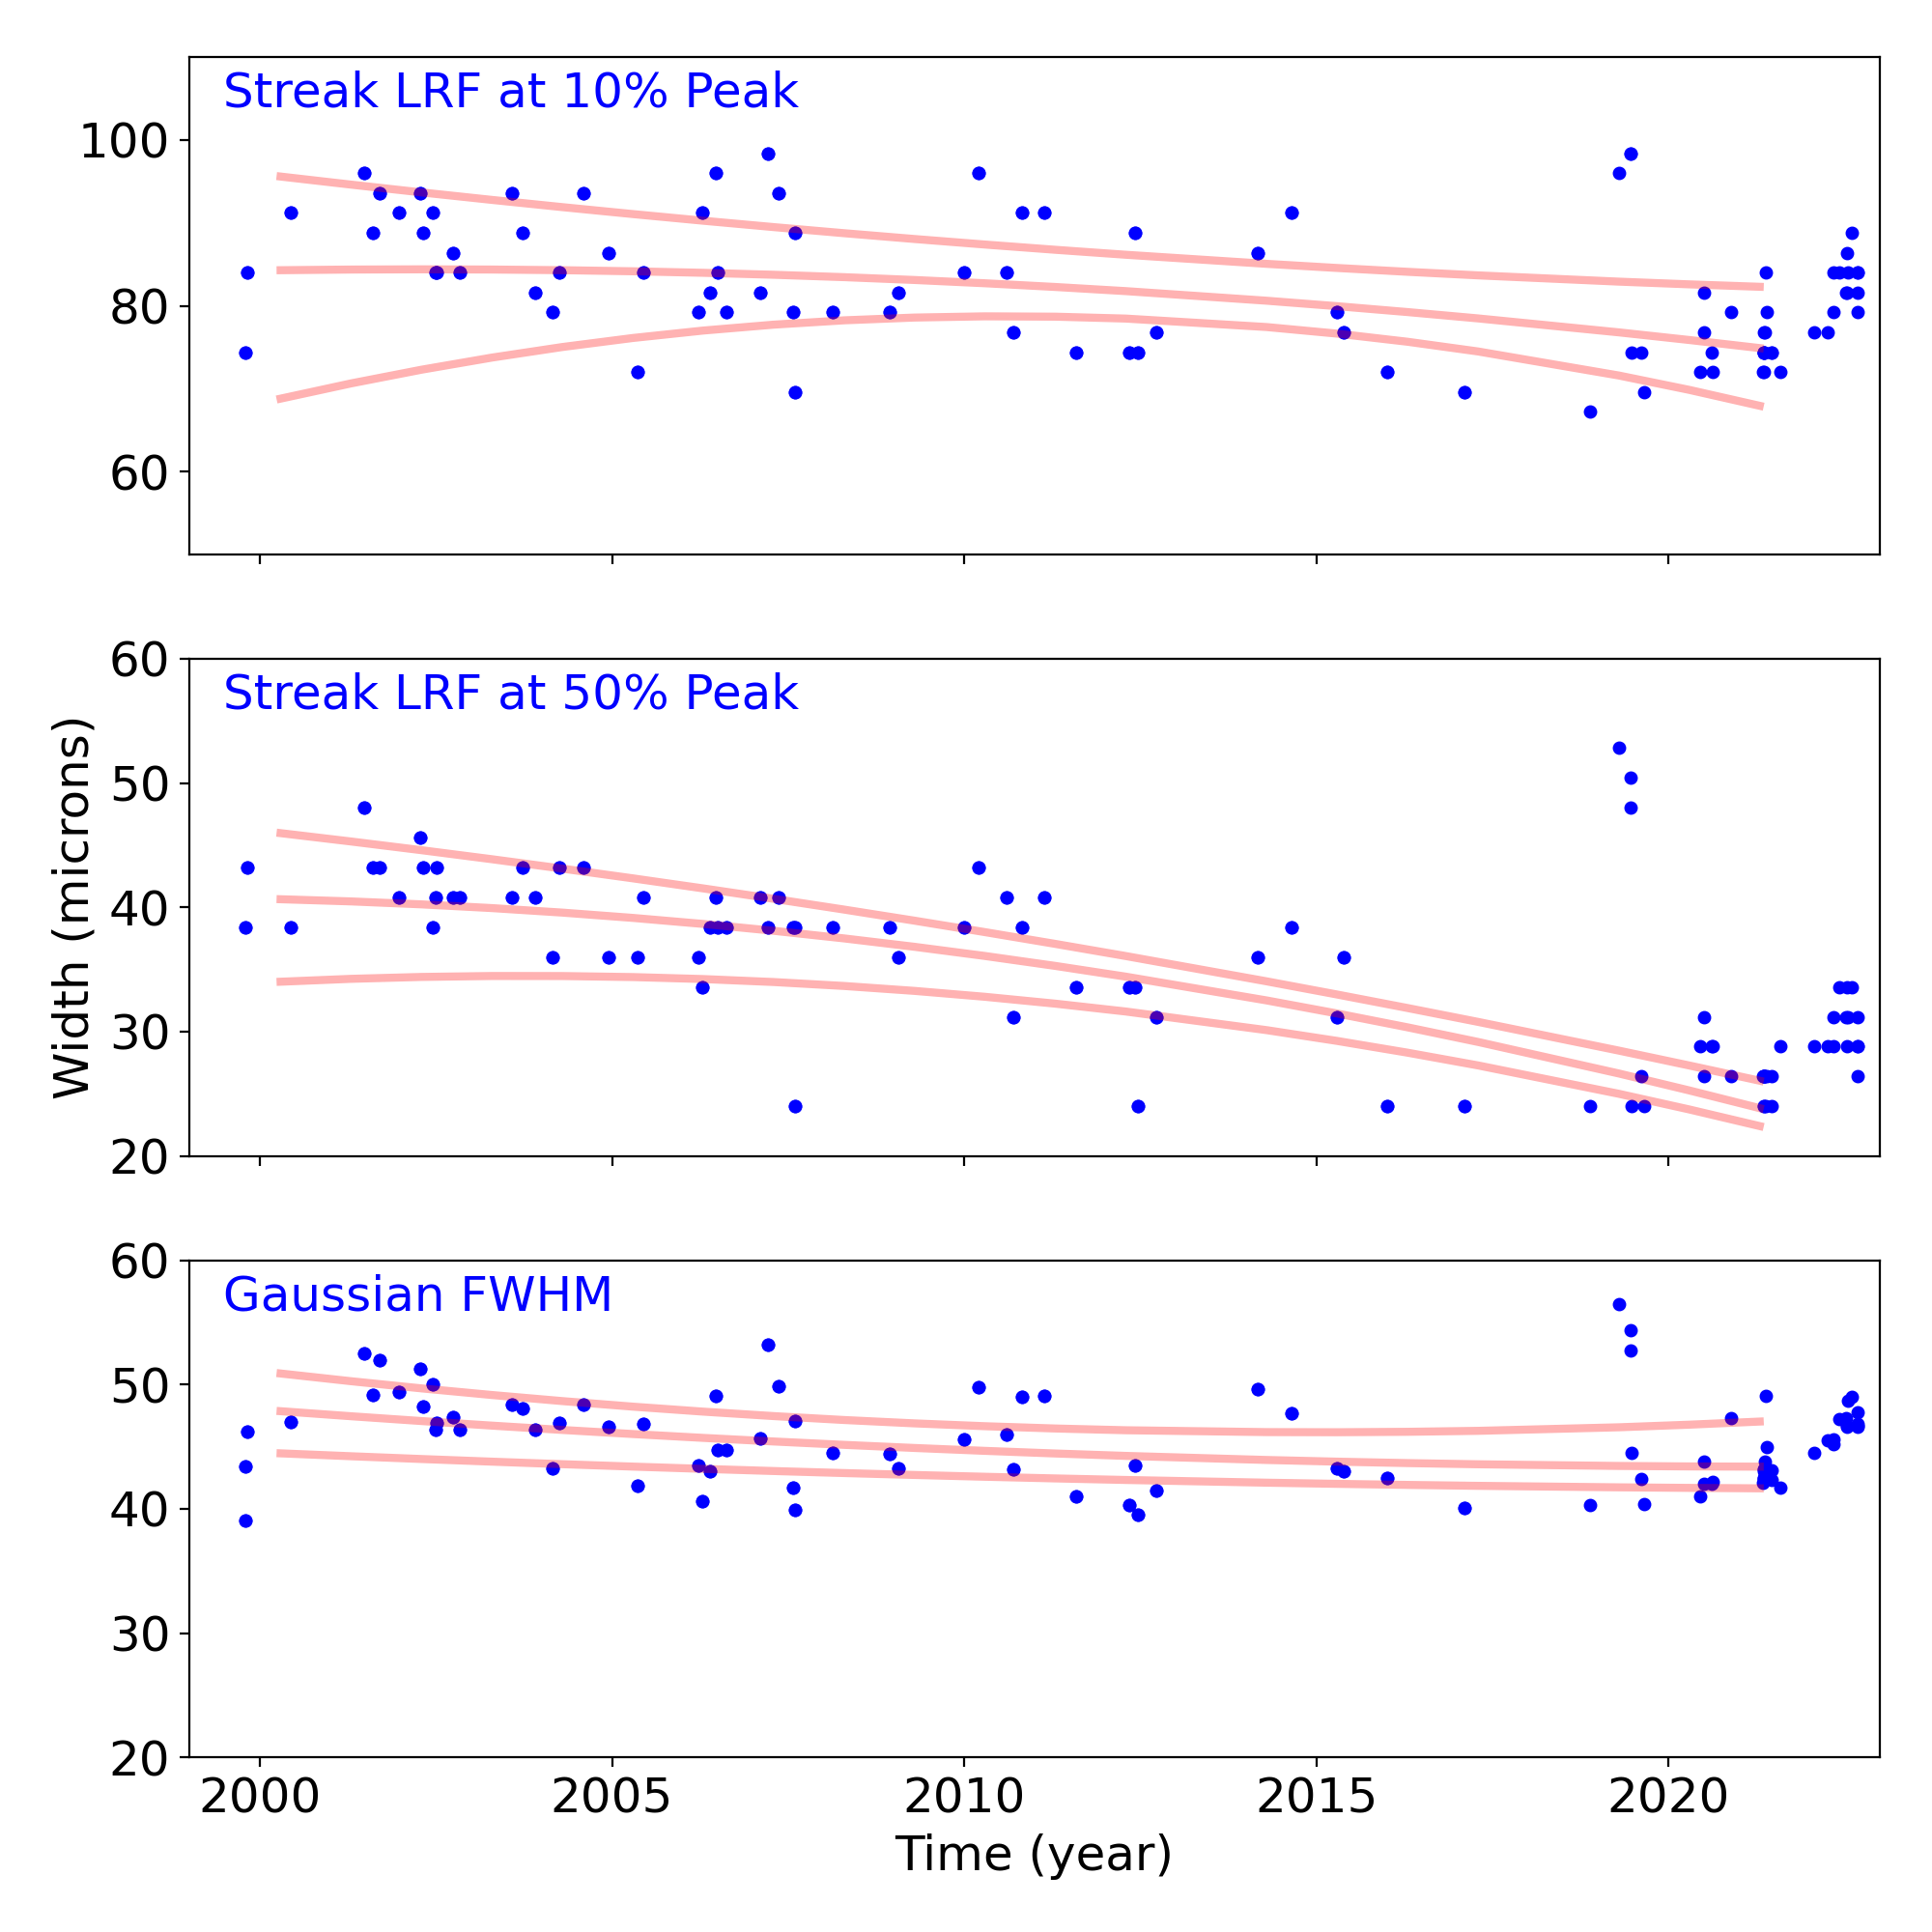
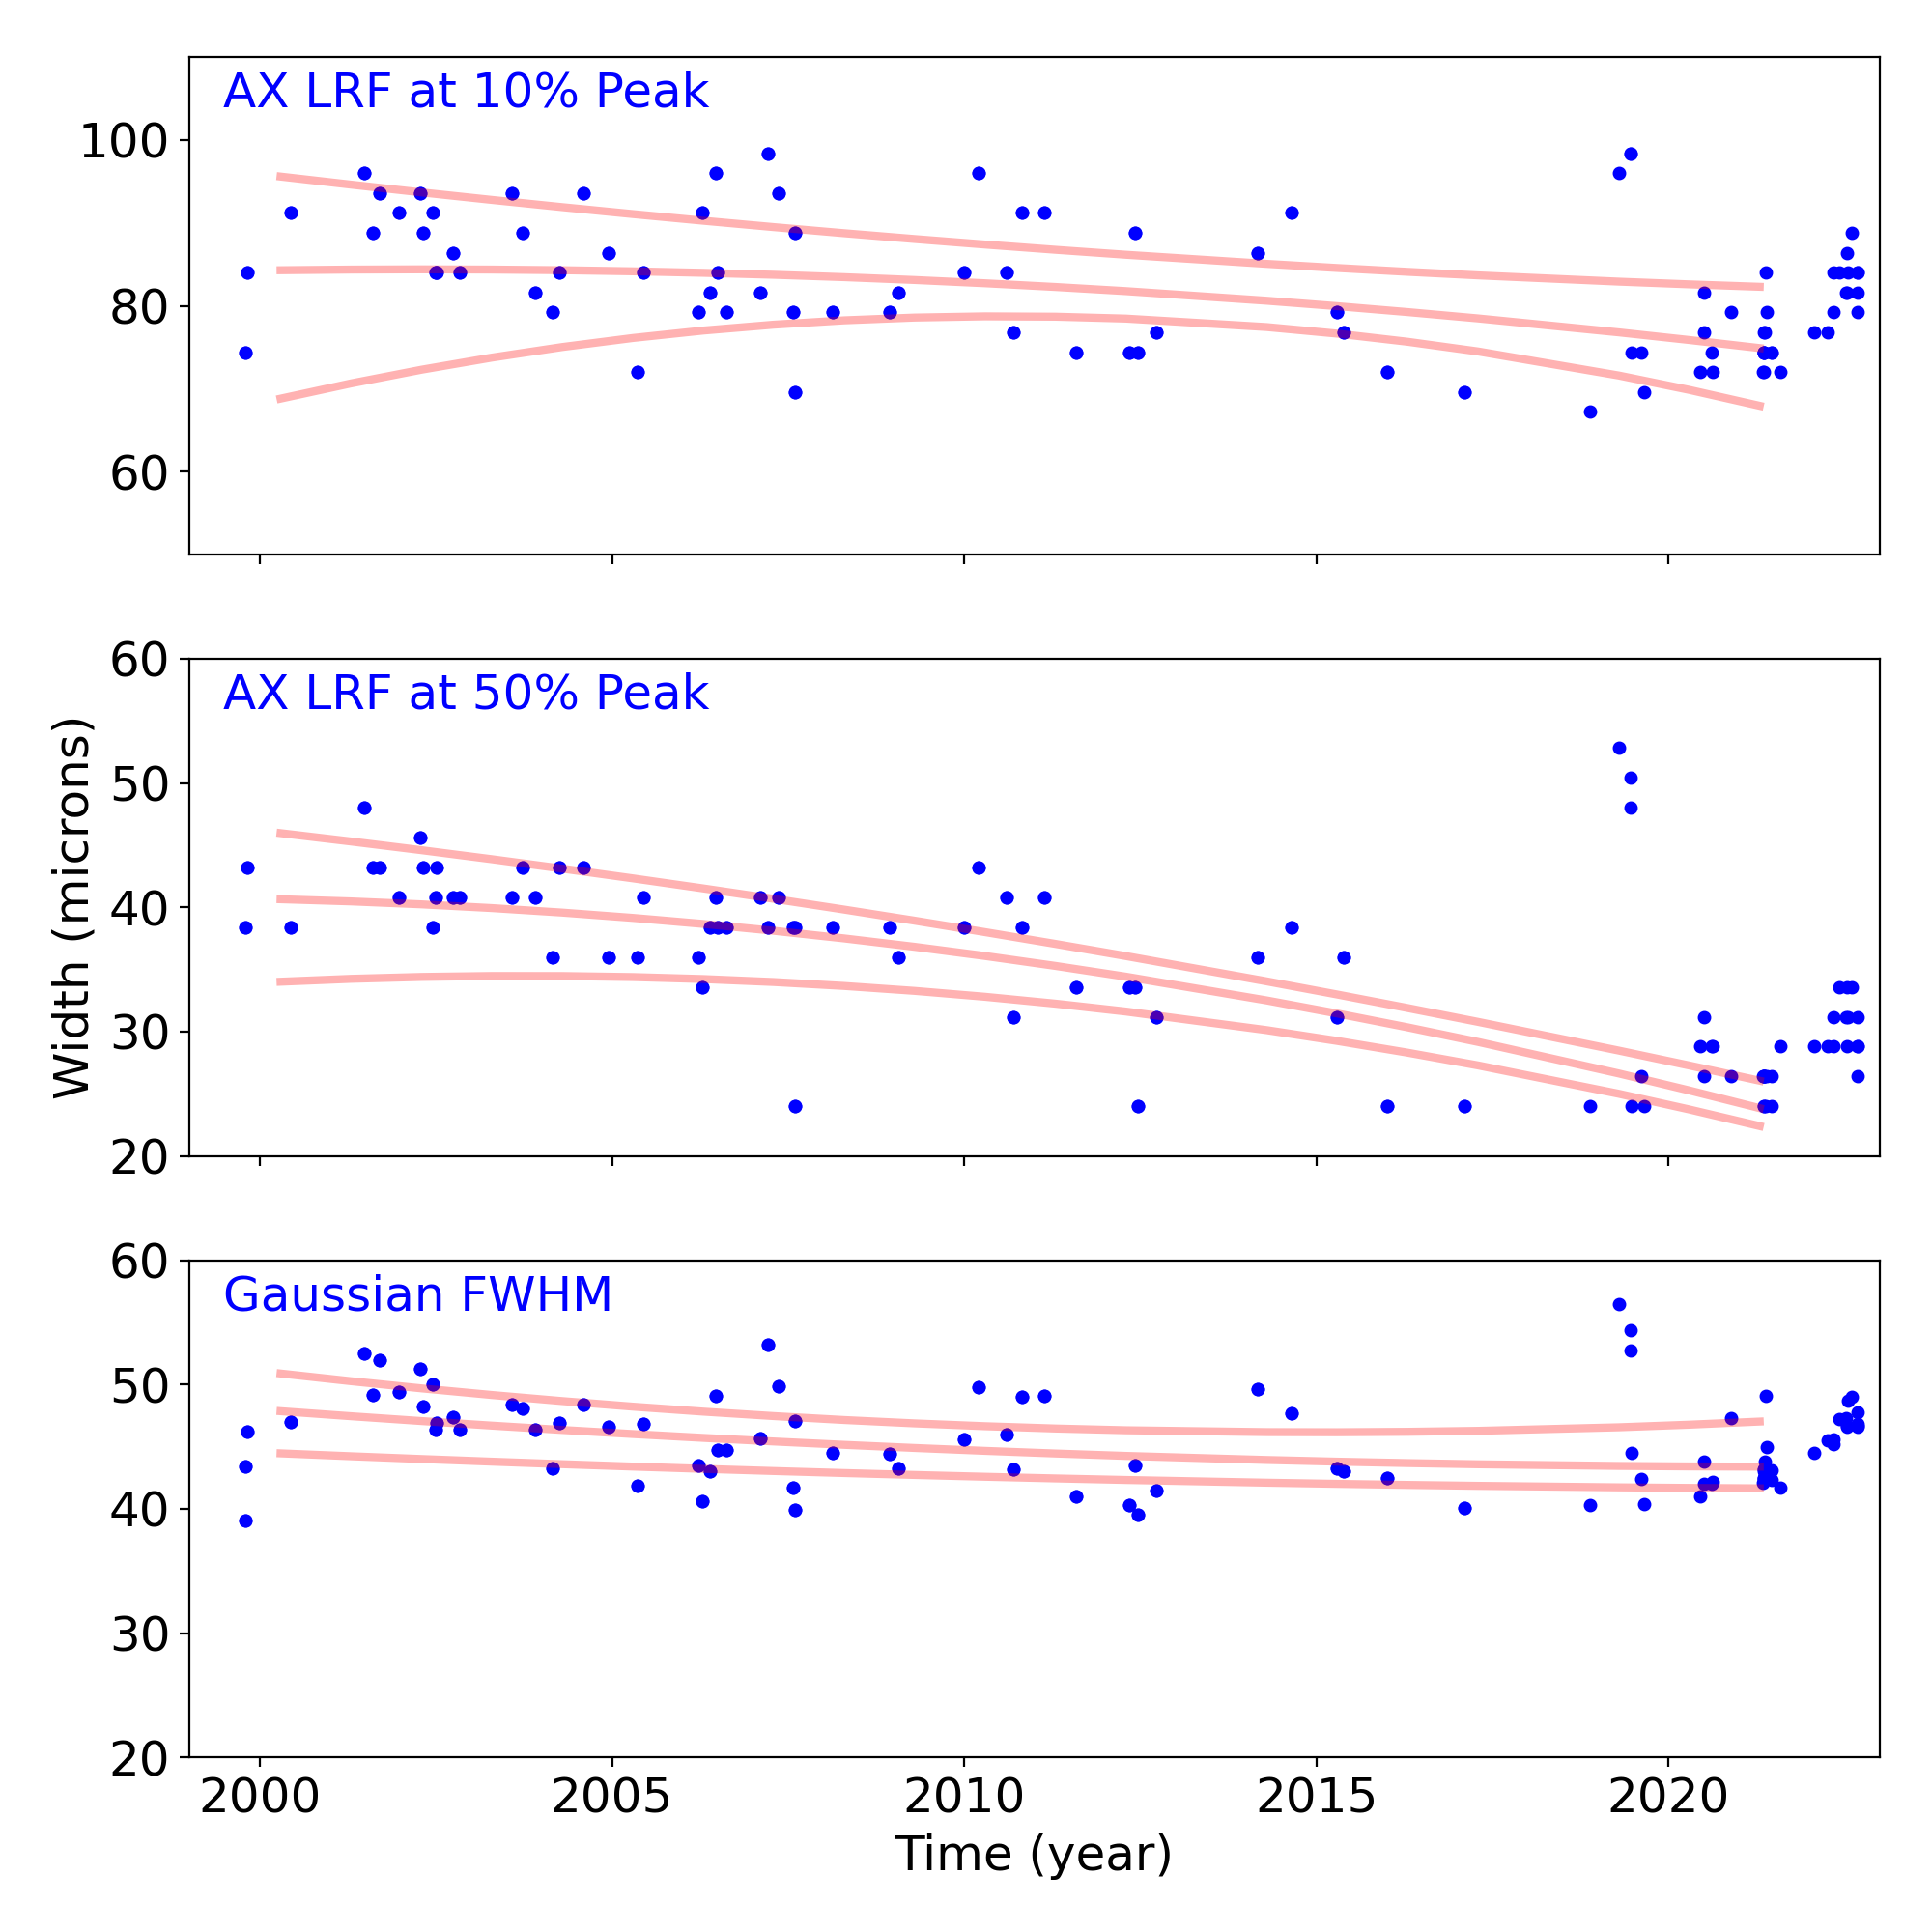
Gratings
Grating Trends/Focus
We plot the width of the zero order streak of ACIS/HETG observations and the width of the zero order image for HRC/LETG observations of point sources. No significant defocusing trend is seen at this time. See Gratings Trends pages.
PCAD
ACA Trending
| ACIS |
)
|
)
|
)
|
|
|---|---|---|---|---|
)
|
)
|
)
| ||
| HRCI |
)
|
)
|
)
|
)
|
| HRCI |
)
|
)
|
)
|
)
|
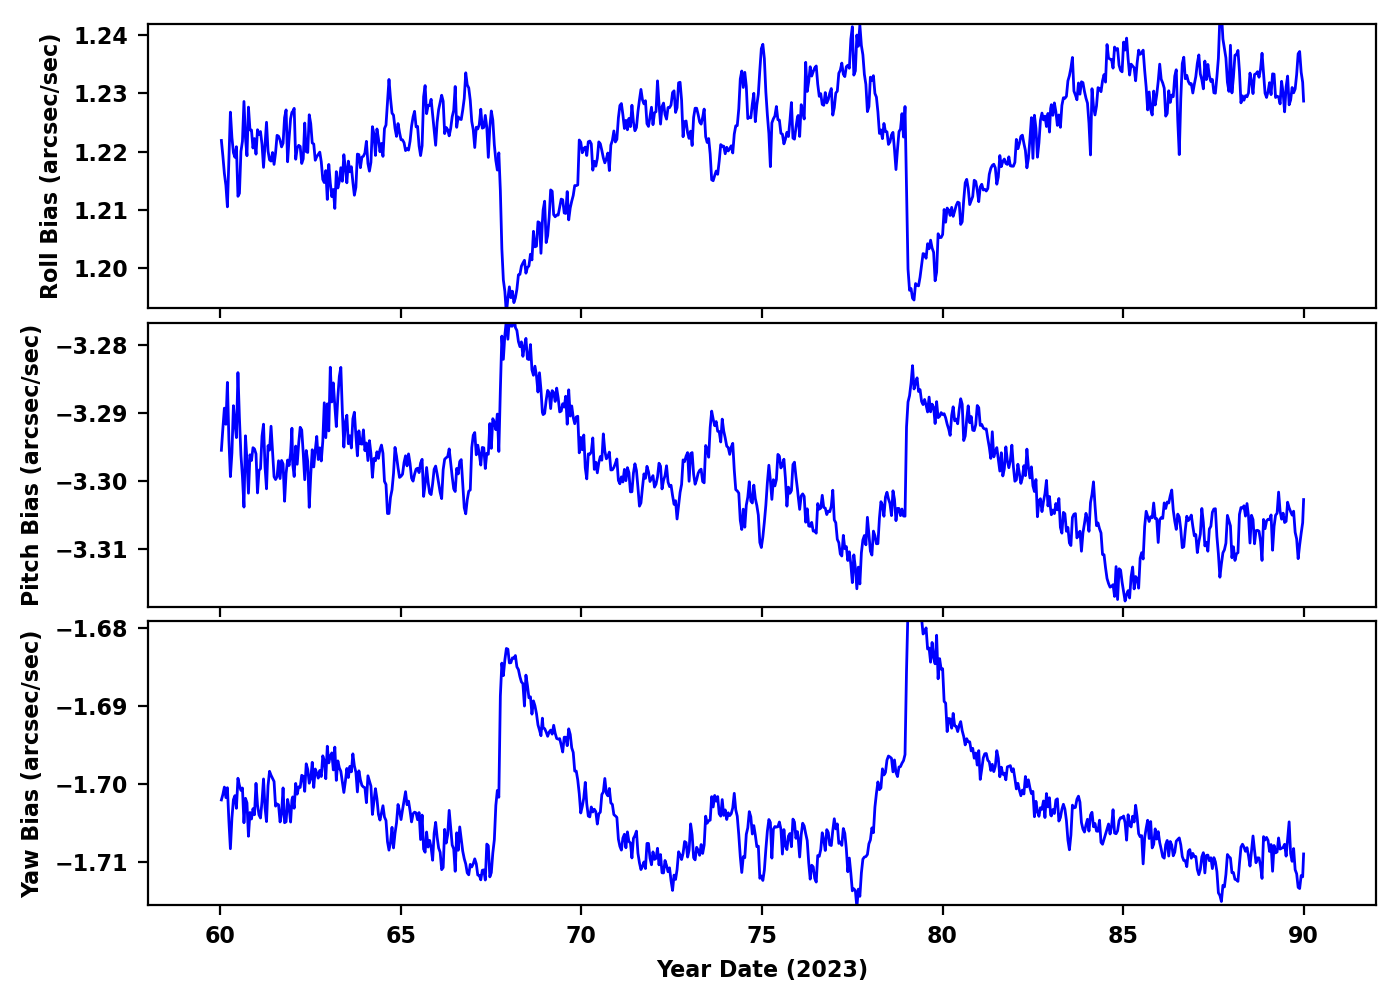
Gyro Bias Drift
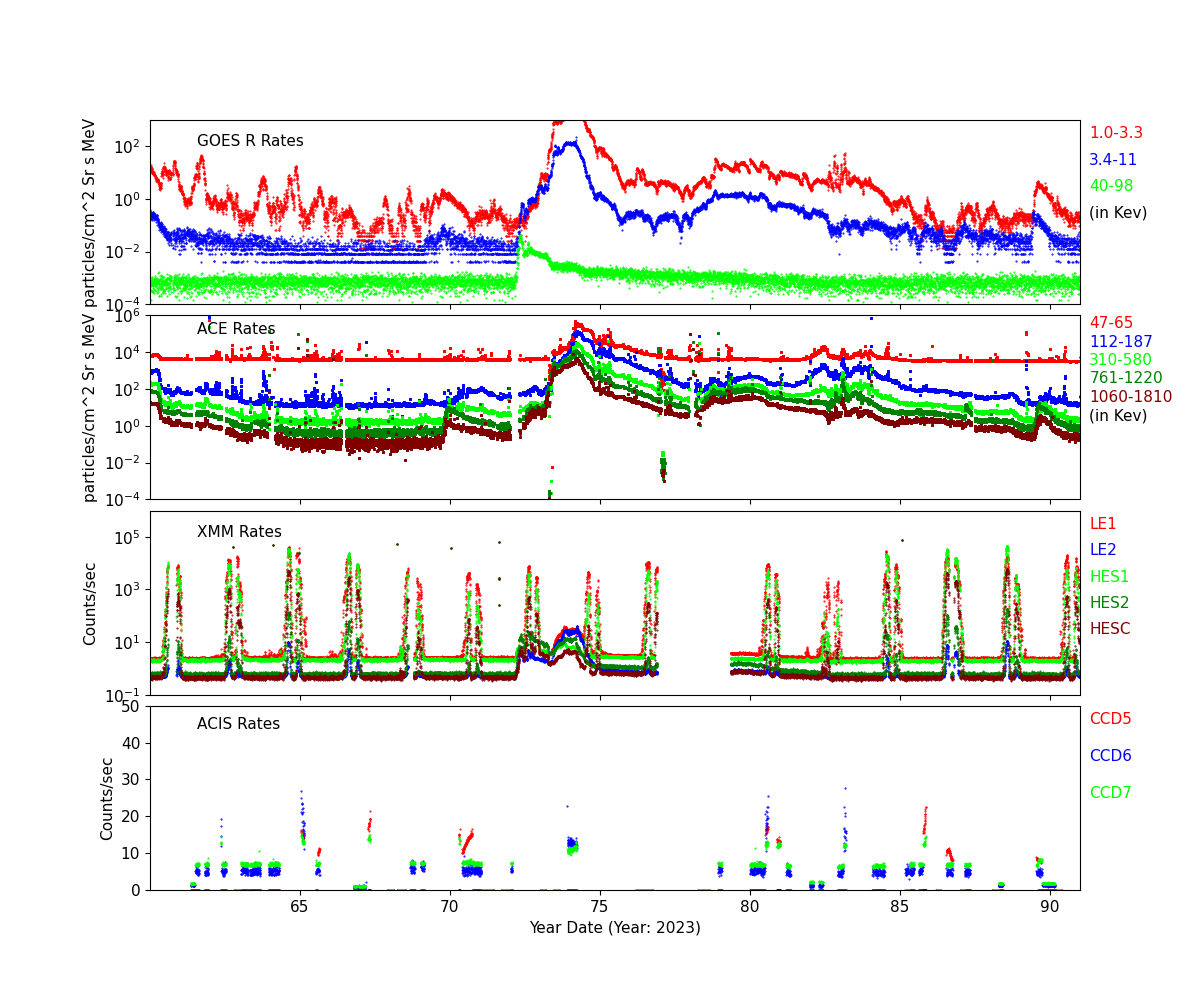
Radiation History
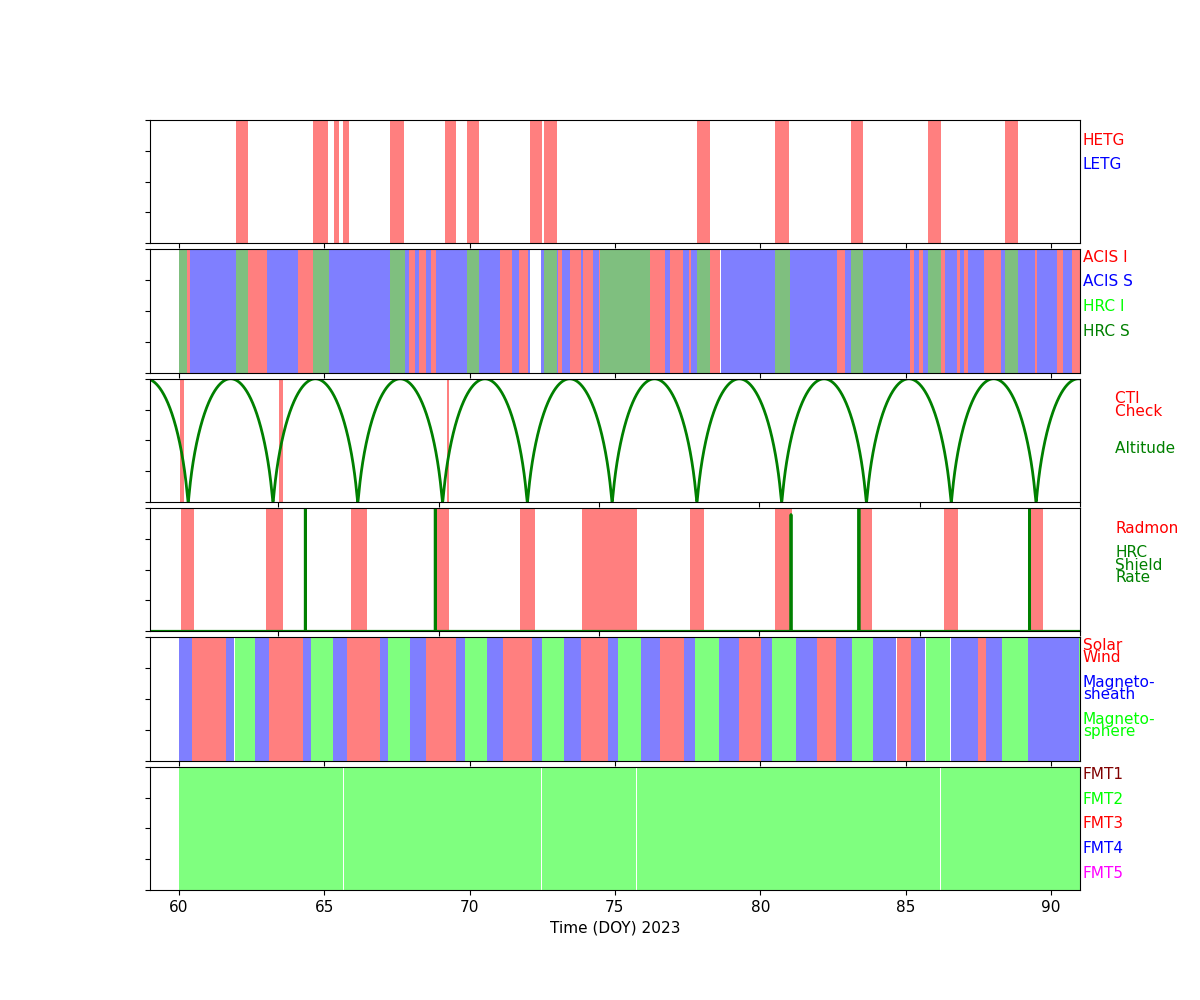
Radiation Count Rates of Mar 2023
Sun Spot History (See:NOAA Page)

-->
Trending
Critical Trends
| ACIS Temperatures - Daily Maximums | |||||||
|---|---|---|---|---|---|---|---|
| MSID | MEAN | RMS | DELTA/YR | DELTA/YR/YR | UNITS | DESCRIPTION | |
| 1pdeaat | -0.025 | 0.003 | (3.02+/-0.06)e2 | -0.01 +/- 1.83 | K | PSMC DEA PS A TEMP | |
| HRMA Computed Averages - Daily Maximums | |||||||
|---|---|---|---|---|---|---|---|
| MSID | MEAN | RMS | DELTA/YR | DELTA/YR/YR | UNITS | DESCRIPTION | |
| obaavg | 0.011 | 0.001 | (2.99+/-0.03)e2 | 0.16 +/- 0.77 | TEMP | OBA/TFTE | |
| EPHIN Temperatures - Daily Maximums | |||||||
|---|---|---|---|---|---|---|---|
| MSID | MEAN | RMS | DELTA/YR | DELTA/YR/YR | UNITS | DESCRIPTION | |
| teio | -0.019 | 0.009 | (3.30+/-0.22)e2 | -0.49 +/- 3.86 | K | EPHIN ELECTRONICS HOUSING TEMP | |
| tephin | 0.020 | 0.004 | (3.40+/-0.09)e2 | 0.90 +/- 2.62 | K | EPHIN SENSOR HOUSING TEMP | |
| S/C Main Temperatures - Daily Maximums | |||||||
|---|---|---|---|---|---|---|---|
| MSID | MEAN | RMS | DELTA/YR | DELTA/YR/YR | UNITS | DESCRIPTION | |
| tcylfmzm | -0.066 | 0.005 | (3.15+/-0.12)e2 | 2.33 +/- 2.01 | K | CNT CYL TEMP:-Z SIDE UNDER LAE-1 | |
| tcylfmzp | -0.062 | 0.005 | (3.18+/-0.11)e2 | 2.11 +/- 1.91 | K | CNT CYL TEMP:-Z SIDE UNDER LAE-2 | |
| S/C Ancillary Temperatures - Daily Maximums | |||||||
|---|---|---|---|---|---|---|---|
| MSID | MEAN | RMS | DELTA/YR | DELTA/YR/YR | UNITS | DESCRIPTION | |
| tfssbkt1 | -0.025 | 0.012 | (3.51+/-0.28)e2 | 2.66 +/- 4.50 | K | FSS BRAC | |
| tfssbkt2 | -0.031 | 0.012 | (3.46+/-0.29)e2 | 2.11 +/- 4.52 | K | FSS BRAC | |
| tsctsf1 | 0.001 | 0.002 | (3.26+/-0.05)e2 | 0.24 +/- 1.64 | K | SC-TS FITTING -1 TEMP | |
| tsctsf6 | 0.007 | 0.002 | (3.26+/-0.06)e2 | -0.23 +/- 1.72 | K | SC-TS FITTING -6 TEMP | |
| MUPS - Daily Maximums | |||||||
|---|---|---|---|---|---|---|---|
| MSID | MEAN | RMS | DELTA/YR | DELTA/YR/YR | UNITS | DESCRIPTION | |
| pm1thv1t | -0.011 | 0.007 | (3.54+/-0.16)e2 | 2.38 +/- 3.30 | K | MUPS 1 THRUSTER VALVE 01 TEMP | |
| pm2thv1t | -0.081 | 0.018 | (3.27+/-0.43)e2 | 0.15 +/- 8.12 | K | MUPS 2 THRUSTER VALVE 01 TEMP | |
| pm1thv2t | -0.006 | 0.007 | (3.57+/-0.16)e2 | 1.94 +/- 3.52 | K | MUPS 1 THRUSTER VALVE 02 TEMP | |
| pm2thv2t | 0.010 | 0.022 | (3.22+/-0.50)e2 | 1.33 +/- 9.32 | K | MUPS 2 THRUSTER VALVE 02 TEMP | |
| pline02t | -0.007 | 0.005 | (3.38+/-0.12)e2 | 2.28 +/- 3.09 | K | PROP LINE TEMP 02 | |
| pline03t | -0.033 | 0.006 | (3.31+/-0.13)e2 | 1.44 +/- 2.57 | K | PROP LINE TEMP 03 | |
| pline04t | -0.031 | 0.005 | (3.20+/-0.11)e2 | 0.96 +/- 2.76 | K | PROP LINE TEMP 04 | |
Quarterly Trends
- PCAD FTS Temperature and Gradient
| Previous Quarter | |||||||
| MSID | MEAN | RMS | DELTA/YR | DELTA/YR/YR | UNITS | DESCRIPTION | |
| ohrthr27 | 0.002 | 2.409e-04 | (2.97+/-0.01)e2 | -0.01 +/- 0.03 | K | RT 20 : PERISCOPE | |
|---|---|---|---|---|---|---|---|
| ohrthr42 | 0.008 | 3.540e-04 | (2.97+/-0.01)e2 | -0.28 +/- 0.17 | K | RT 133: PERISCOPE | |
| ohrthr43 | 0.007 | 3.694e-04 | (2.97+/-0.01)e2 | -0.26 +/- 0.20 | K | RT 134: PERISCOPE | |
| oobagrd3 | 4.239e-07 | 9.663e-05 | -0.35 +/- 0.23 | -0.02 +/- 0.05 | K | RT 505 TO RT 504: PERISCOPE GRADIENT MONITOR | |
| oobagrd6 | 8.344e-05 | 1.232e-05 | 0.13 +/- 0.03 | -0.00 +/- 0.00 | K | RT 507 TO RT 506: PERISCOPE GRADIENT MONITOR | |
- SIM Temperature
| Previous Quarter | |||||||
| MSID | MEAN | RMS | DELTA/YR | DELTA/YR/YR | UNITS | DESCRIPTION | |
| 3btu_bpt | -0.008 | 0.002 | (2.69+/-0.06)e2 | -3.16 +/- 1.68 | K | BTU BASEPLATE (+X)), ABORT HTR TSC2 | |
|---|---|---|---|---|---|---|---|
| 3tsmxcet | -1.076e-04 | 0.018 | (2.47+/-0.41)e2 | -7.64 +/- 4.78 | K | -X TURTLE SHELL NR HRC CEA | |
| 3tsmxspt | 0.192 | 0.081 | (4.61+/-1.90)e2 | -48.09 +/- 26.90 | K | -X TURTLE SHELL NR ACIS SS | |
- SIIM Electronics
| Previous Quarter | |||||||
| MSID | MEAN | RMS | DELTA/YR | DELTA/YR/YR | UNITS | DESCRIPTION | |
| agrndadc | -2.604e-07 | 3.481e-08 | -(3.89+/-0.93)e-4 | (2.62+/-1.95)e-5 | V | Analog fround A/D convert reading | |
|---|---|---|---|---|---|---|---|
| fatabadc | 3.262e-05 | 2.037e-05 | 4.99 +/- 0.05 | (6.20+/-3.78)e-4 | V | FA Tab Position Sensor A/D Converter | |
| n15vadc | 5.366e-07 | 1.330e-07 | -15.02 +/- 0.00 | -(1.89+/-62.49)e-6 | V | -15V Power Supply A/D Converter Reading | |
| p15vadc | -1.543e-06 | 1.230e-07 | 14.96 +/- 0.00 | -(2.77+/-0.92)e-4 | V | +15V Power Supply A/D Converter Reading | |
| p5vadc | 2.897e-06 | 6.935e-07 | 4.94 +/- 0.00 | 0.00 +/- 0.00 | V | +5V Power Supply A/D Converter Reading | |
| tsctabadc | 9.737e-06 | 5.317e-05 | 4.97 +/- 0.14 | 0.01 +/- 0.02 | V | TSC Tab Position Sensor A/D converter | |
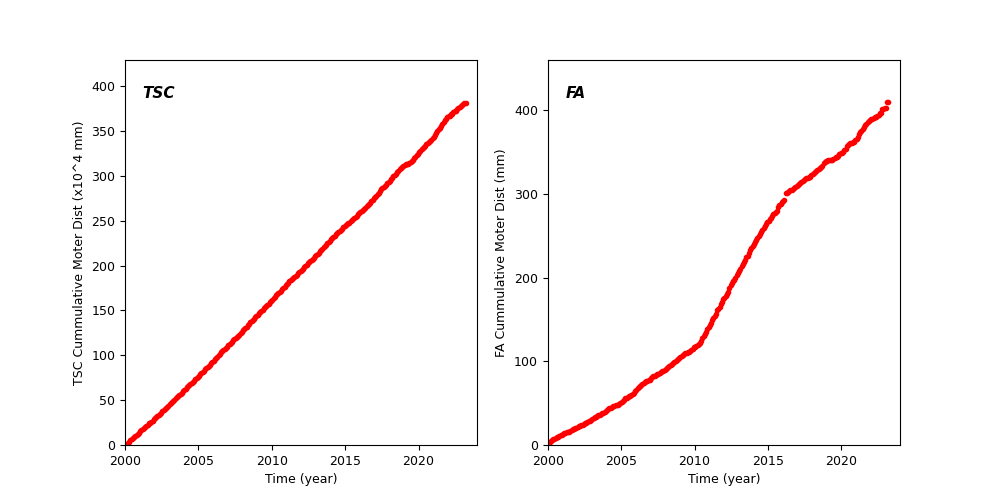
Spacecraft Motions
TSC and FA Cummulative Moter Distance
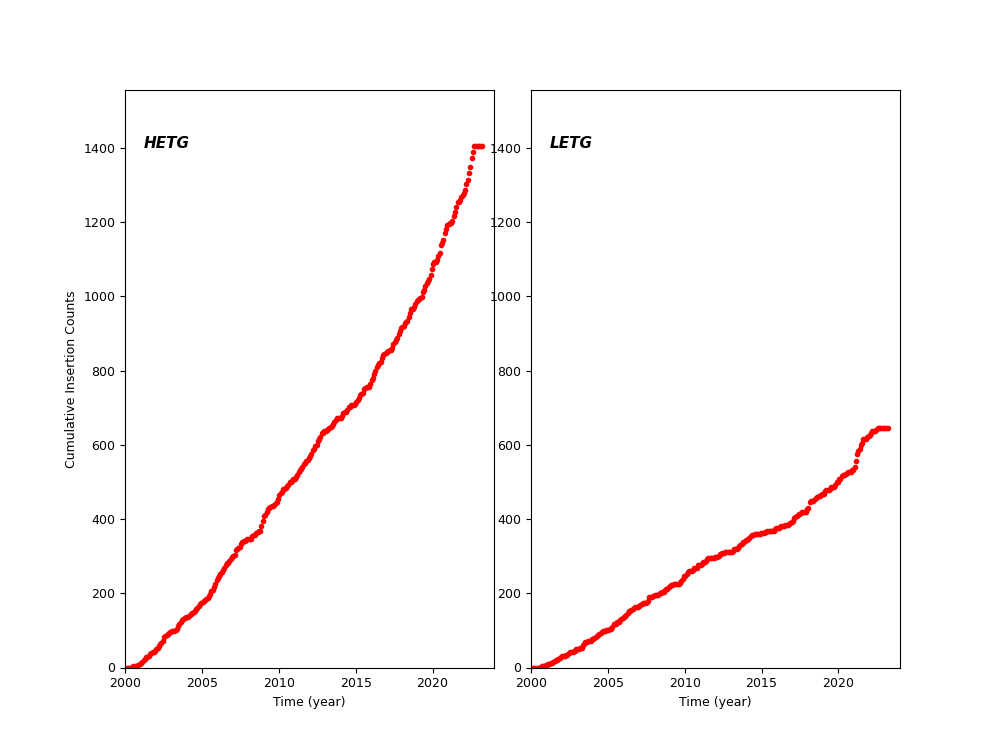
HETG and LETG Cummulative Insertion Counts
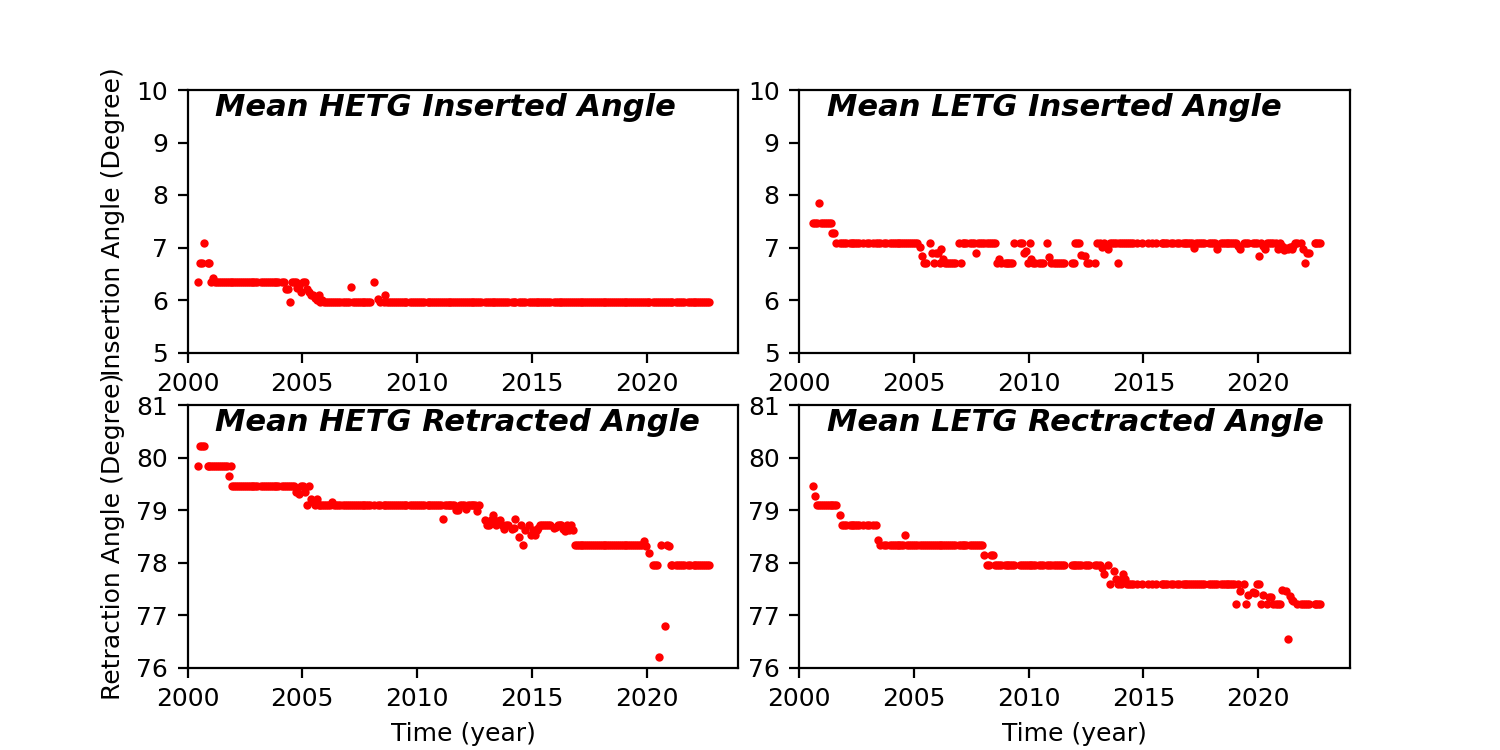
HETG/LETG Insertion/Retraction Angle
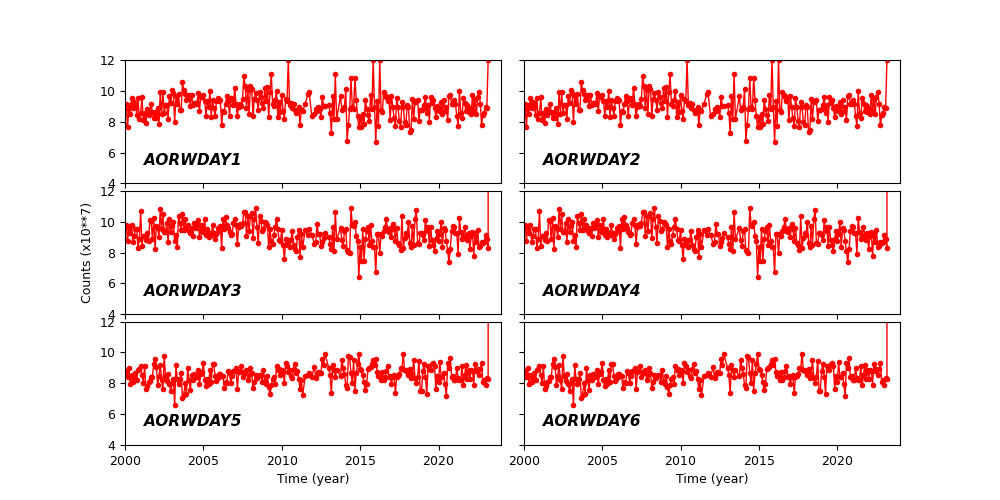
Reaction Wheel Rotations