ACIS
ACIS DOSE Registered-Photon-Map
The steps we took to compute the dose map are;
- Level 1 Event files for a specified month are obtained from archive.
- Image data including I2, I3, S2, S3 CCDs are extracted from all event files.
- All the extracted image data were merged to create a month long exposure map for the month.
- The exposure map is opened with ds9, and check a distribution of count rates against energy. From this, estimate the upper threshold value. Any events beyond this upper threshold are assumed erroneous events such as bad pixels.
- Using this upper threshold, the data is filtered, and create a cleaned exposure map for the month.
- The exposure map from each month from the Sep 1999 is added up to create a cumulative exposure map for each month.
- Using fimgstatistic, we compute count rate statistics for each CCDs.
- For observations with high data drop rates (e.g., Crab nebula, Cas A), we corrected the observations by adding events.
Please check more detail plots at Telemetered Photon Dose Trend page.
)
)
)
Statistics:
# IMAGE     NPIX     MEAN        RMS        MIN     MAX
ACIS_apr23 6004901       4.510         6.199           0.0     2058


I2 node 0  262654	3.905321	2.285301	0.0	 48.0
I2 node 1  262654	4.170779	2.847212	0.0	723.0
I2 node 2  262654	4.253272	2.334383	0.0	 81.0
I2 node 3  262654	4.894694	3.899794	0.0	1380.0

I3 node 0  262654	5.347638	3.594492	0.0	 73.0
I3 node 1  262654	4.641370	2.875509	0.0	609.0
I3 node 2  262654	4.107453	2.281789	0.0	 54.0
I3 node 3  262654	4.060176	2.253619	0.0	123.0

S2 node 0  262654	6.047227	5.231096	0.0	799.0
S2 node 1  262654	6.352171	5.465723	0.0	529.0
S2 node 2  262654	6.919370	6.297926	0.0	708.0
S2 node 3  262654	7.357710	6.660528	0.0	605.0

S3 node 0  262654	8.472626	7.266111	0.0	198.0
S3 node 1  262654	9.704081	7.846970	0.0	2058.0
S3 node 2  262654	9.037917	5.974686	0.0	193.0
S3 node 3  262654	7.503887	4.072552	0.0	175.0
)
)
)
Statistics:
 IMAGE     NPIX      MEAN        RMS           MIN      MAX
ACIS_total   6004901       2633.634         3361.029           0.0   144868


I2 node 0  262654	2287.486745	462.046489	490.0	14250.0
I2 node 1  262654	2408.539096	662.517485	503.0	142862.0
I2 node 2  262654	2437.151381	515.902677	527.0	15174.0
I2 node 3  262654	2442.173823	630.653182	488.0	31338.0

I3 node 0  262654	2627.195586	645.464631	490.0	14297.0
I3 node 1  262654	2709.550625	1745.287925	515.0	55926.0
I3 node 2  262654	2421.368492	451.984959	487.0	14552.0
I3 node 3  262654	2402.761176	486.917220	457.0	35307.0

S2 node 0  262654	3069.074265	498.198365	1664.0	22477.0
S2 node 1  262654	3254.727478	740.378801	1845.0	17579.0
S2 node 2  262654	3601.008203	740.648936	2257.0	31432.0
S2 node 3  262654	3563.086665	597.373199	1993.0	77192.0

S3 node 0  262654	5450.810405	2968.510431	2394.0	54644.0
S3 node 1  262654	6664.576856	2381.681898	0.0	61084.0
S3 node 2  262654	5394.905787	1363.356069	2500.0	27387.0
S3 node 3  262654	4221.617861	762.854391	2551.0	26556.0
)
|
)
|
)
|
)
|
| Jan 2023 | Oct 2022 | Jul 2022 | Apr 2022 |
|---|
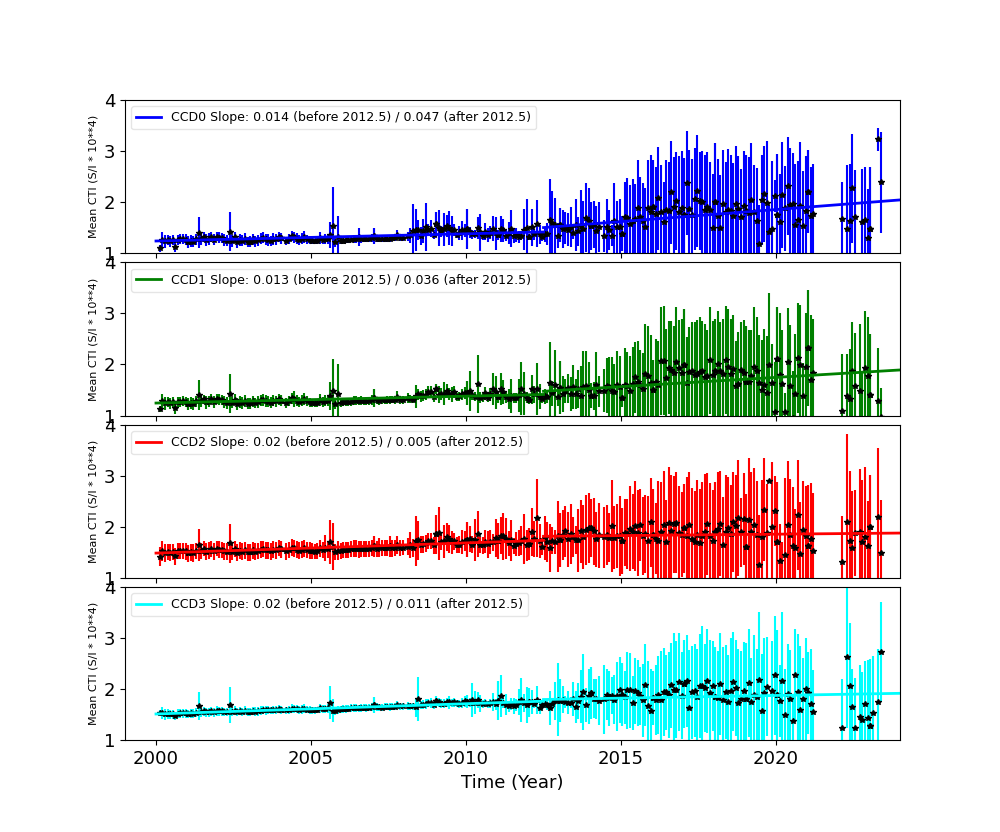
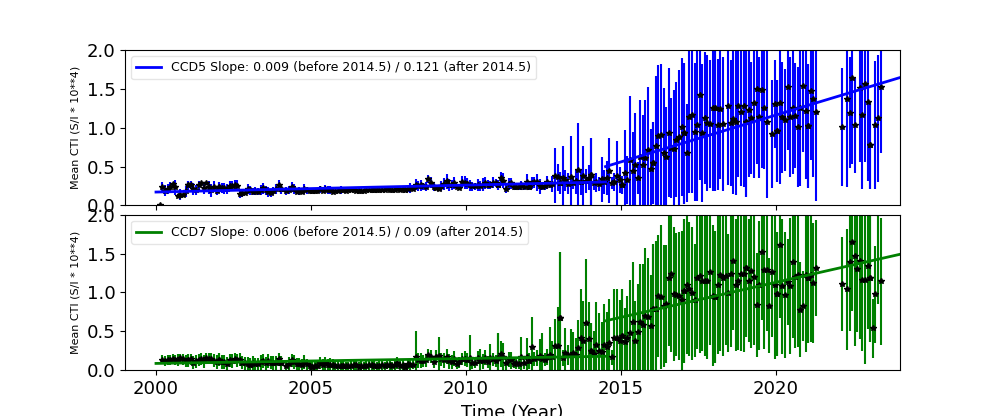
The Mean Detrended CTI
We report CTIs with a refined data definition. CTIs were computed for the temperature dependency corrected data. Please see CTI page for detailed explanation. CTI's are computed for Mn K alpha, and defined as slope/intercept x10^4 of row # vs ADU. Data file: here
Imaging CCDs
Spectral CCDs
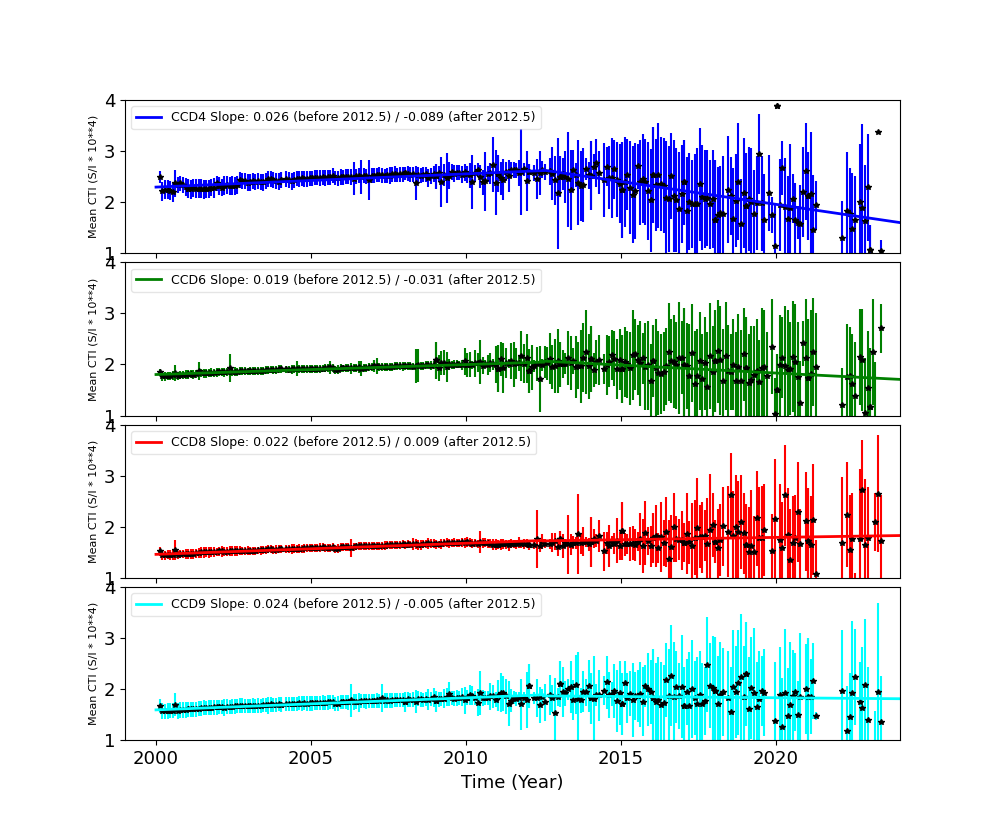
Backside CCDs
Focal Plane Temperature
Apr 2023 Focal Temperature
| The Mean (max) FPT: | |
|---|---|
| -106.31 | +/- 9.63 C |
| Mean Width: | |
| 0.7 | +/- 0.39 days |
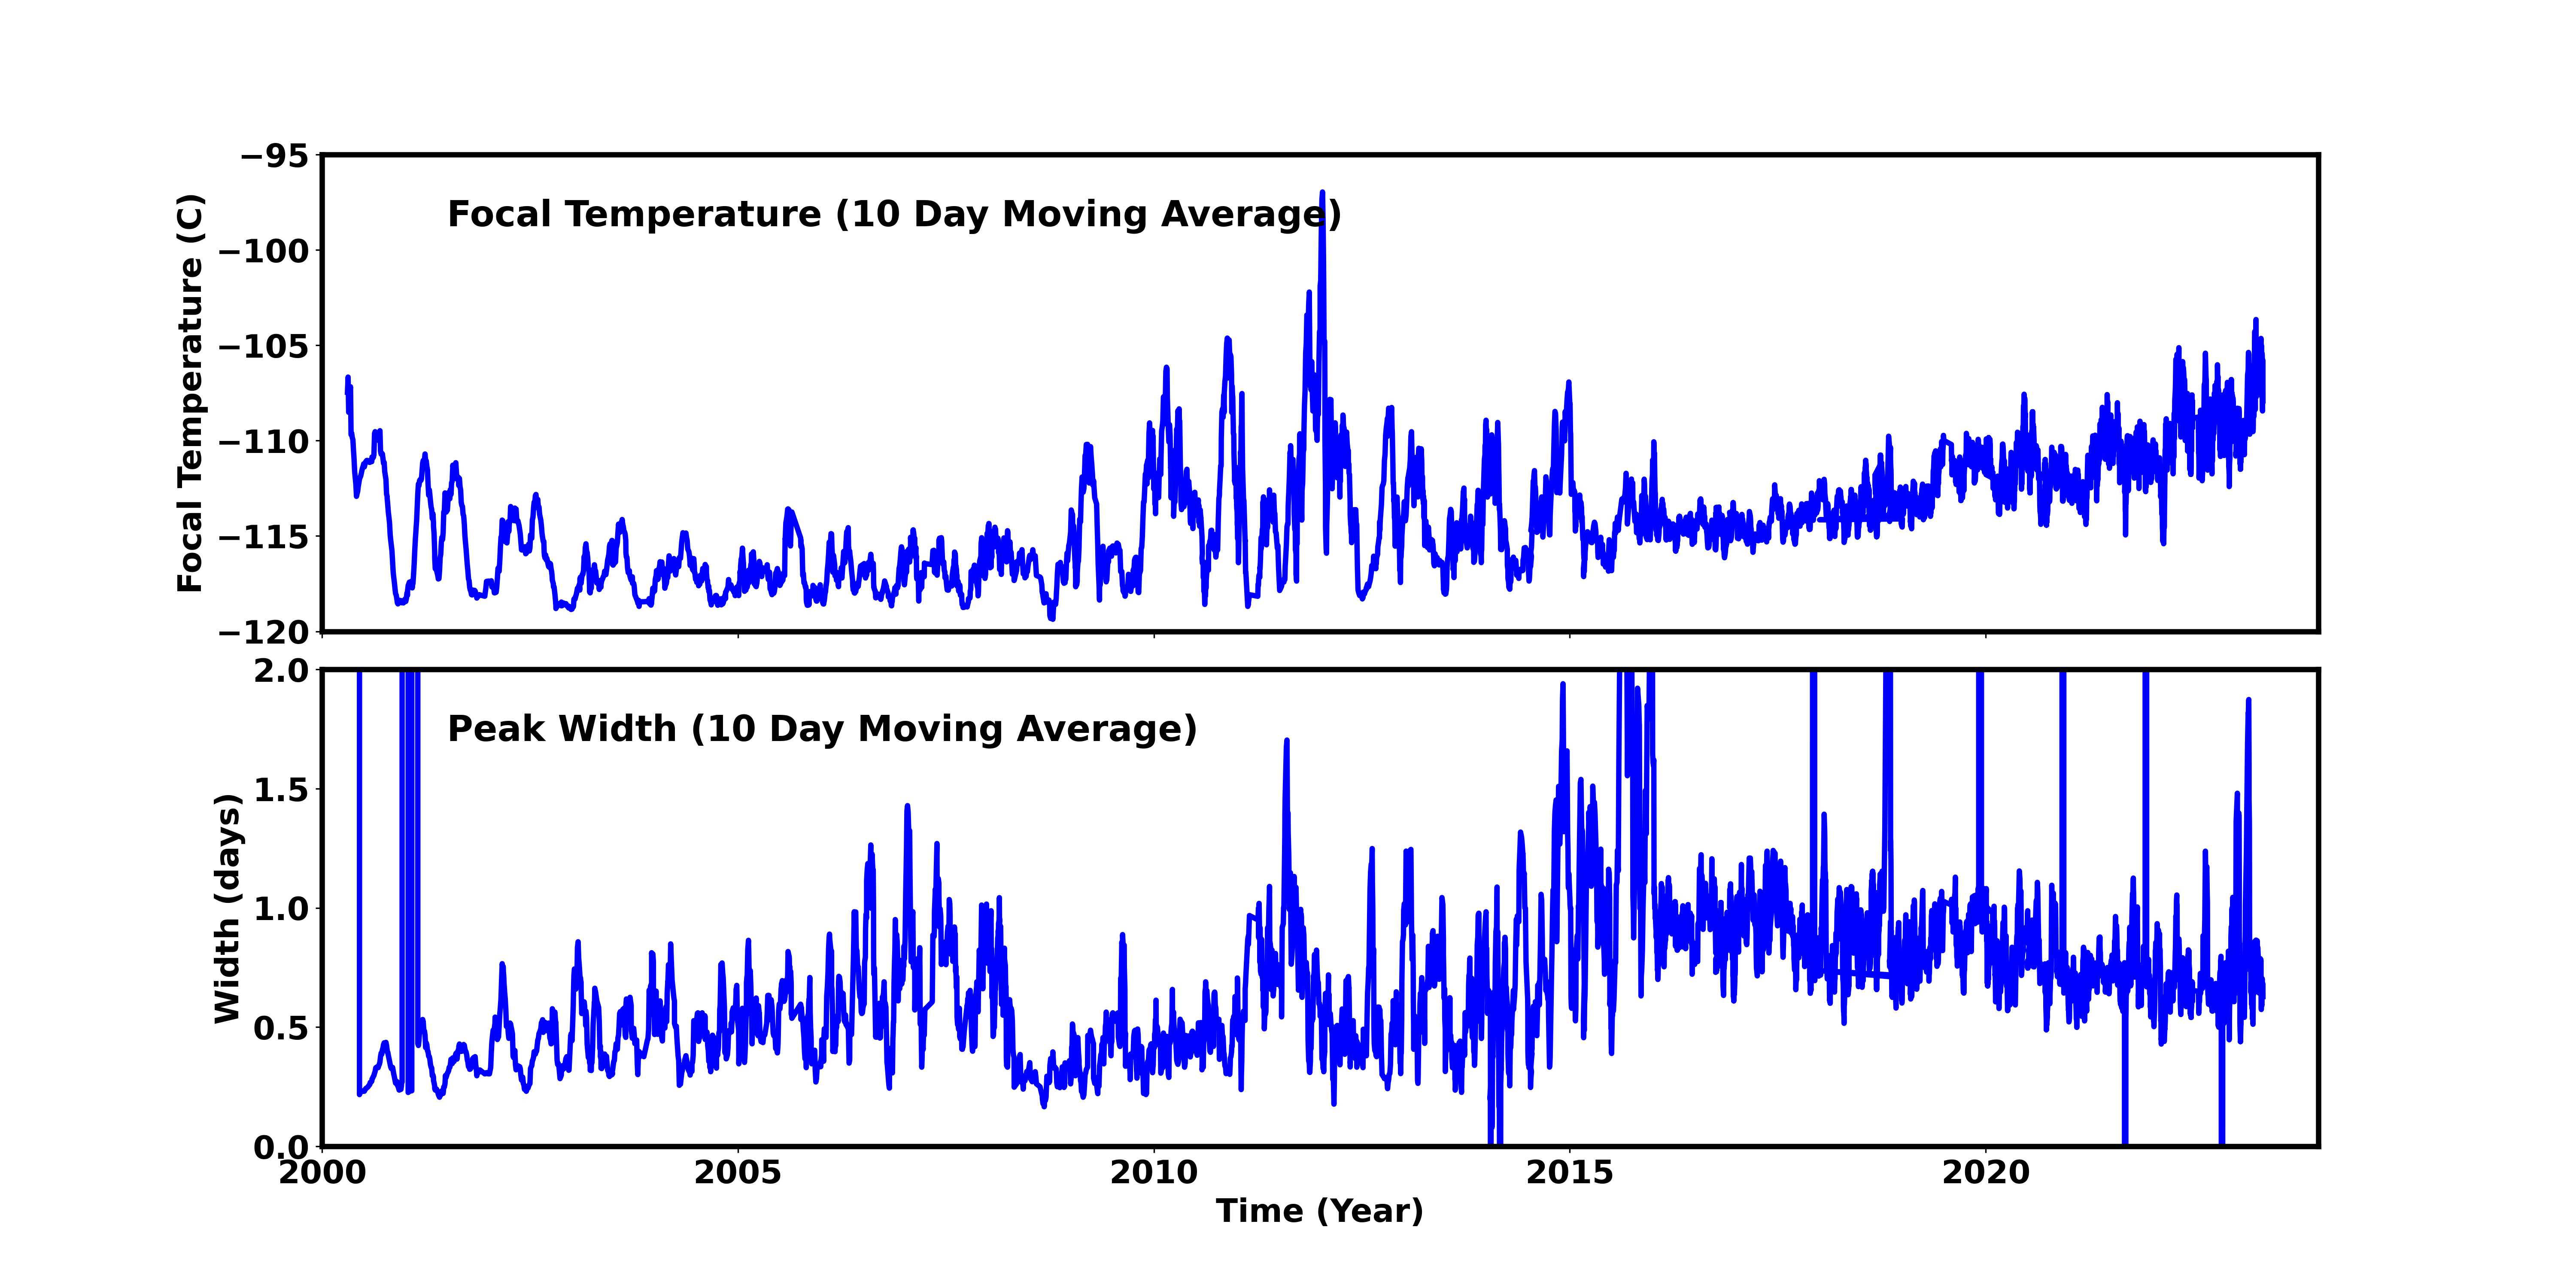
Averaged Focal Plane Temperature
We are using 10 period moving averages to show trends of peak temperatures and peak widths. Note, the gaps in the width plot are due to missing/corrupted data.
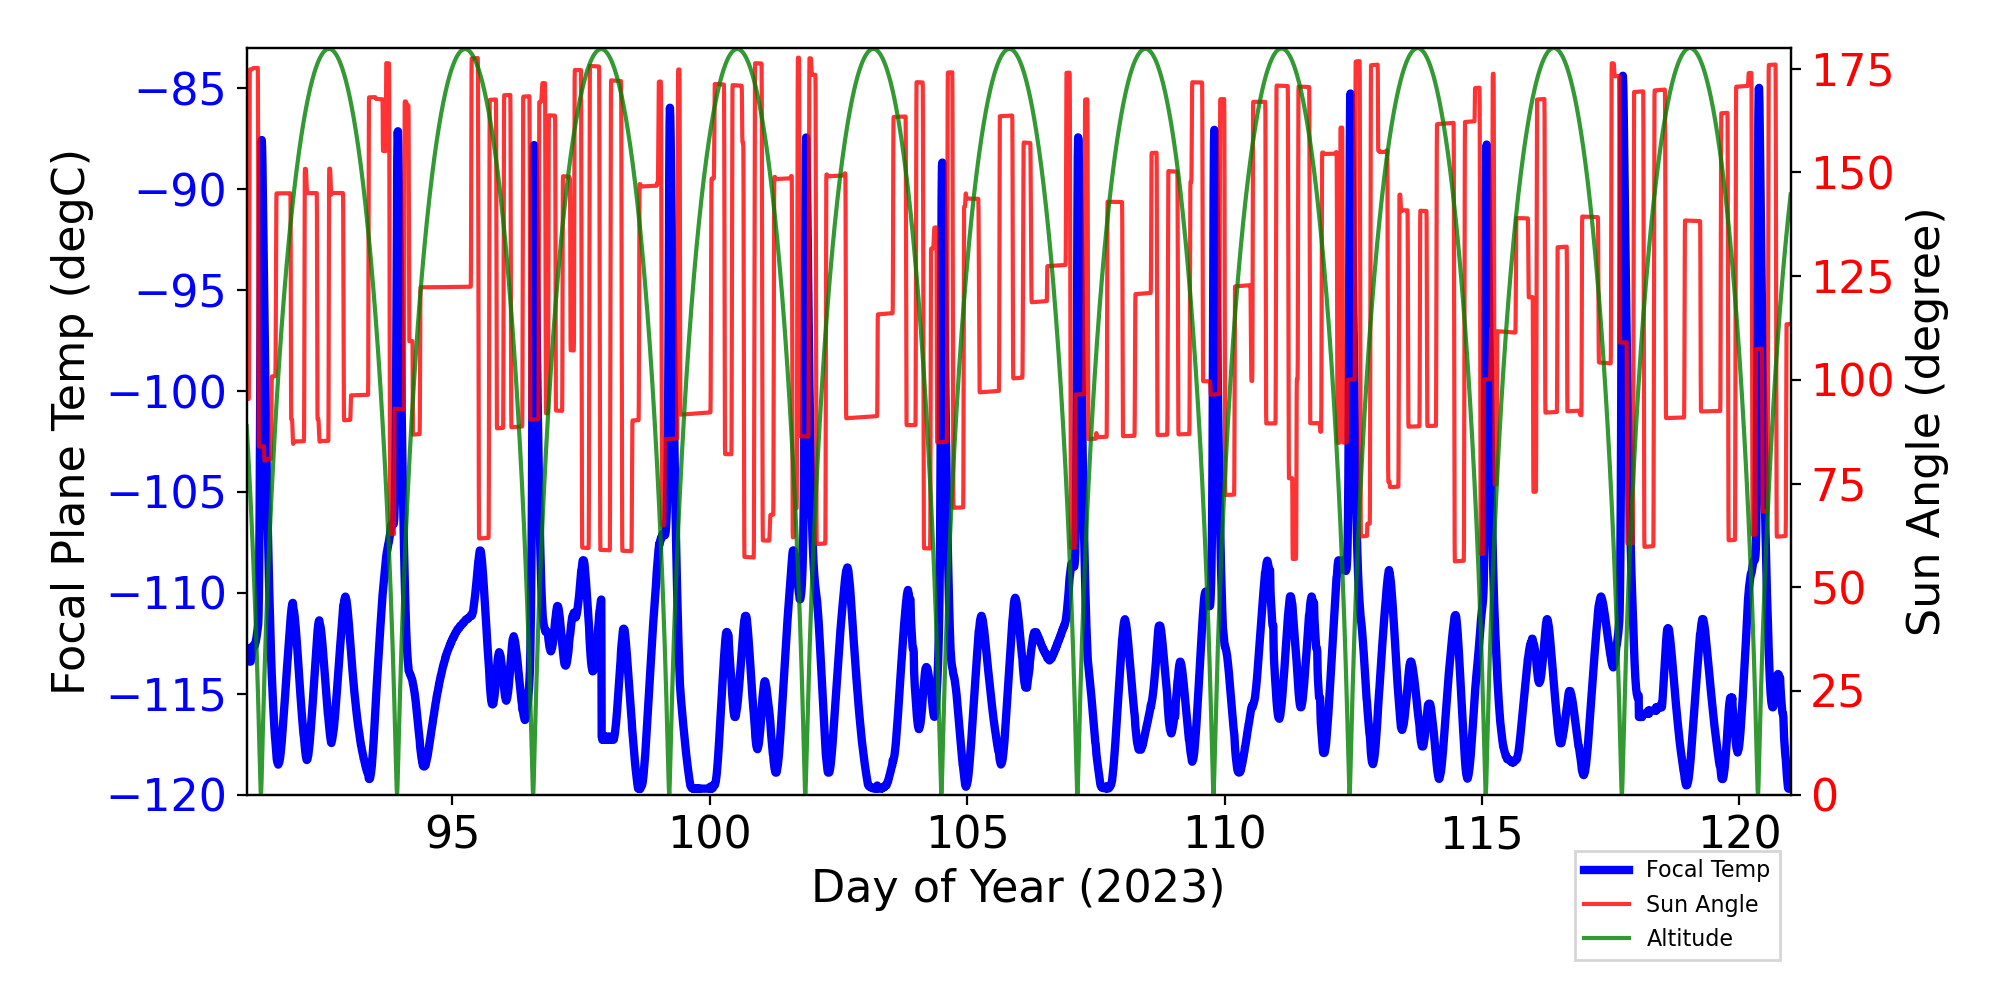
Focal Plane Temperature, Sun Angle and Altitude
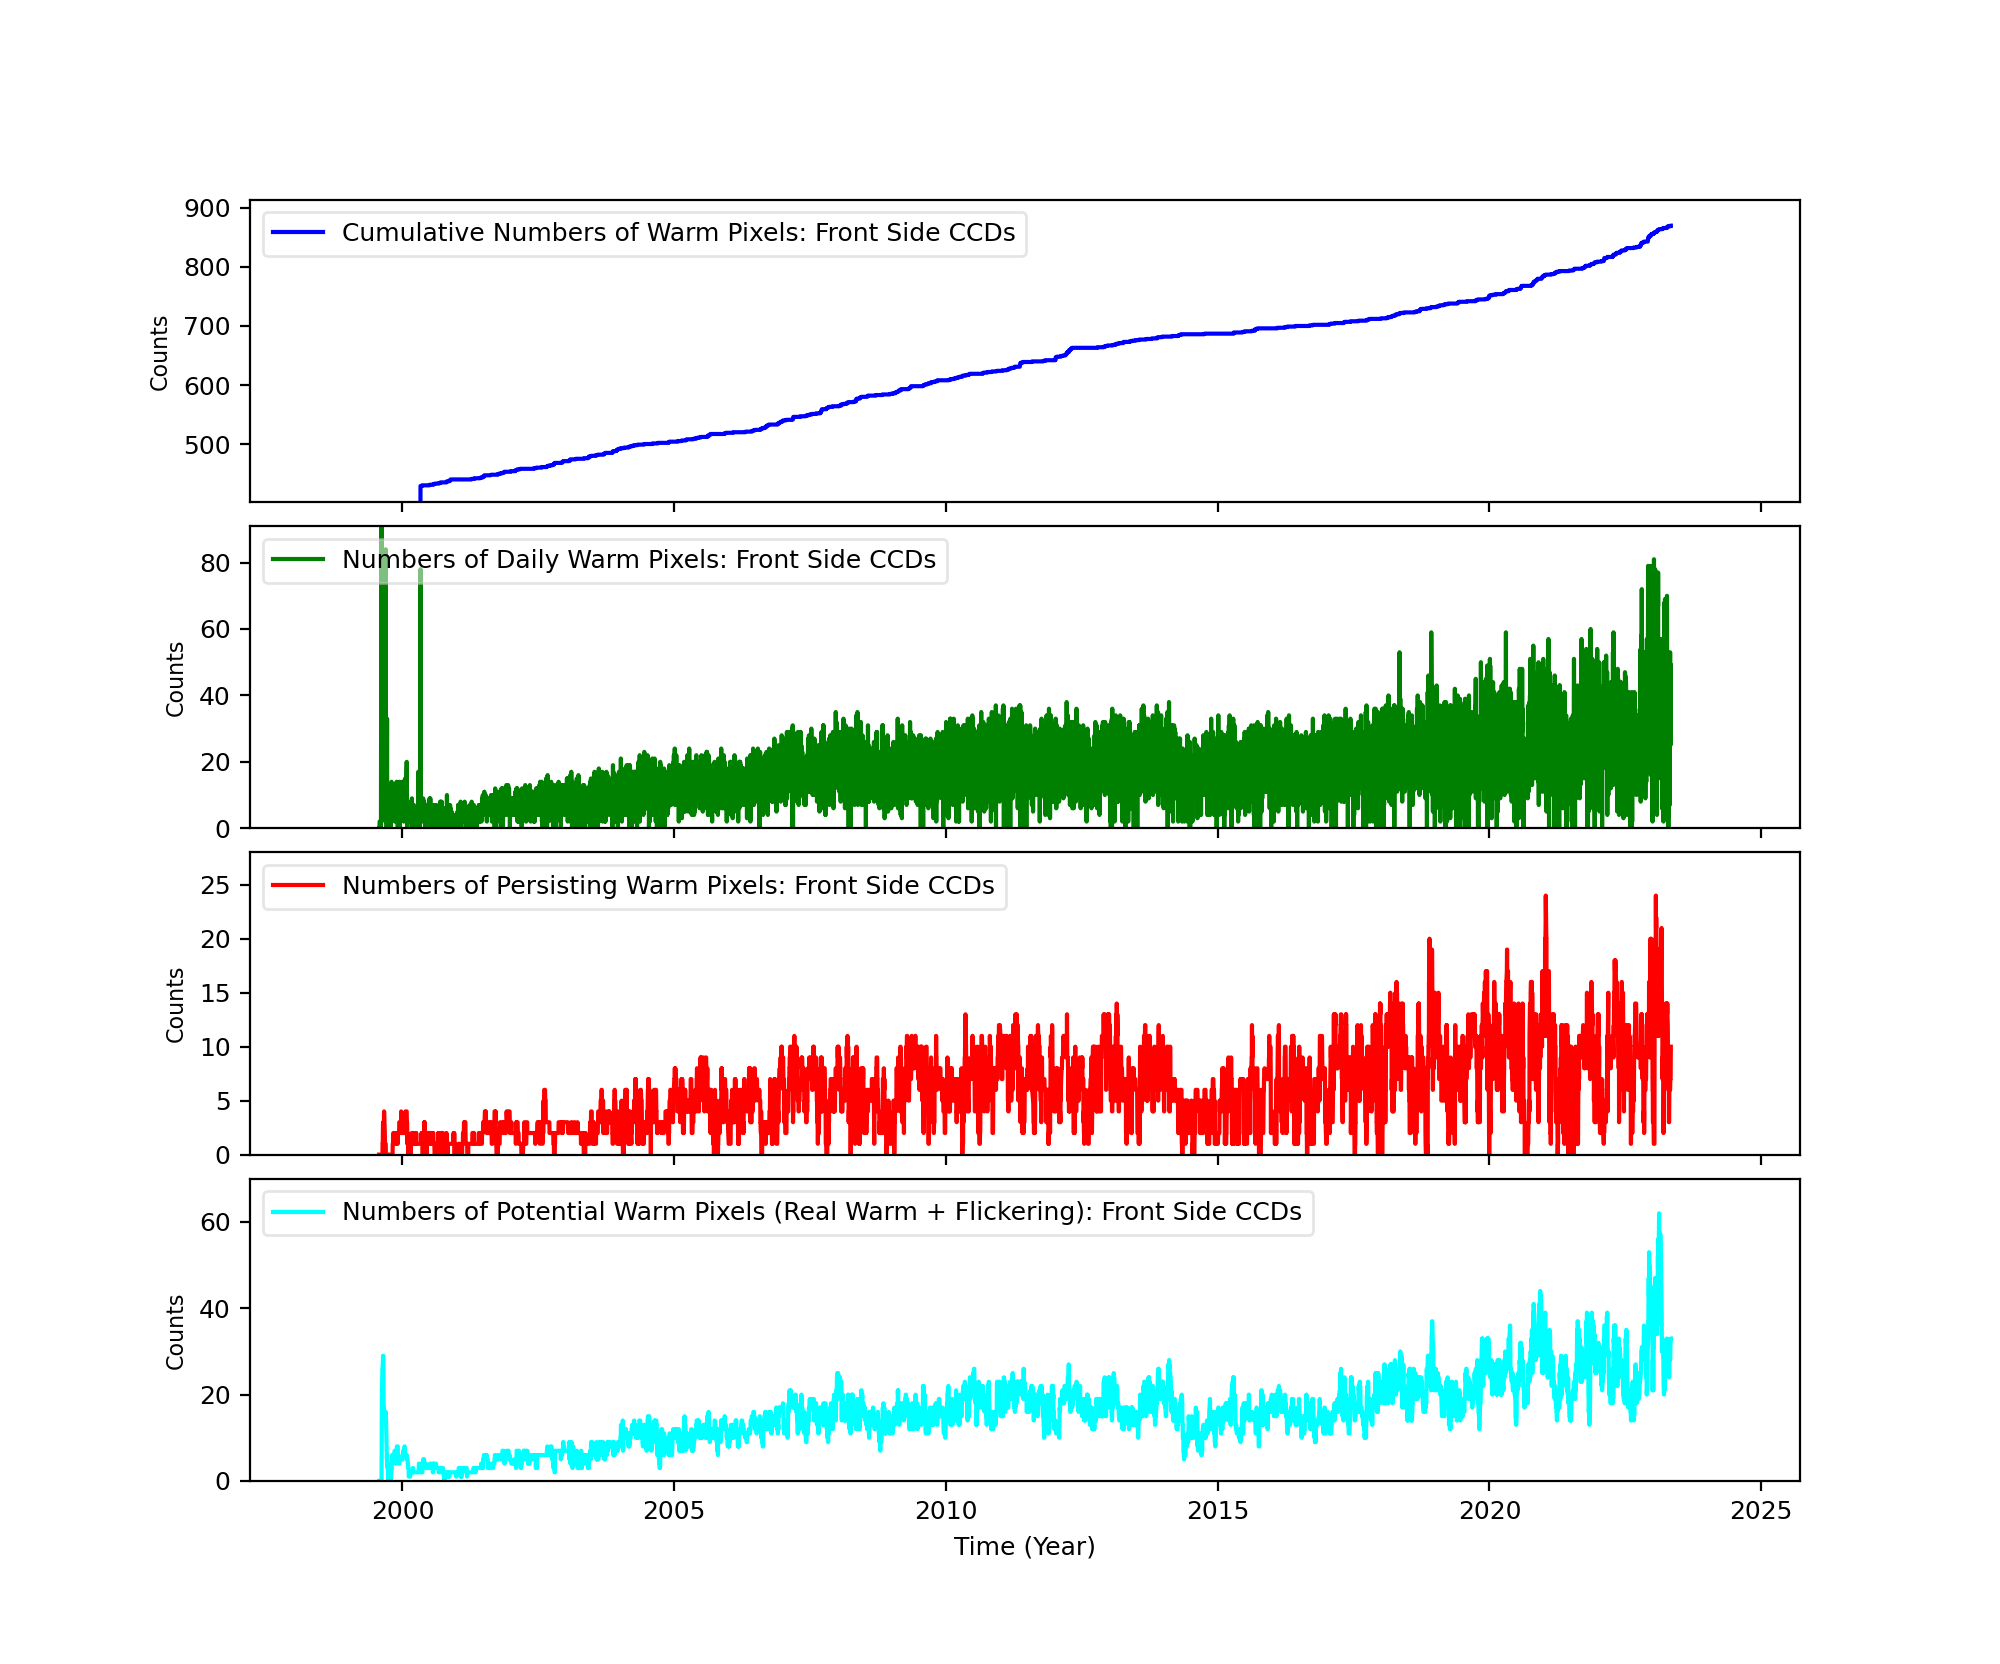
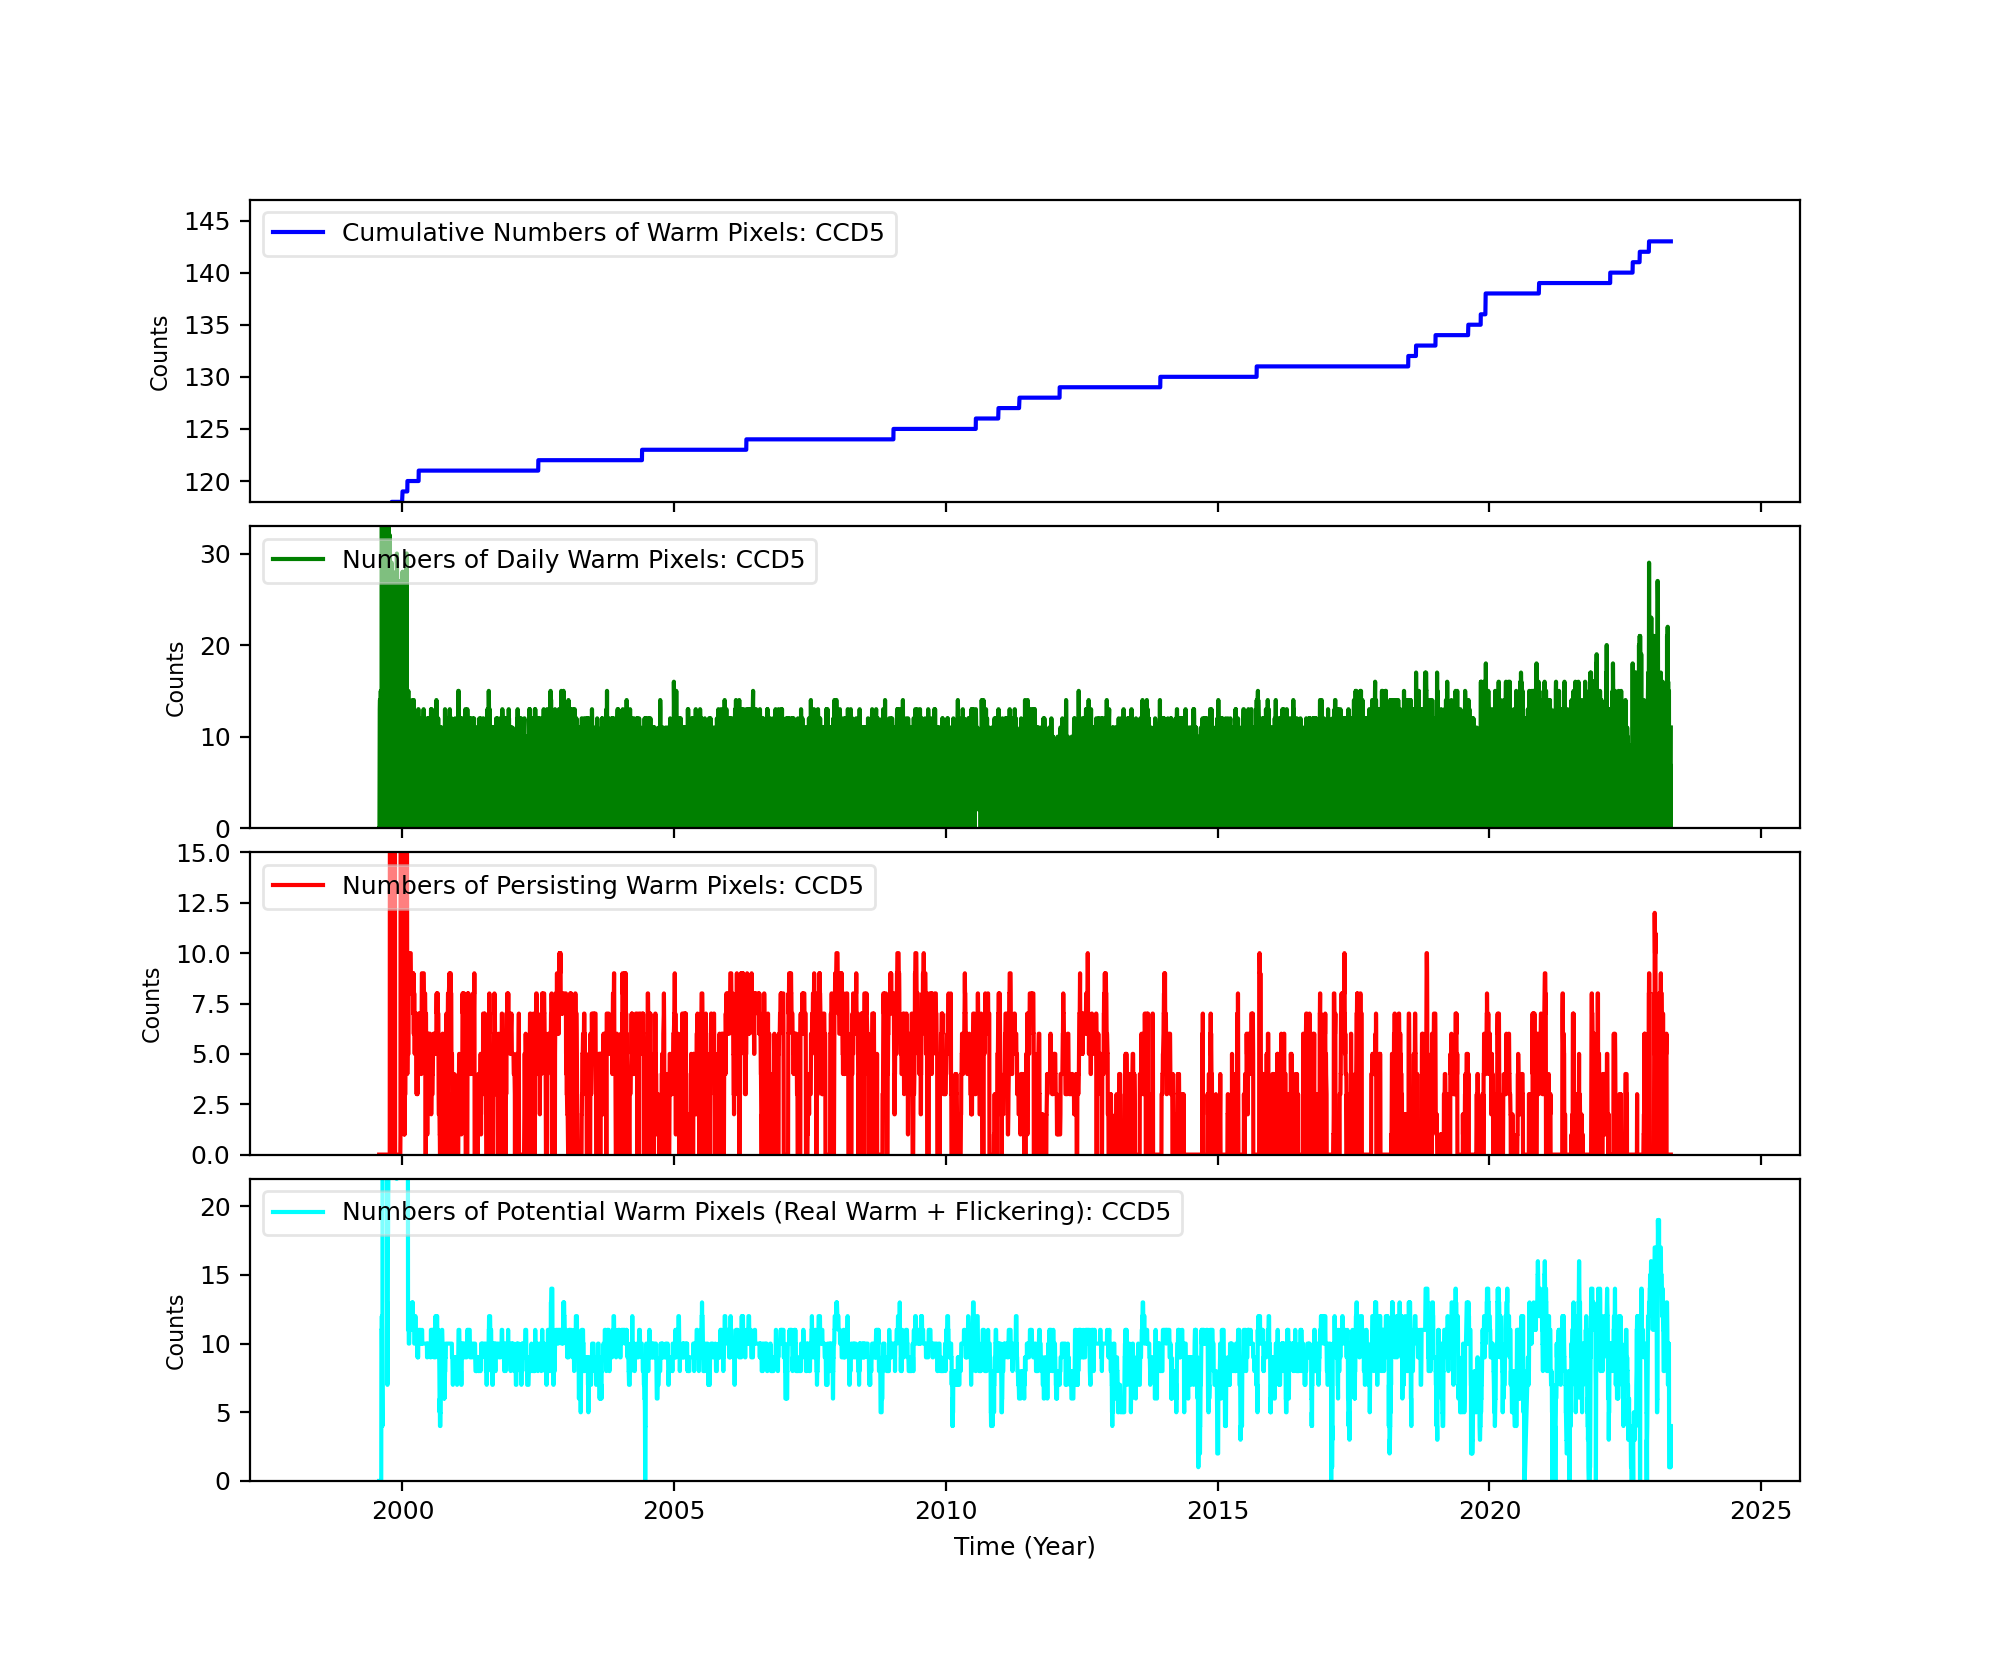
Bad Pixels
The plots below were generated with a new warm pixel finding script. Please see Acis Bad Pixel Page for details.
Front Side CCDs
Back Side CCD (CCD5)
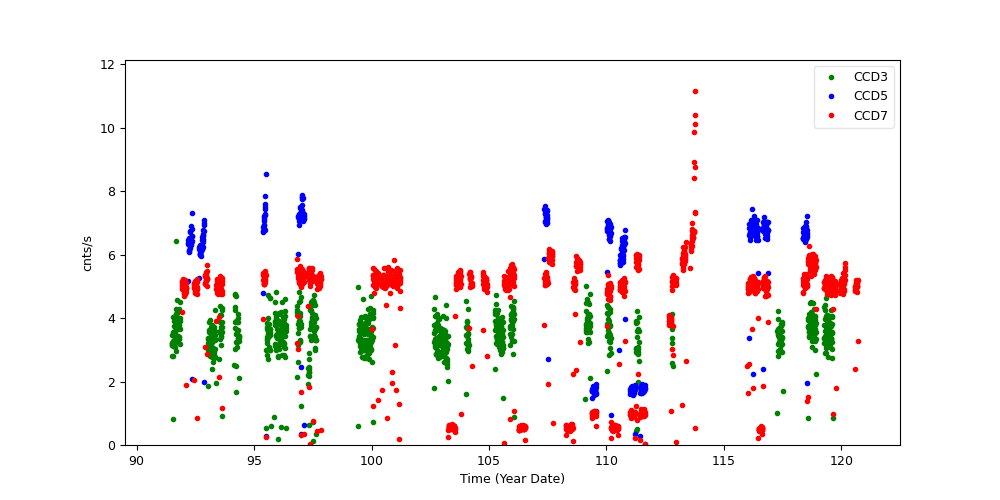
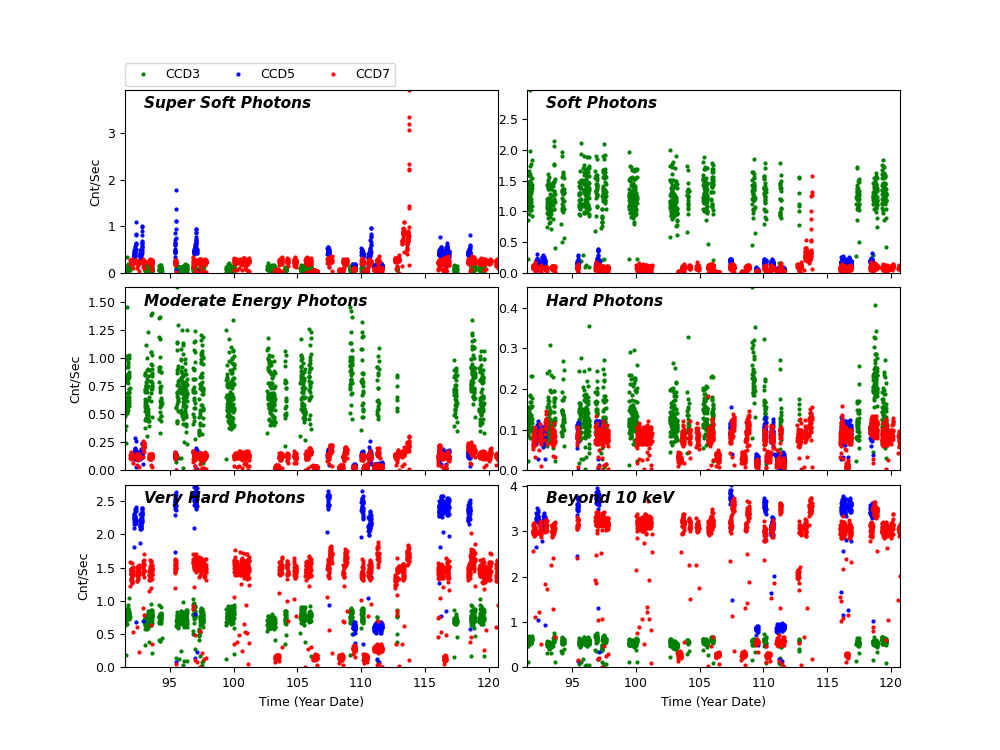
Science Instrument Background Rates
| Name | Low (keV) | High(KeV) | Description |
|---|---|---|---|
| SSoft | 0.00 | 0.50 | Super soft photons |
| Soft | 0.50 | 1.00 | Soft photons |
| Med | 1.00 | 3.00 | Moderate energy photons |
| Hard | 3.00 | 5.00 | Hard Photons |
| Harder | 5.00 | 10.00 | Very Hard photons |
| Hardest | 10.00 | Beyond 10 keV |
HRC
DOSE of Central 4K Pore-Pairs
Please refer to Maximum Dose Trends for more details.
)
|
|---|
IMAGE                NPIX      MEAN    STDDEV      MIN       MAX
HRCI_04_2023.fits  16777216	0.025 	0.160 	0.000 	4.000
)
IMAGE                       NPIX      MEAN    STDDEV      MIN       MAX
HRCI_08_1999_04_2023.fits  16777216	na	na	na	na
)
|
|---|
IMAGE                NPIX      MEAN    STDDEV      MIN       MAX
HRCS_04_2023.fits  16777216	0.030 	0.180 	0.000 	4.000
)
IMAGE                       NPIX      MEAN    STDDEV      MIN       MAX
HRCS_08_1999_04_2023.fits  16777216	na	na	na	na
|
|
Max dose trend plots corrected for events that "pile-up"
in the center of the taps due to bad position information.
|
)
|
)
|
)
|
)
|
| Jan 2023 | Oct 2022 | Jul 2022 | Apr 2022 |
|---|
)
|
)
|
)
|
)
|
| Jan 2023 | Oct 2022 | Jul 2022 | Apr 2022 |
|---|
Gratings
Grating Trends/Focus
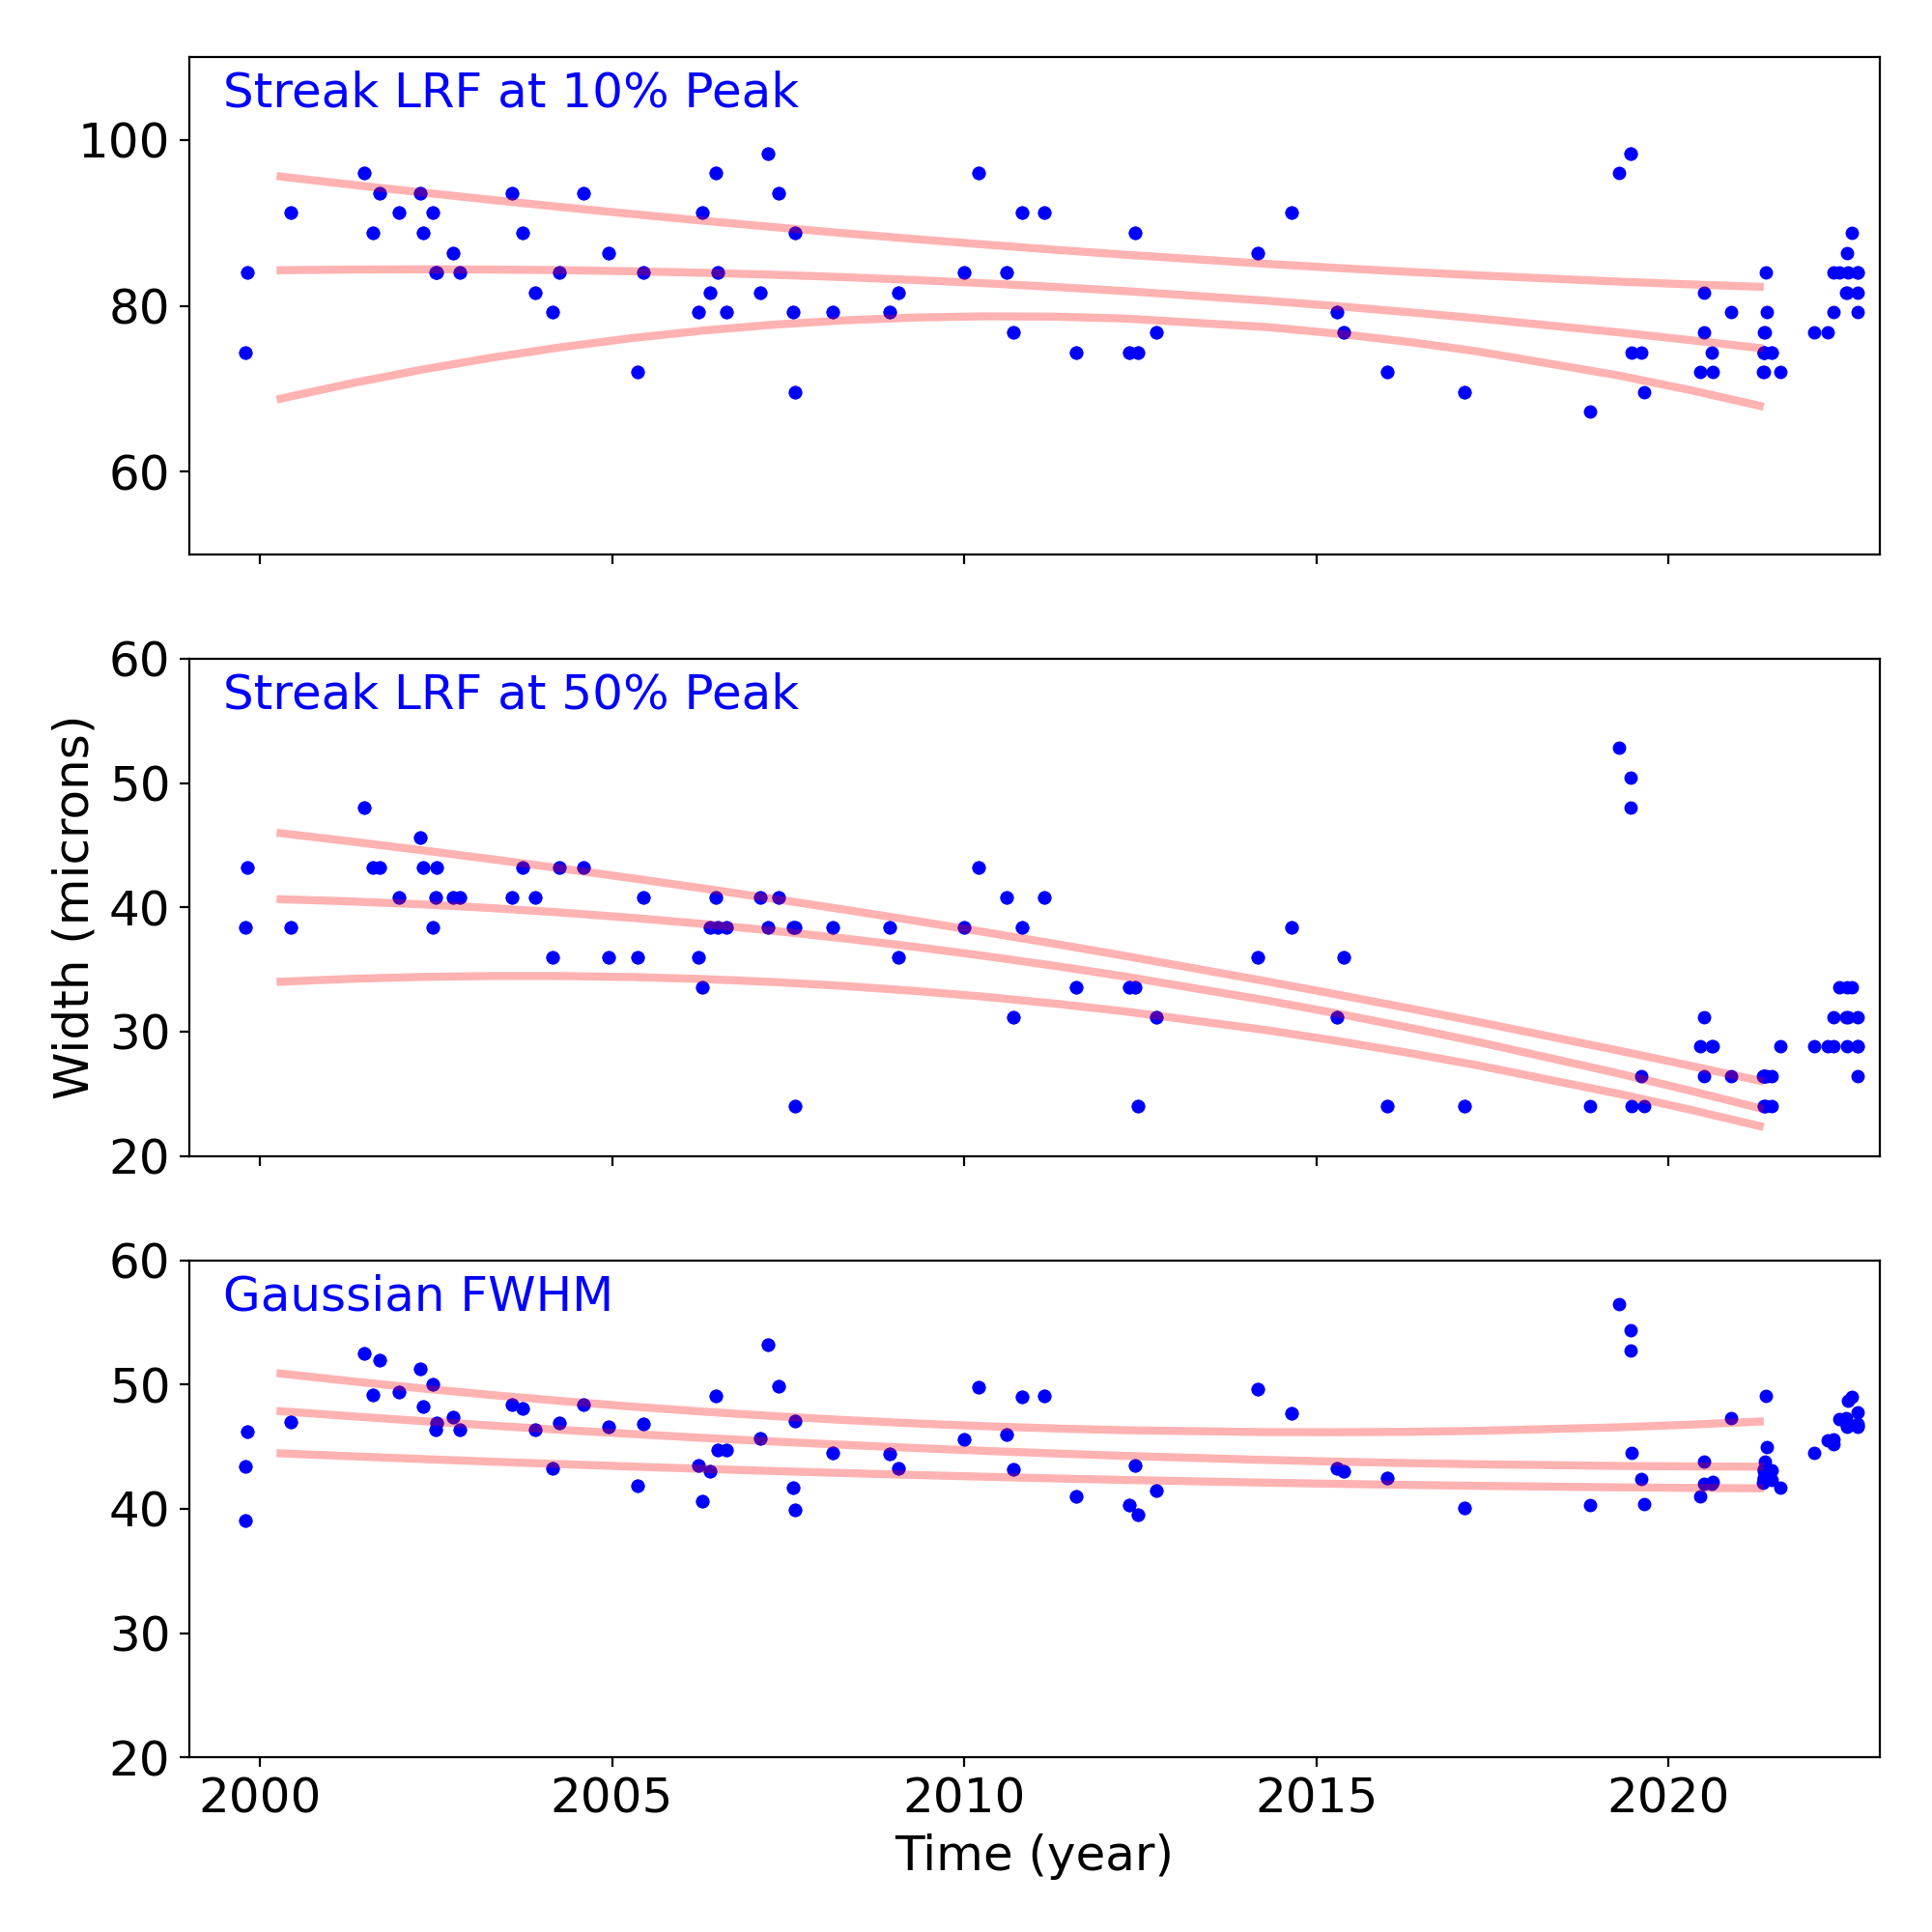
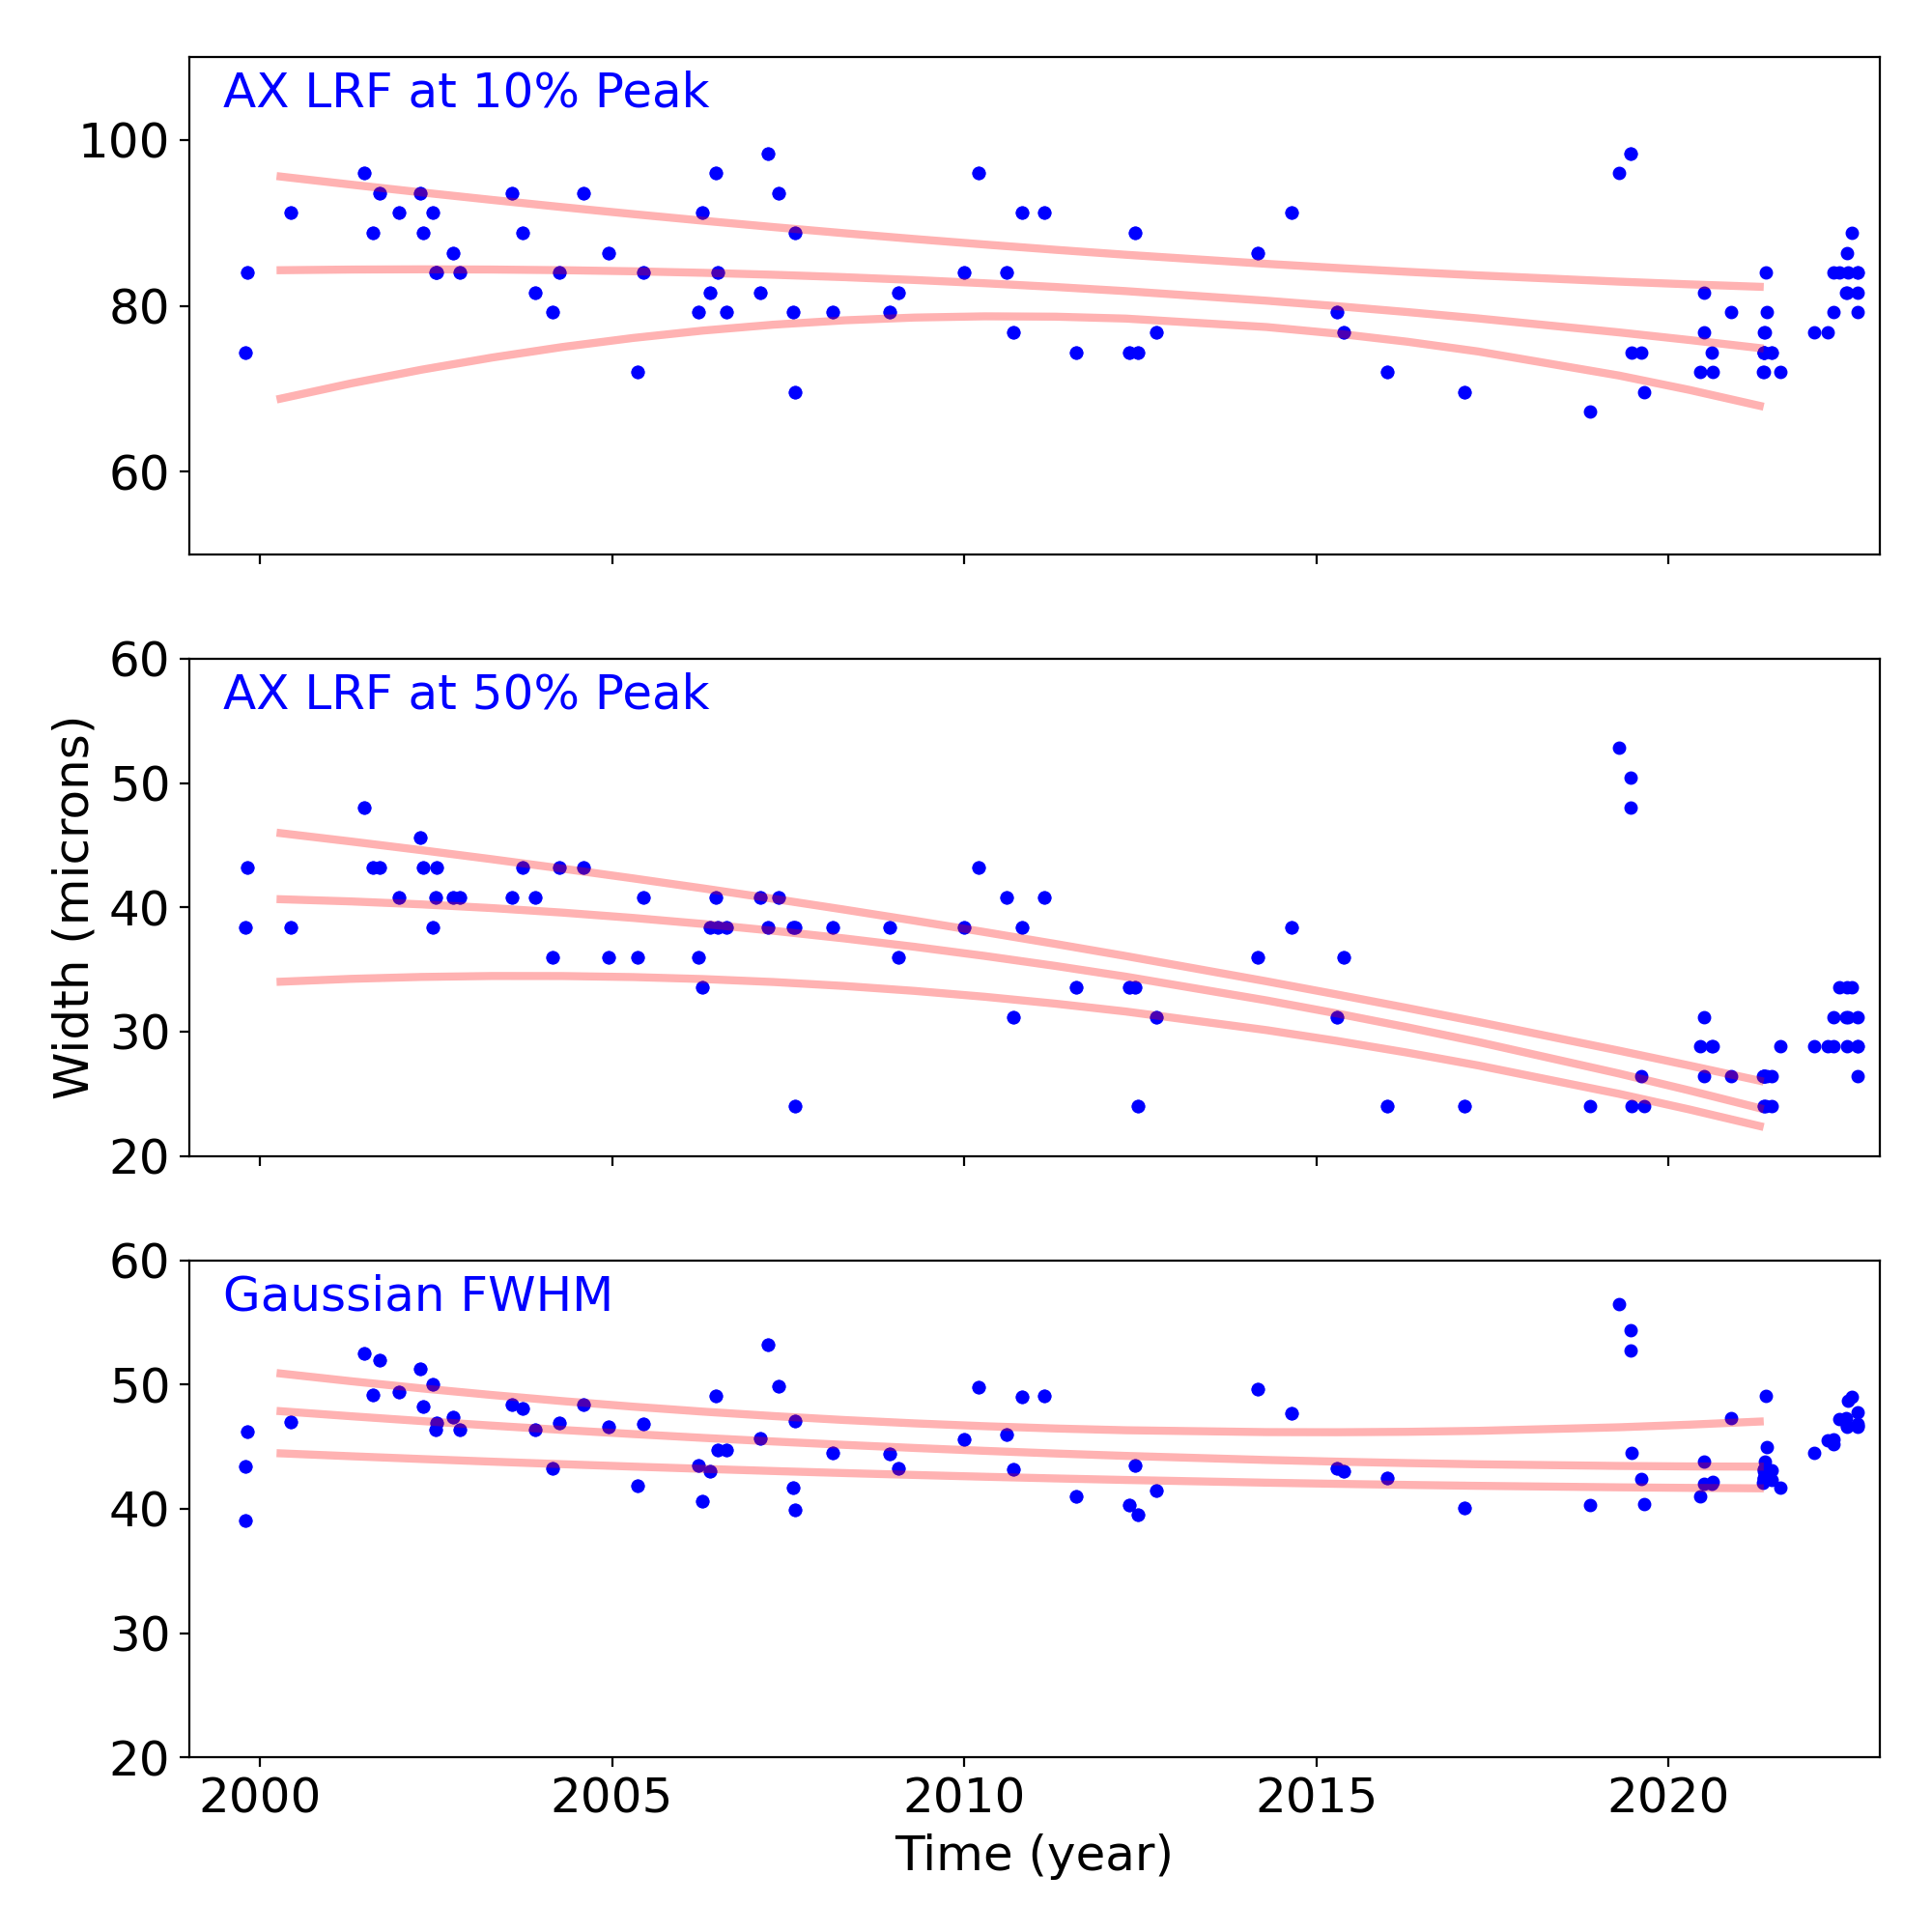
We plot the width of the zero order streak of ACIS/HETG observations and the width of the zero order image for HRC/LETG observations of point sources. No significant defocusing trend is seen at this time. See Gratings Trends pages.
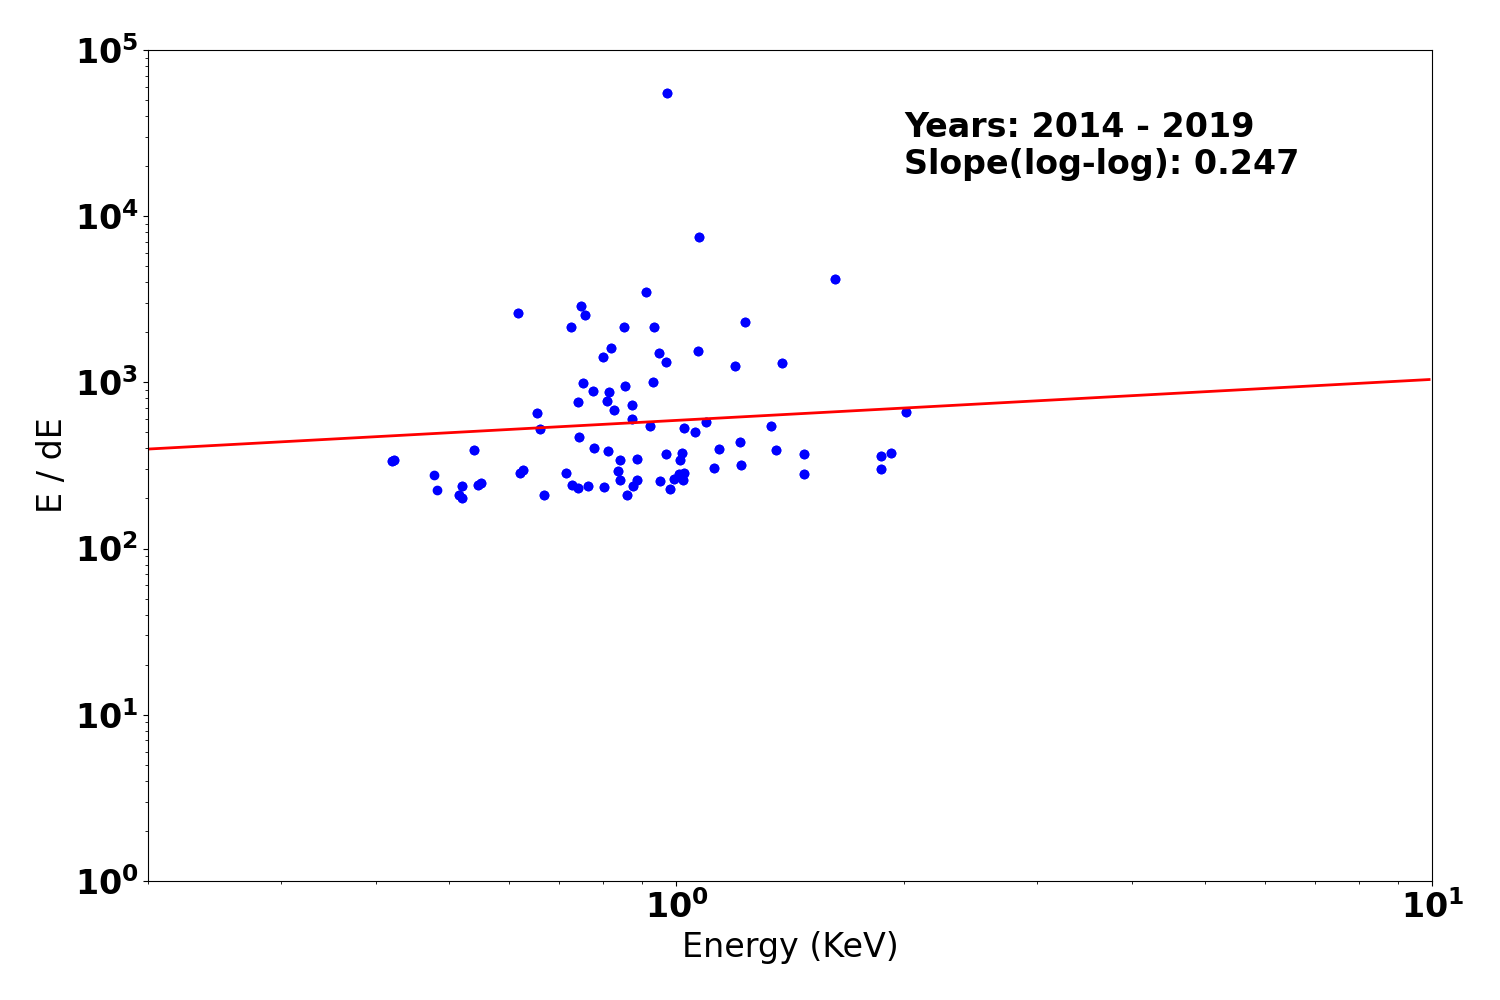
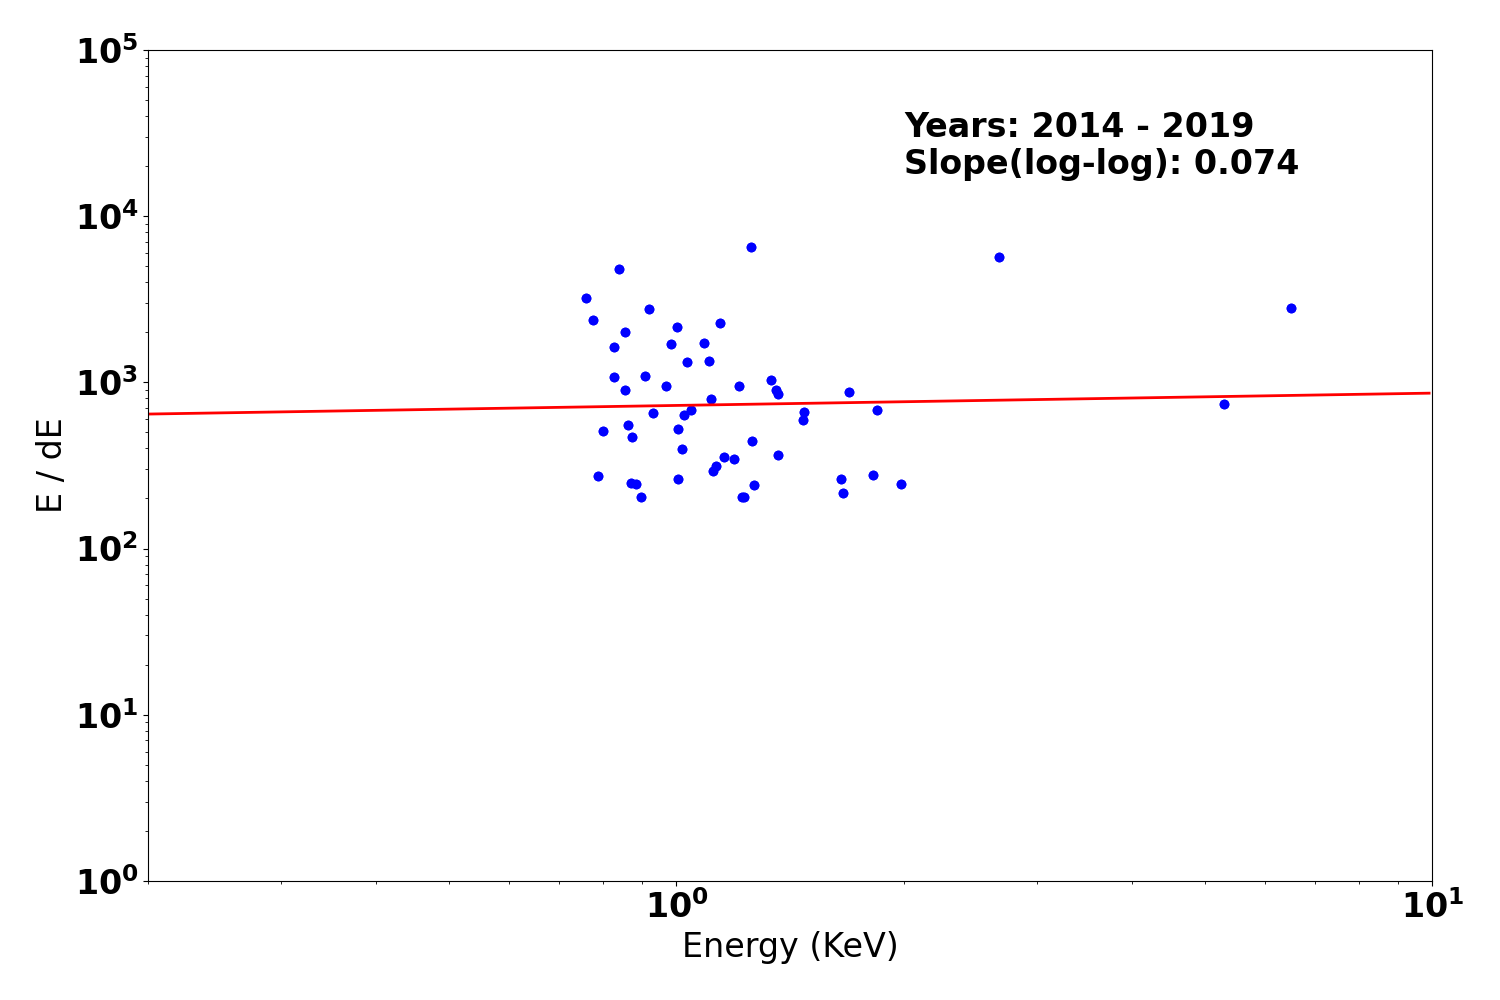
Gratings Resolving Power
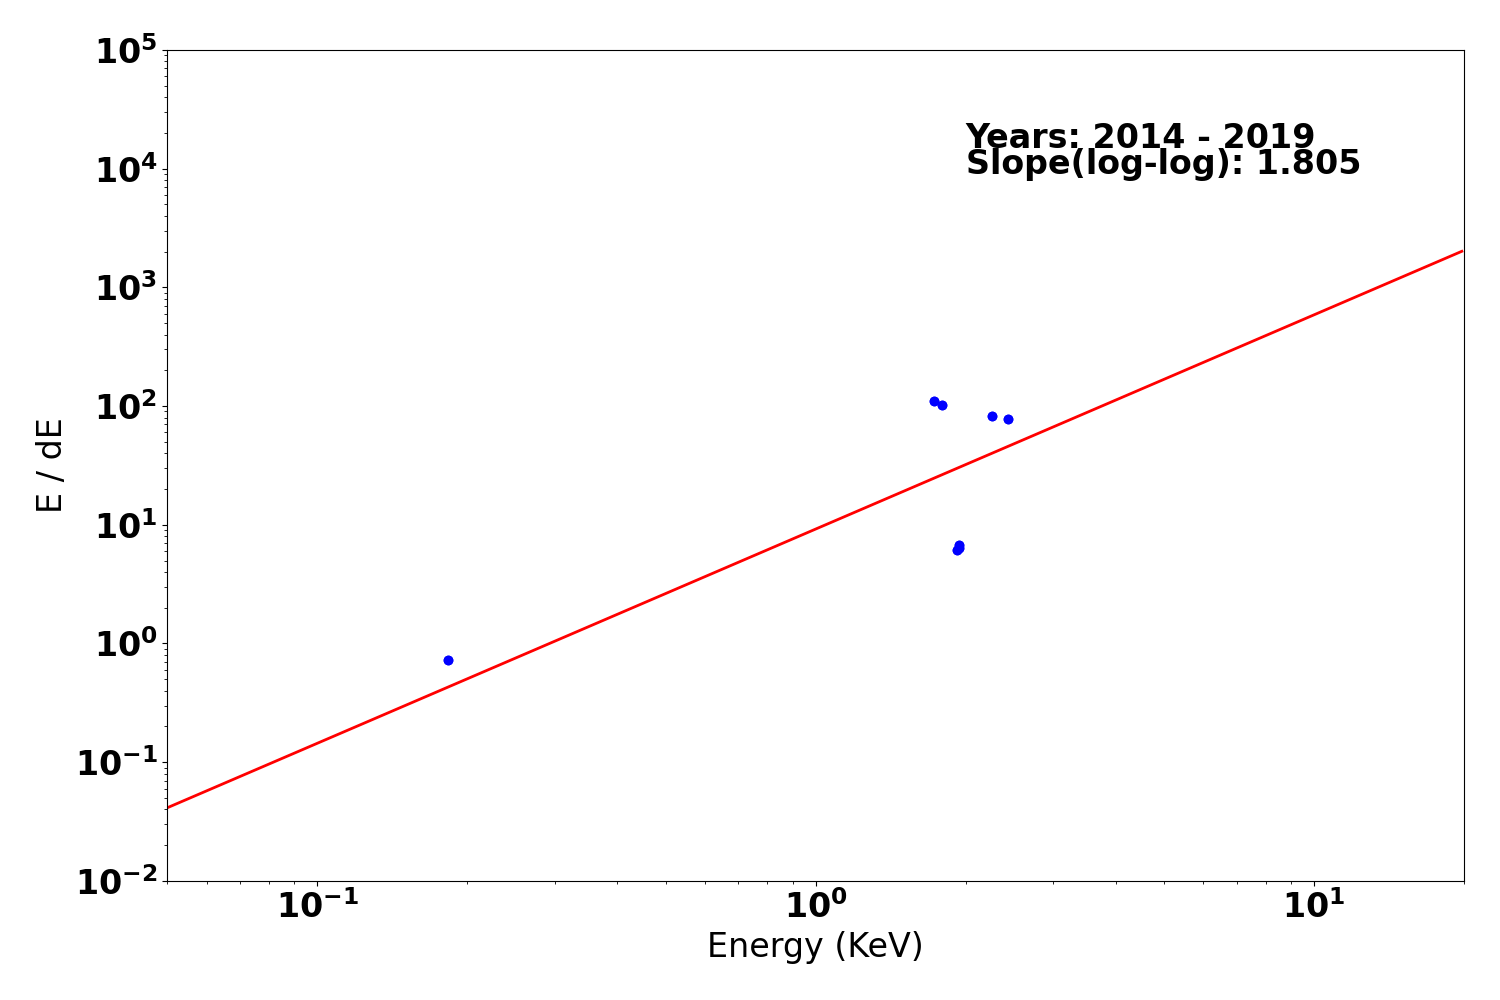
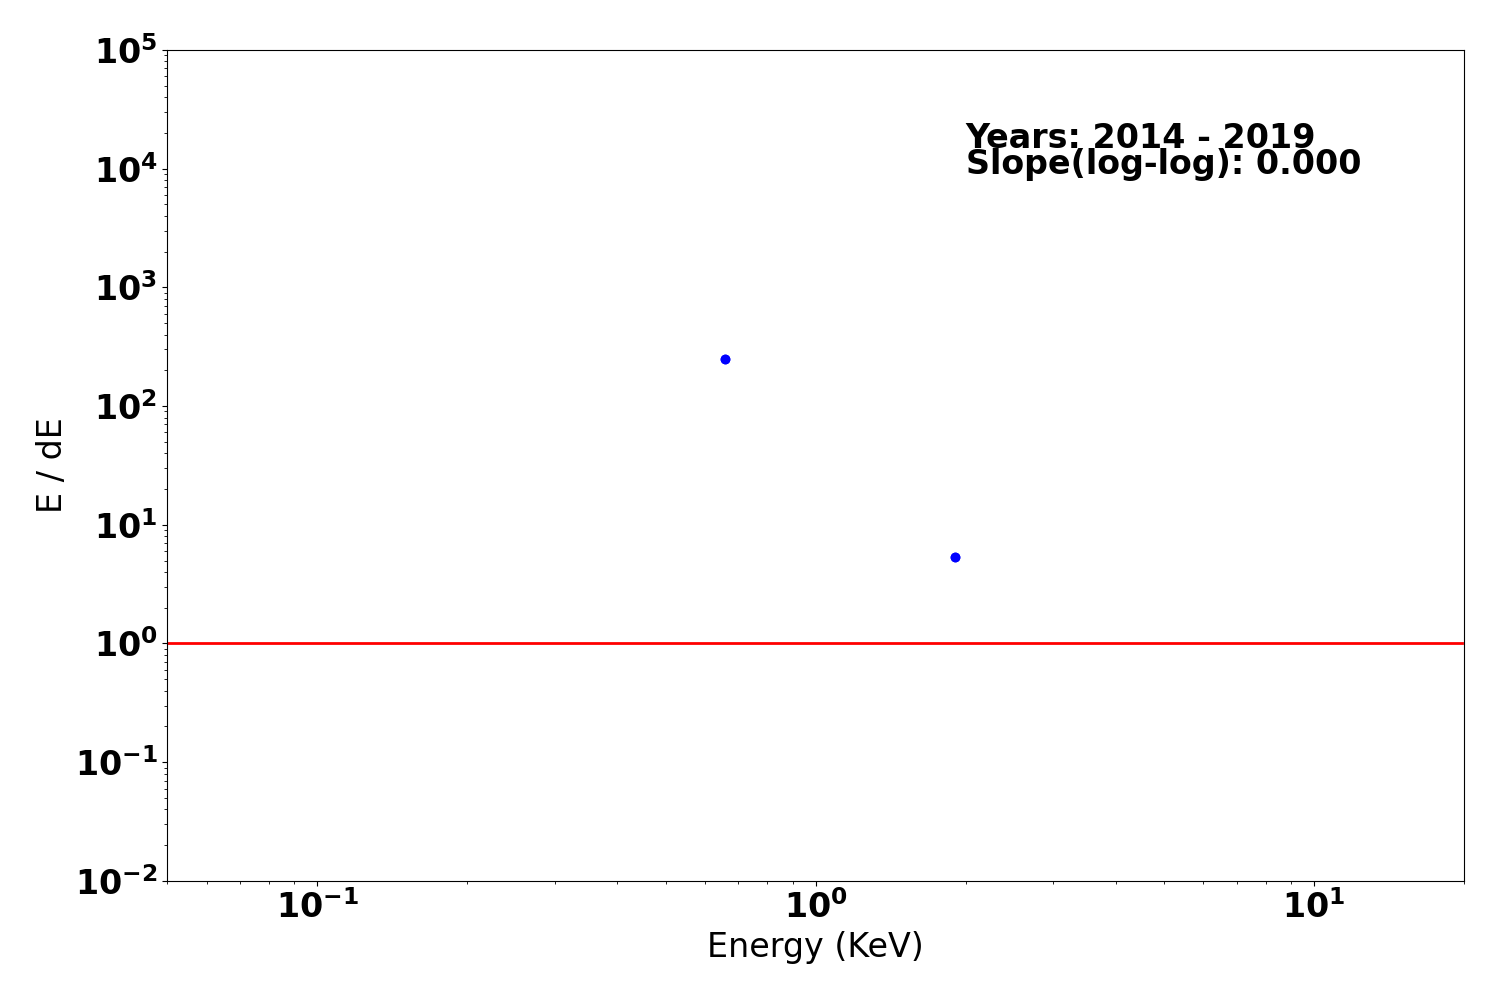
We plot E/dE vs. E for fits to detected lines with fwhm_error/fwhm less than 0.15 for the plus and minus arms of HEG, MEG, and LEG. Also shown are conservative (dotted line) and optimistic (dashed line) pre-launch resolving power expectations.
We have selected only calibration observations of Capella, HR1099, and Sigma Gem. See MIT technotes for a parallel analysis.
| Year 2014 - | |
|---|---|
| Letg minus side | Letg plus side |
 |
 |
| Metg minus side | Metg plus side |
 |
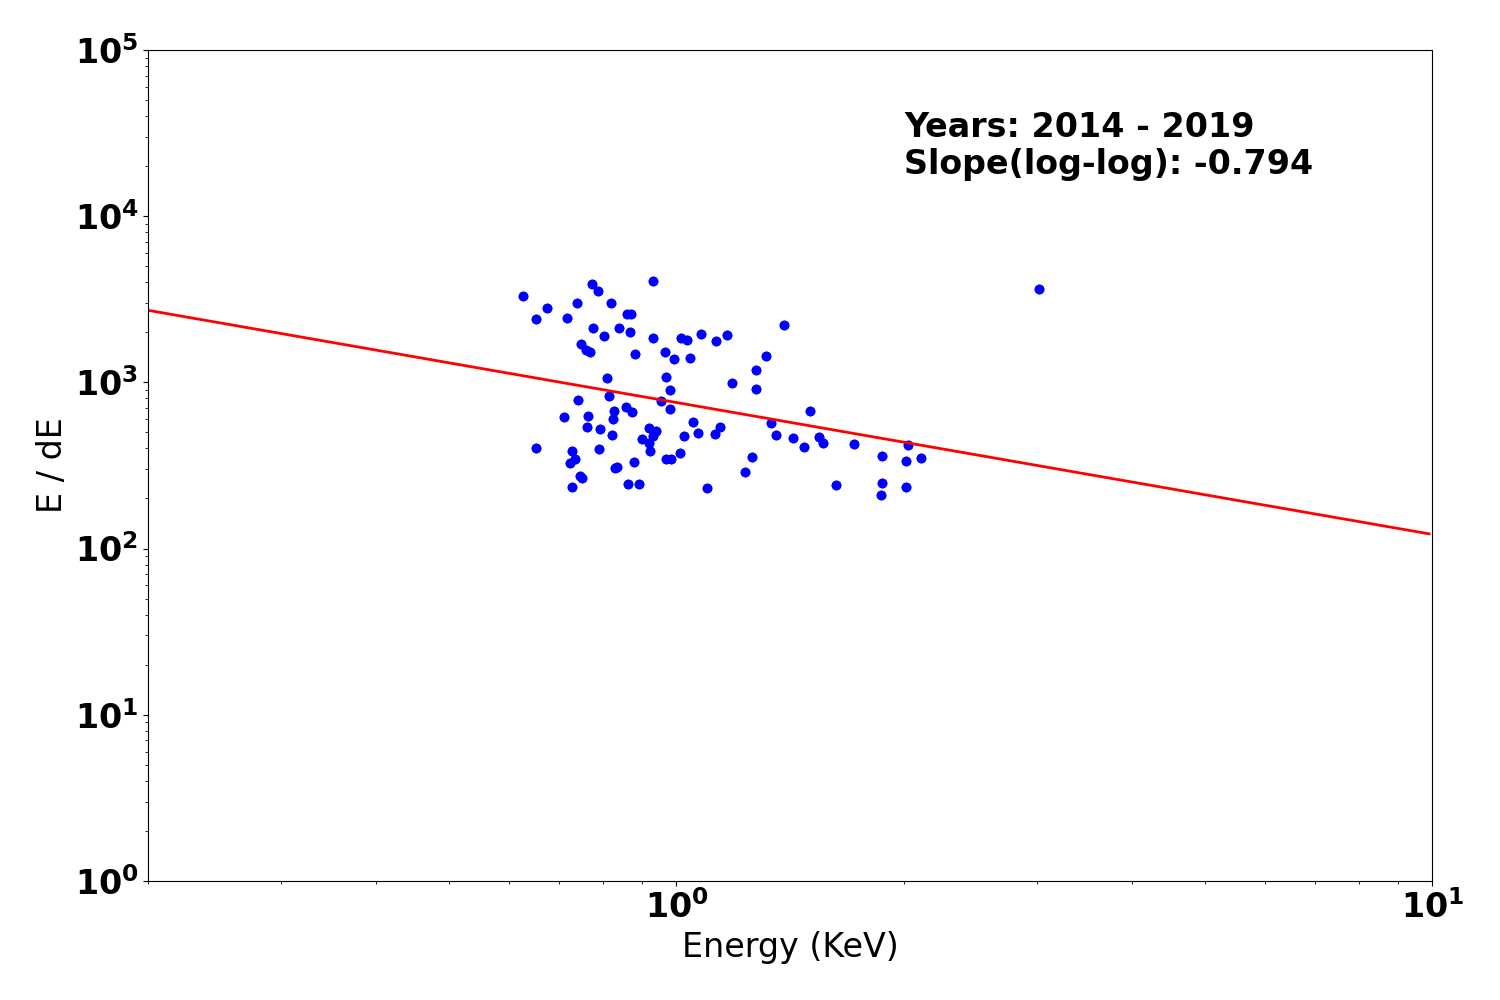 |
| Hetg minus side | Hetg plus side |
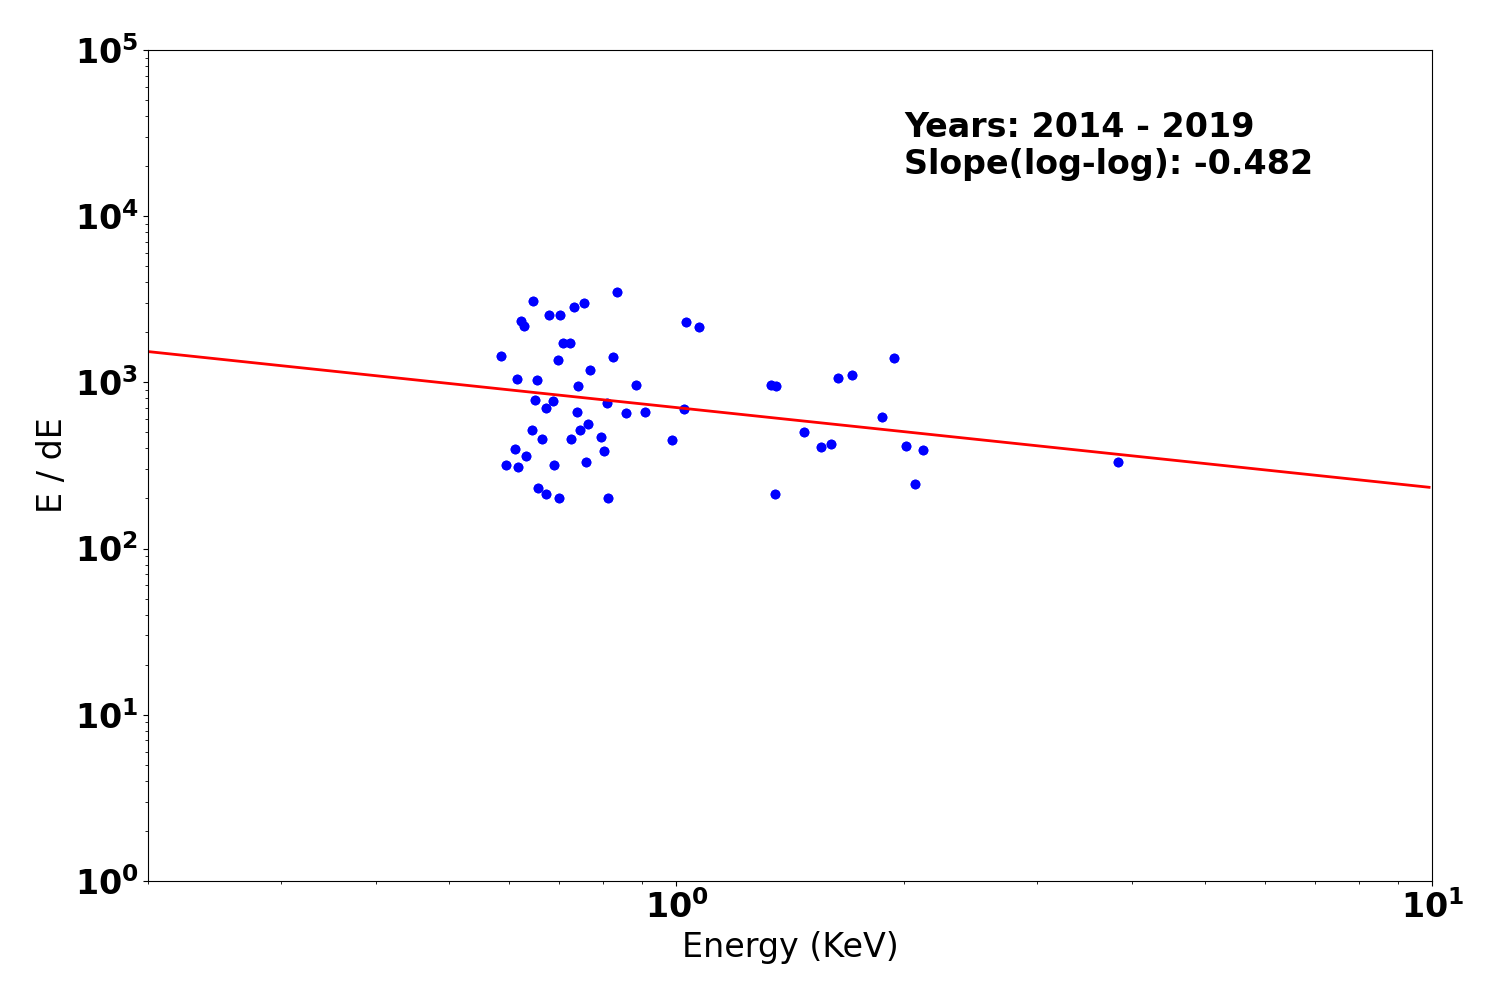 |
 |
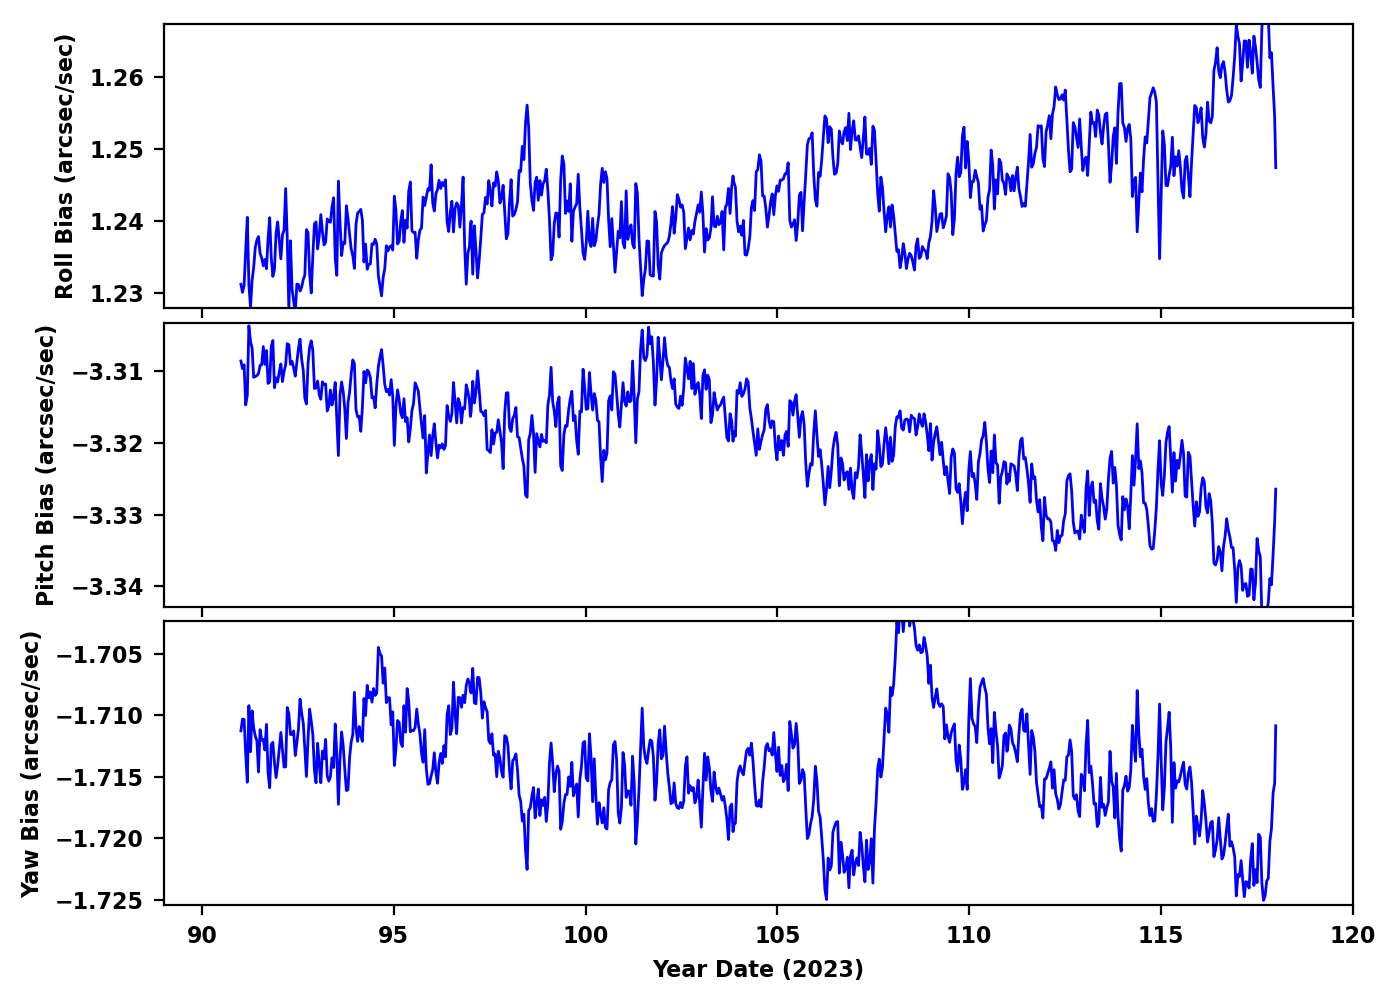
PCAD
ACA Trending
| ACIS |
)
|
)
|
)
|
|
|---|---|---|---|---|
)
|
)
|
)
| ||
| HRCI |
)
|
)
|
)
|
)
|
| HRCI |
)
|
)
|
)
|
)
|
Gyro Bias Drift
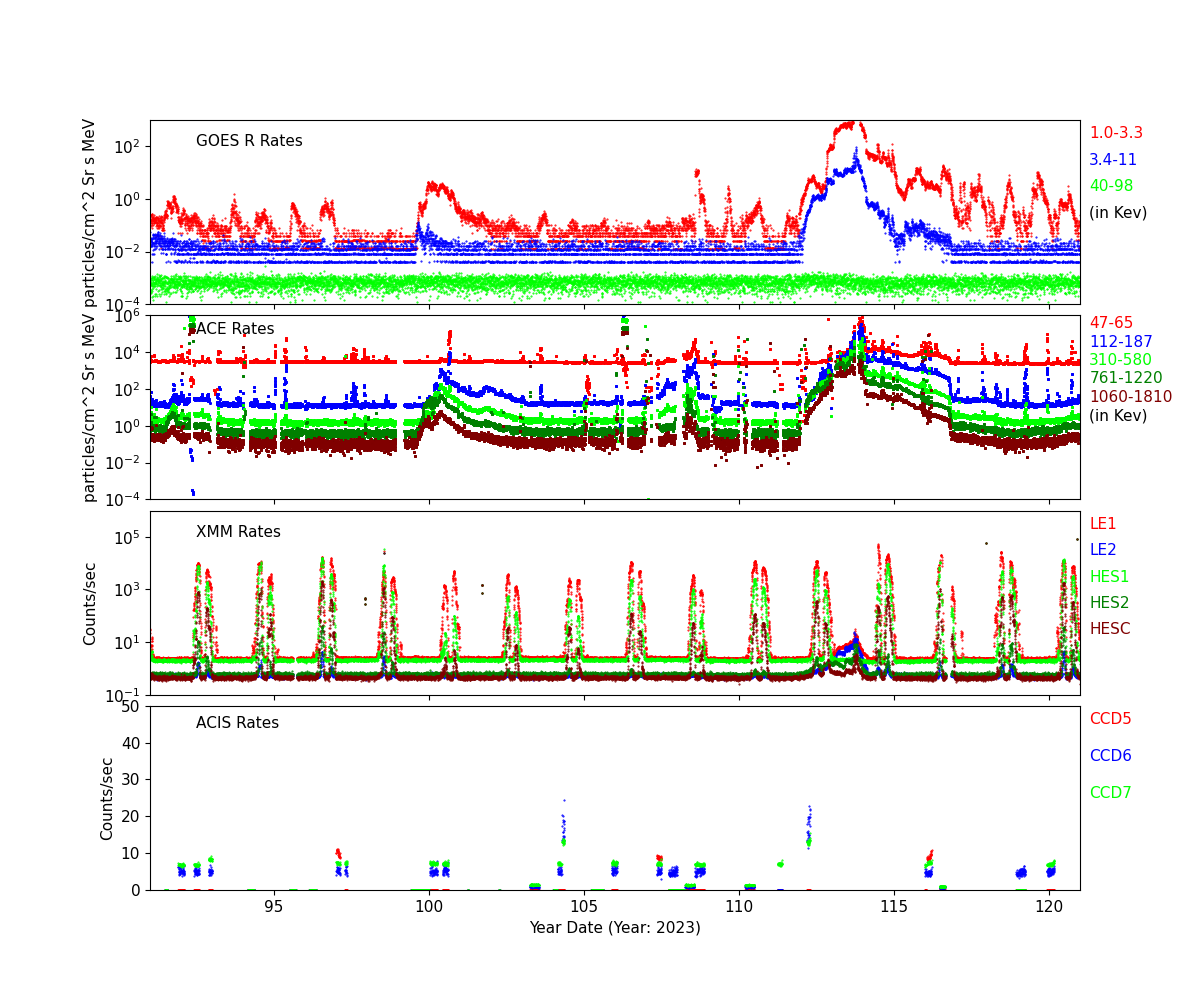
Radiation History
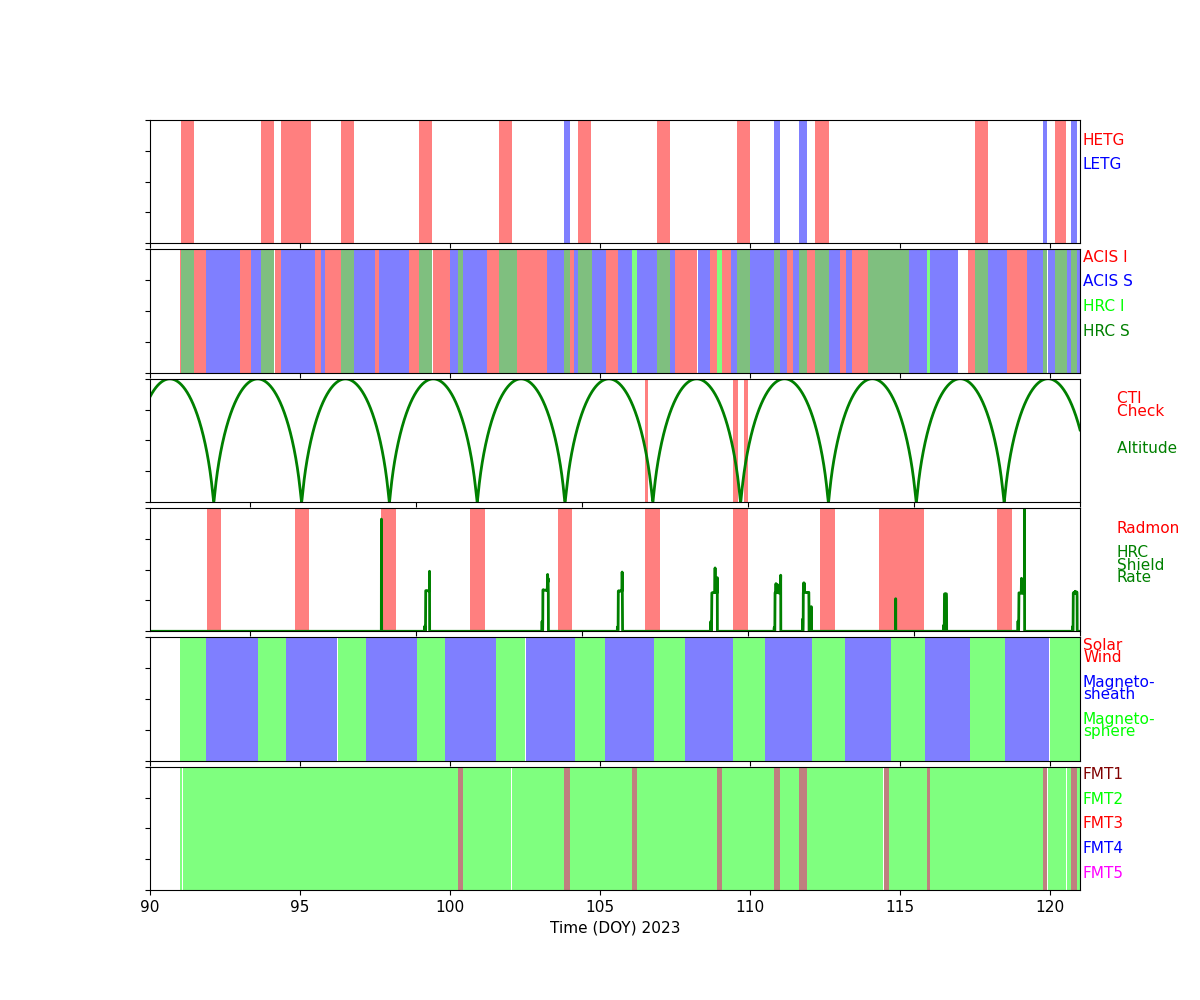
Radiation Count Rates of Apr 2023
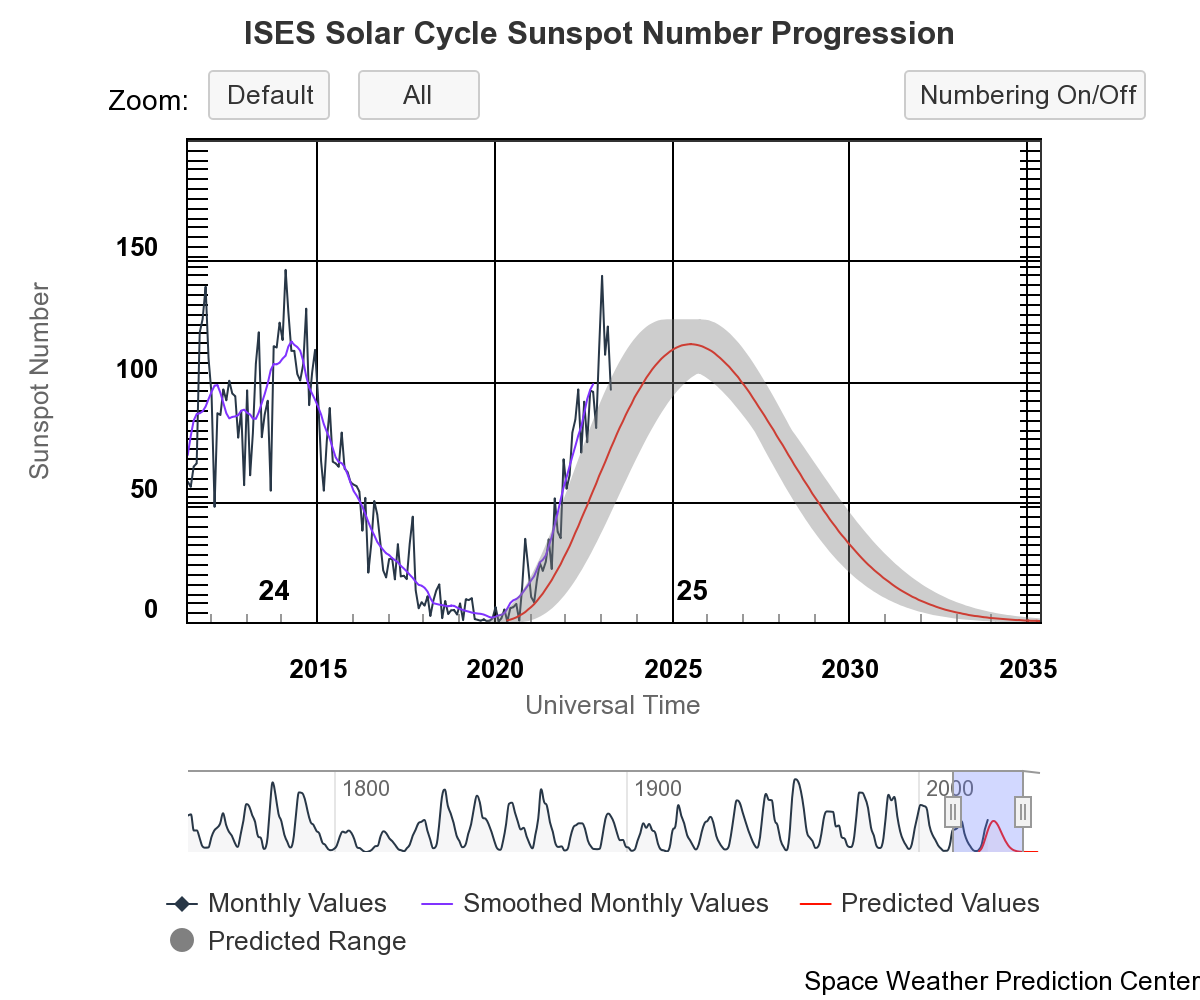
Sun Spot History (See:NOAA Page)
SIM
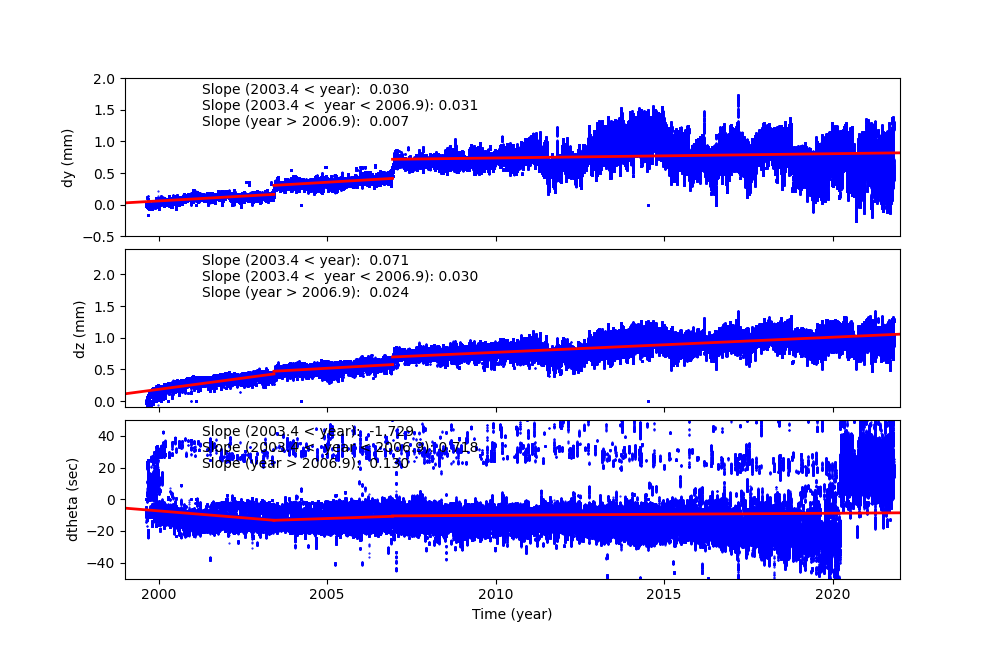
SIM Shift and Twist
SIM Shift and Twist Trend The following plots show trends of SIM shifts (dy and dz) and twist (dtheta). All quantities are directly taken from pcaf*_asol1.fits files. The units are mm for dy and dz, and degree for dtheta. We fit three lines separated before and after (Days of Mission)= 1400 (May 21, 2003), 2700 (Dec 11, 2006), and 4400 (Aug 07, 2011). The unit of slopes are mm per day or degree per day.
The sudden shift around DOM = 1400, 2700 and 4400 are due to fid light drift (see a memo by Aldcroft fiducial light drift). On the dtheta plot, two tracks are clearly observed. The track around 0.01 is due to HRC-I, and all others are clustered around -0.002. For more detail, please see SIM Shift and Twist Trend page
Trending
Quarterly Trends
- EPS Batteries
| Previous Quarter | |||||||
| MSID | MEAN | RMS | DELTA/YR | DELTA/YR/YR | UNITS | DESCRIPTION | |
| eb2ci | off | 2.786e-04 | 8.034e-05 | 0.34 +/- 0.19 | 0.02 +/- 0.03 | AMP | BATT 2 CHARGE CURRENT | on | -0.002 | 0.003 | 0.38 +/- 0.32 | -3.70 +/- 0.17 |
|---|---|---|---|---|---|---|---|
| eb2di | off | 7.519e-04 | 1.526e-04 | 0.04 +/- 0.35 | -0.02 +/- 0.05 | AMP | BATT 2 DISCHARGE CURRENT | on | 0.006 | 0.010 | 0.27 +/- 1.03 | -5.62 +/- 0.34 |
| eb2v | off | -0.002 | 8.343e-05 | 32.28 +/- 0.20 | -0.00 +/- 0.03 | V | BATT 2 VOLTAGE | on | -0.007 | 0.004 | 32.17 +/- 0.46 | 2.14 +/- 0.14 |
| ecnv1v | 2.090e-05 | 6.027e-06 | 14.89 +/- 0.01 | -0.00 +/- 0.00 | V | CONV 1 +15V OUTPUT | |
| ecnv2v | -4.087e-05 | 4.765e-06 | 14.84 +/- 0.01 | (6.52+/-22.58)e-4 | V | CONV 2 +15V OUTPUT | |
| ecnv3v | 3.471e-05 | 2.686e-06 | 15.28 +/- 0.01 | -(6.26+/-9.81)e-4 | V | CONV 3 +15V OUTPUT | |
- Spacecraft Electronics
| Previous Quarter | |||||||
| MSID | MEAN | RMS | DELTA/YR | DELTA/YR/YR | UNITS | DESCRIPTION | |
| elbi | 0.003 | 5.466e-04 | 52.98 +/- 1.29 | 0.20 +/- 0.21 | AMP | LOAD BUS CURRENT | |
|---|---|---|---|---|---|---|---|
| elbv | off | 0.003 | 6.800e-05 | 27.52 +/- 0.19 | 0.02 +/- 0.02 | V | LOAD BUS VOLTAGE | on | 0.007 | 0.003 | 27.71 +/- 0.36 | -0.81 +/- 0.42 |
- OBA Heater
| Previous Quarter | |||||||
| MSID | MEAN | RMS | DELTA/YR | DELTA/YR/YR | UNITS | DESCRIPTION | |
| oobthr04 | -0.005 | 0.001 | (3.03+/-0.03)e2 | 0.02 +/- 0.53 | K | RT 27: HRMA STRUT | |
|---|---|---|---|---|---|---|---|
| oobthr12 | -0.005 | 0.001 | (3.02+/-0.03)e2 | 0.11 +/- 0.79 | K | RT 35: OBA CONE | |
| oobthr26 | -0.006 | 0.002 | (3.06+/-0.05)e2 | 0.14 +/- 1.14 | K | RT 48: OBA CONE | |
| oobthr38 | 1.918e-05 | 4.494e-04 | (2.72+/-0.01)e2 | 0.01 +/- 0.04 | K | RT 60: TFTE CONE | |
| oobthr44 | -0.005 | 0.001 | (3.04+/-0.03)e2 | 0.25 +/- 0.81 | K | RT 66: TFTE COVER | |
| oobthr50 | -0.012 | 0.001 | (2.99+/-0.03)e2 | 0.01 +/- 0.68 | K | RT 76: S/C STRUT | |
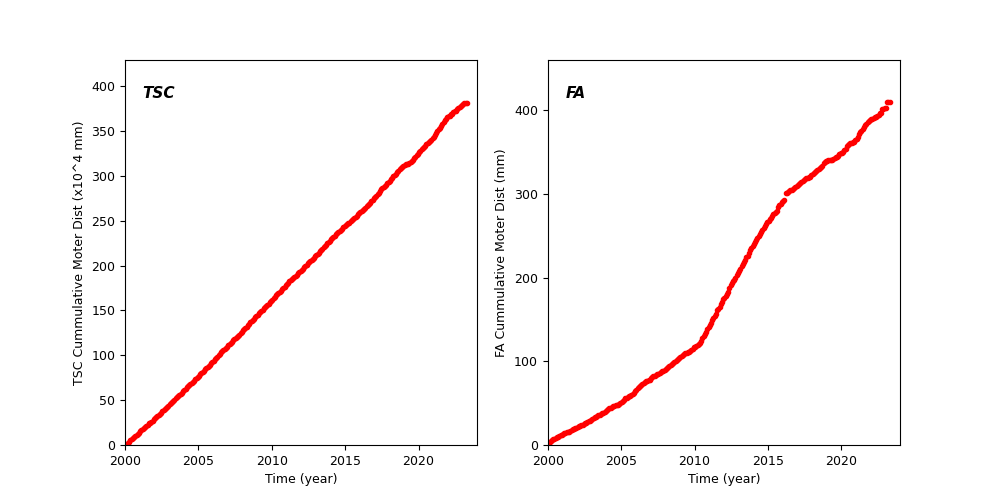
Spacecraft Motions
TSC and FA Cummulative Moter Distance
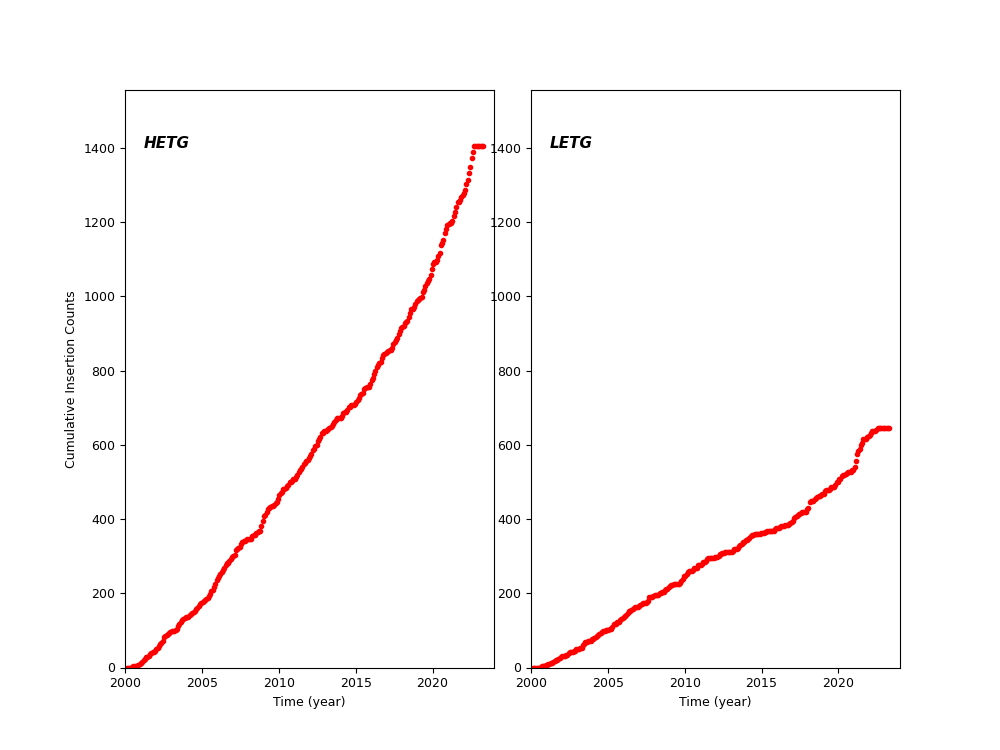
HETG and LETG Cummulative Insertion Counts
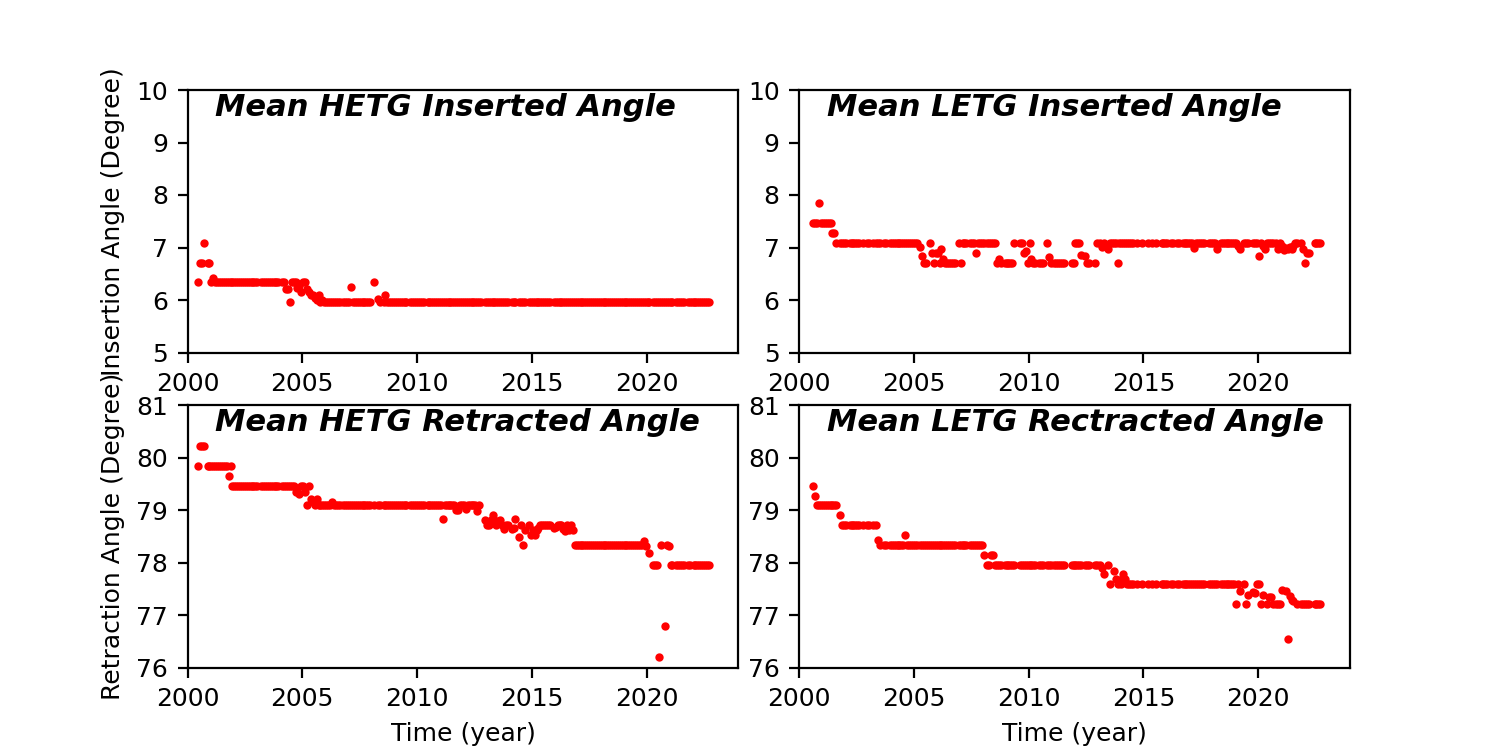
HETG/LETG Insertion/Retraction Angle
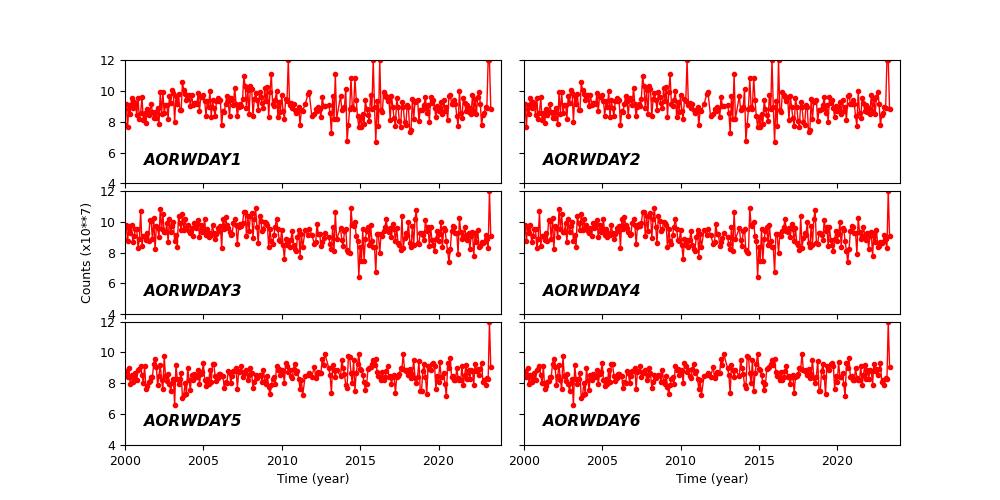
Reaction Wheel Rotations