ACIS
ACIS DOSE Registered-Photon-Map
The steps we took to compute the dose map are;
- Level 1 Event files for a specified month are obtained from archive.
- Image data including I2, I3, S2, S3 CCDs are extracted from all event files.
- All the extracted image data were merged to create a month long exposure map for the month.
- The exposure map is opened with ds9, and check a distribution of count rates against energy. From this, estimate the upper threshold value. Any events beyond this upper threshold are assumed erroneous events such as bad pixels.
- Using this upper threshold, the data is filtered, and create a cleaned exposure map for the month.
- The exposure map from each month from the Sep 1999 is added up to create a cumulative exposure map for each month.
- Using fimgstatistic, we compute count rate statistics for each CCDs.
- For observations with high data drop rates (e.g., Crab nebula, Cas A), we corrected the observations by adding events.
Please check more detail plots at Telemetered Photon Dose Trend page.
)
)
)
Statistics:
# IMAGE     NPIX     MEAN        RMS        MIN     MAX
ACIS_may23 6004901       5.362         8.679           0.0     5995


I2 node 0  262654	5.442163	2.998228	0.0	135.0
I2 node 1  262654	6.293662	7.539844	0.0	3351.0
I2 node 2  262654	6.128046	3.056553	0.0	172.0
I2 node 3  262654	6.165762	11.449611	0.0	4327.0

I3 node 0  262654	6.933130	4.129284	0.0	110.0
I3 node 1  262654	6.548778	3.228321	0.0	227.0
I3 node 2  262654	6.518102	3.098892	0.0	107.0
I3 node 3  262654	5.919727	5.905623	0.0	2388.0

S2 node 0  262654	7.178673	18.713088	0.0	5995.0
S2 node 1  262654	7.740317	6.162530	0.0	753.0
S2 node 2  262654	8.285095	11.882095	0.0	4841.0
S2 node 3  262654	7.989477	9.917730	0.0	3105.0

S3 node 0  262654	8.249586	7.813701	0.0	182.0
S3 node 1  262654	9.939628	7.064891	0.0	1529.0
S3 node 2  262654	9.055113	5.233642	0.0	178.0
S3 node 3  262654	7.182400	3.538827	0.0	177.0
)
)
)
Statistics:
 IMAGE     NPIX      MEAN        RMS           MIN      MAX
ACIS_total   6004901       2638.996         3365.953           0.0   148219


I2 node 0  262654	2292.928908	463.631891	490.0	14380.0
I2 node 1  262654	2414.832759	667.437719	504.0	146213.0
I2 node 2  262654	2443.279427	517.332663	527.0	15346.0
I2 node 3  262654	2448.339585	633.054761	488.0	31660.0

I3 node 0  262654	2634.128716	648.172932	490.0	14348.0
I3 node 1  262654	2716.099403	1746.050857	516.0	55934.0
I3 node 2  262654	2427.886594	453.414460	487.0	14619.0
I3 node 3  262654	2408.680903	488.410766	457.0	35370.0

S2 node 0  262654	3076.252937	499.767283	1666.0	22487.0
S2 node 1  262654	3262.467795	742.159268	1849.0	17605.0
S2 node 2  262654	3609.293298	743.340573	2264.0	31632.0
S2 node 3  262654	3571.076143	598.237304	1995.0	77696.0

S3 node 0  262654	5459.059992	2969.660164	2399.0	54660.0
S3 node 1  262654	6674.516484	2382.047318	0.0	62613.0
S3 node 2  262654	5403.960899	1363.197279	2504.0	27396.0
S3 node 3  262654	4228.800261	762.828220	2556.0	26561.0
)
|
)
|
)
|
)
|
| Feb 2023 | Nov 2022 | Aug 2022 | May 2022 |
|---|
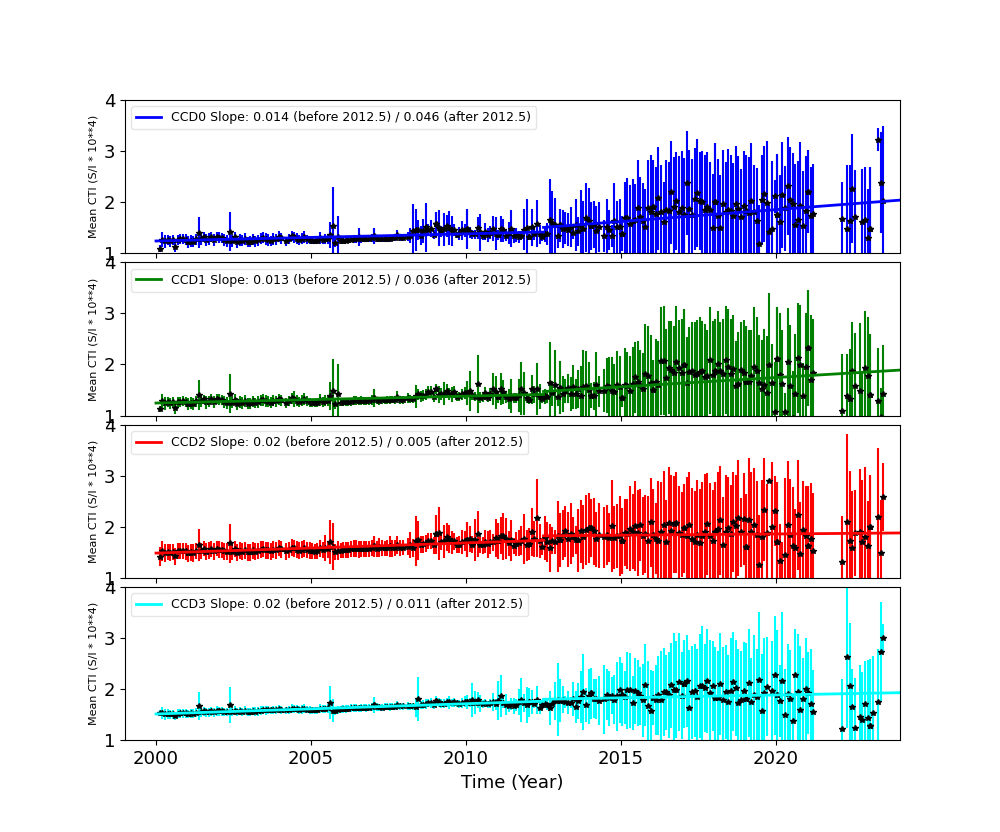
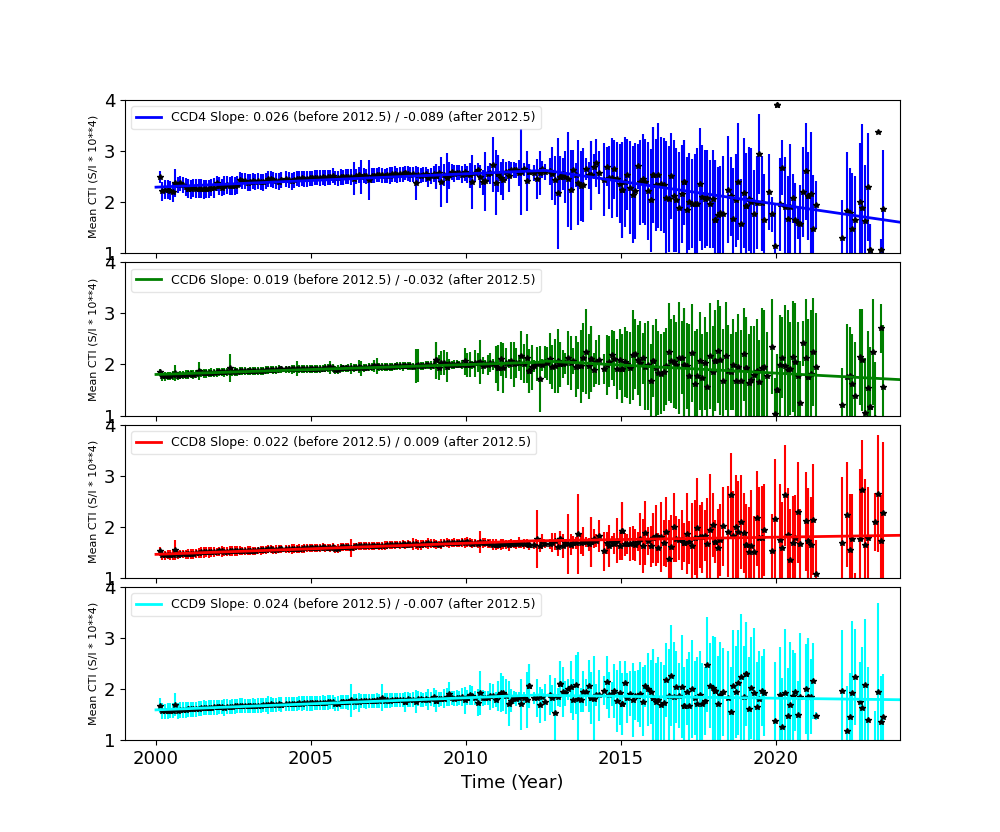
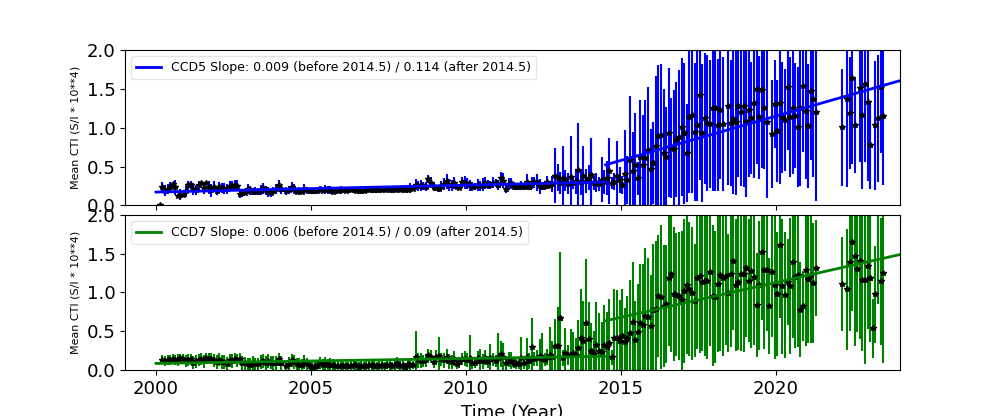
The Mean Detrended CTI
We report CTIs with a refined data definition. CTIs were computed for the temperature dependency corrected data. Please see CTI page for detailed explanation. CTI's are computed for Mn K alpha, and defined as slope/intercept x10^4 of row # vs ADU. Data file: here
Imaging CCDs
Spectral CCDs
Backside CCDs
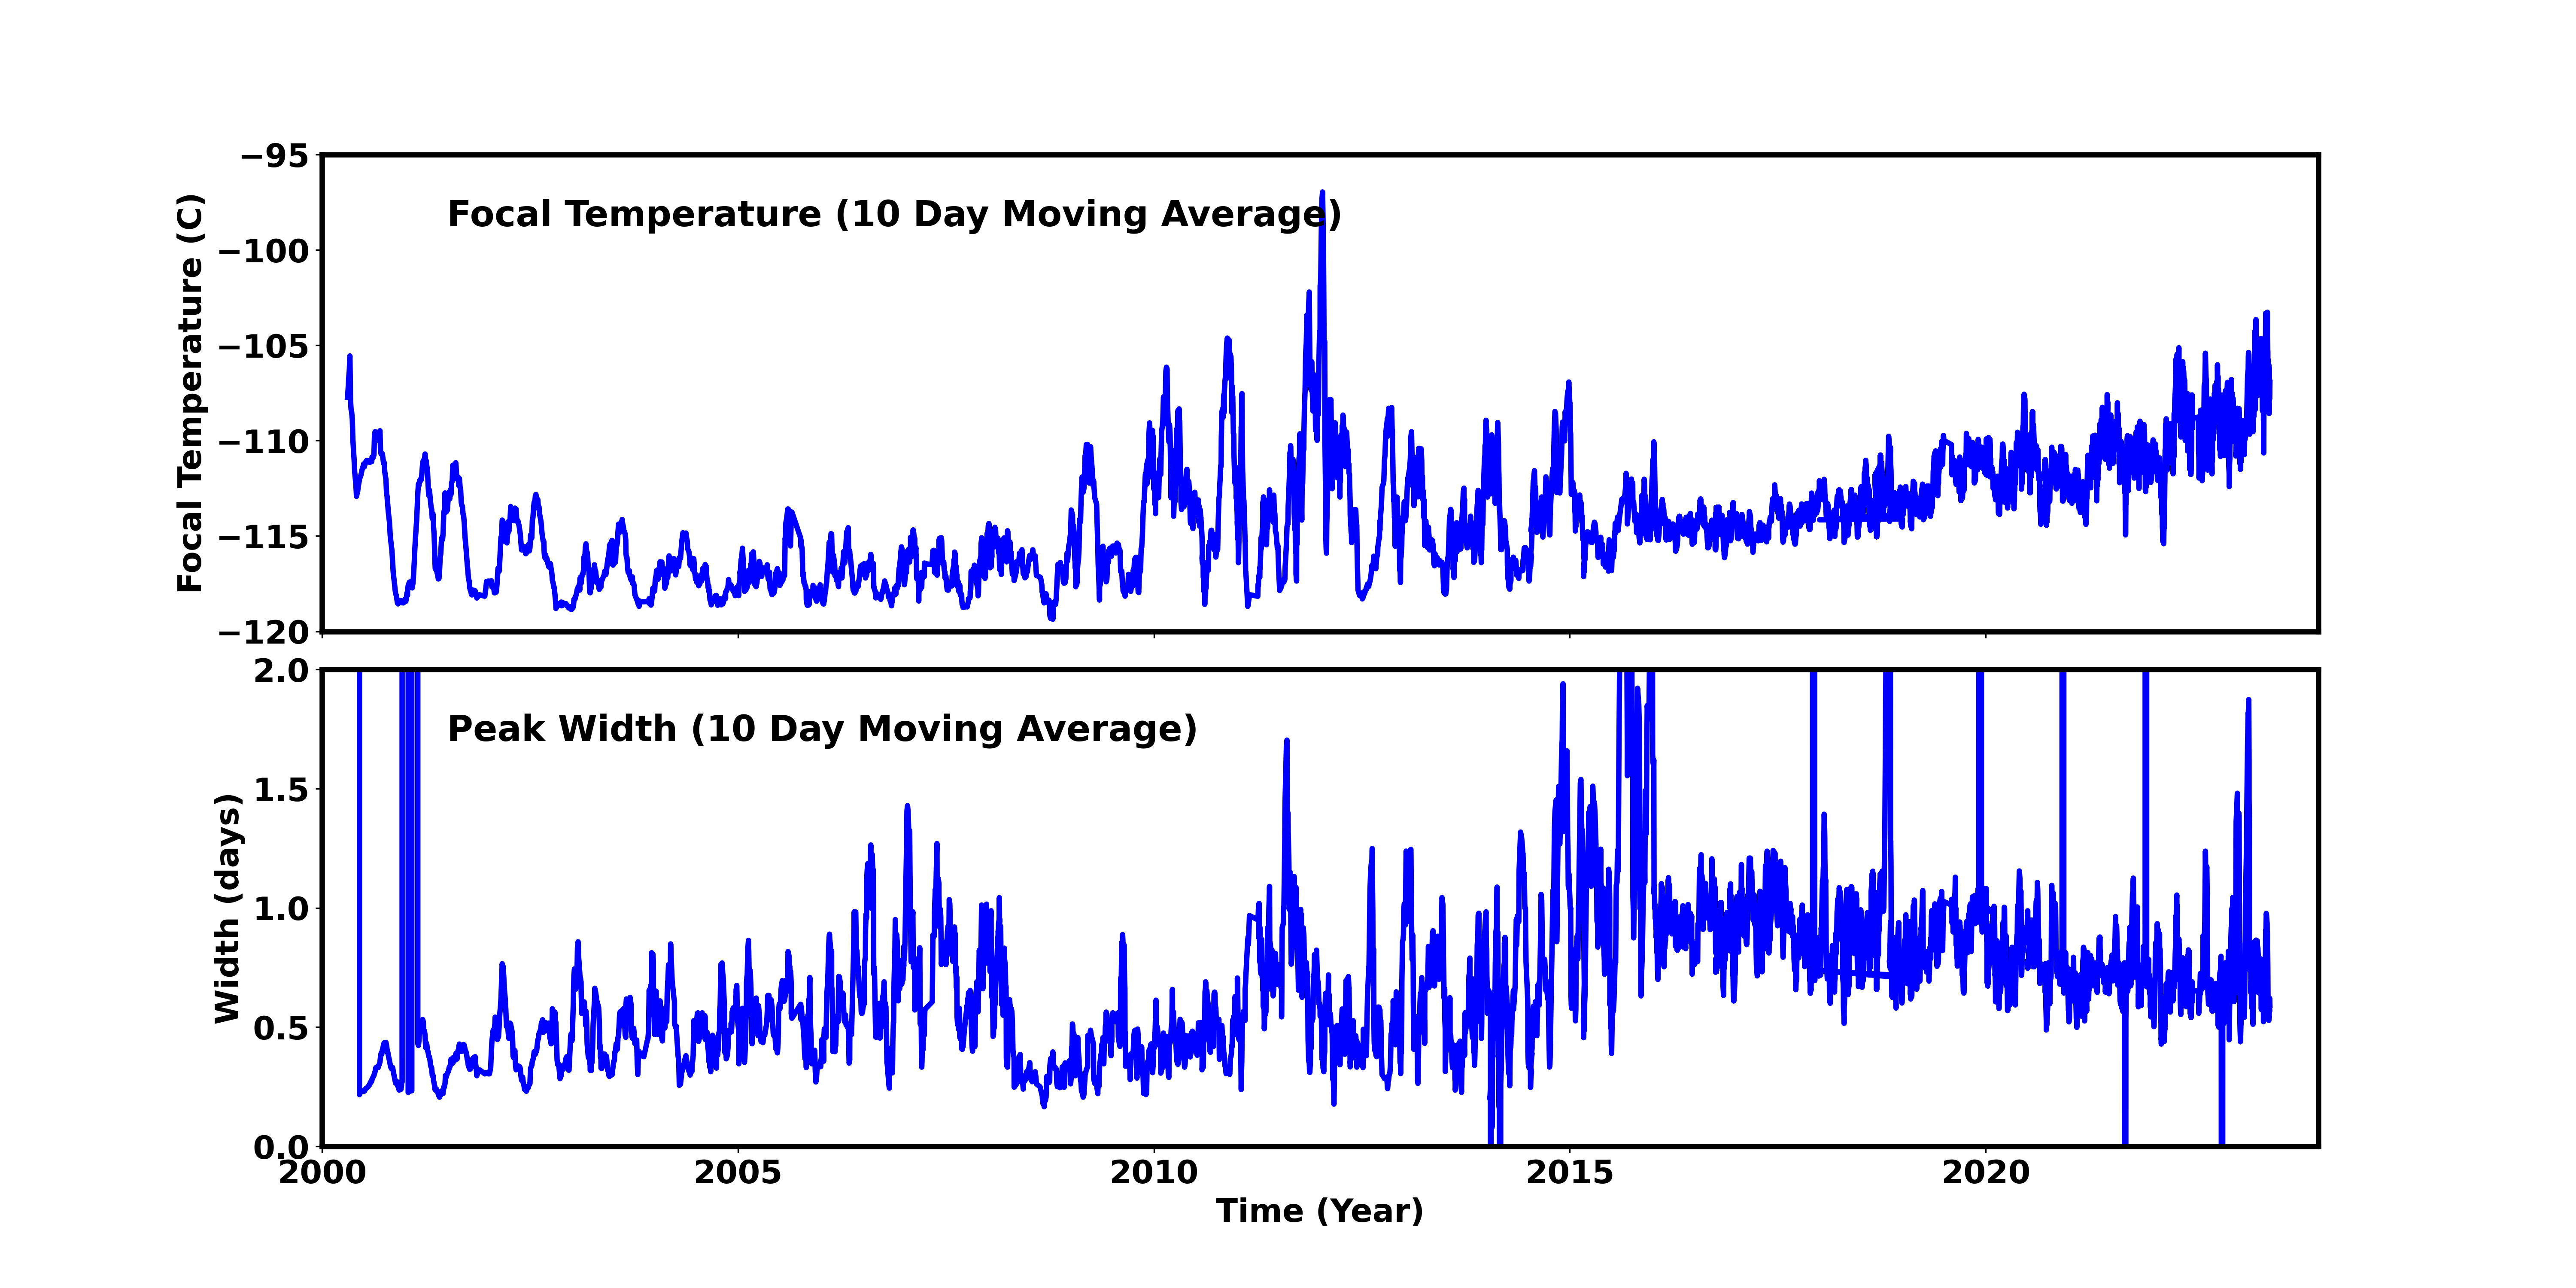
Focal Plane Temperature
May 2023 Focal Temperature
| The Mean (max) FPT: | |
|---|---|
| -106.46 | +/- 8.46 C |
| Mean Width: | |
| 0.7 | +/- 0.32 days |
Averaged Focal Plane Temperature
We are using 10 period moving averages to show trends of peak temperatures and peak widths. Note, the gaps in the width plot are due to missing/corrupted data.
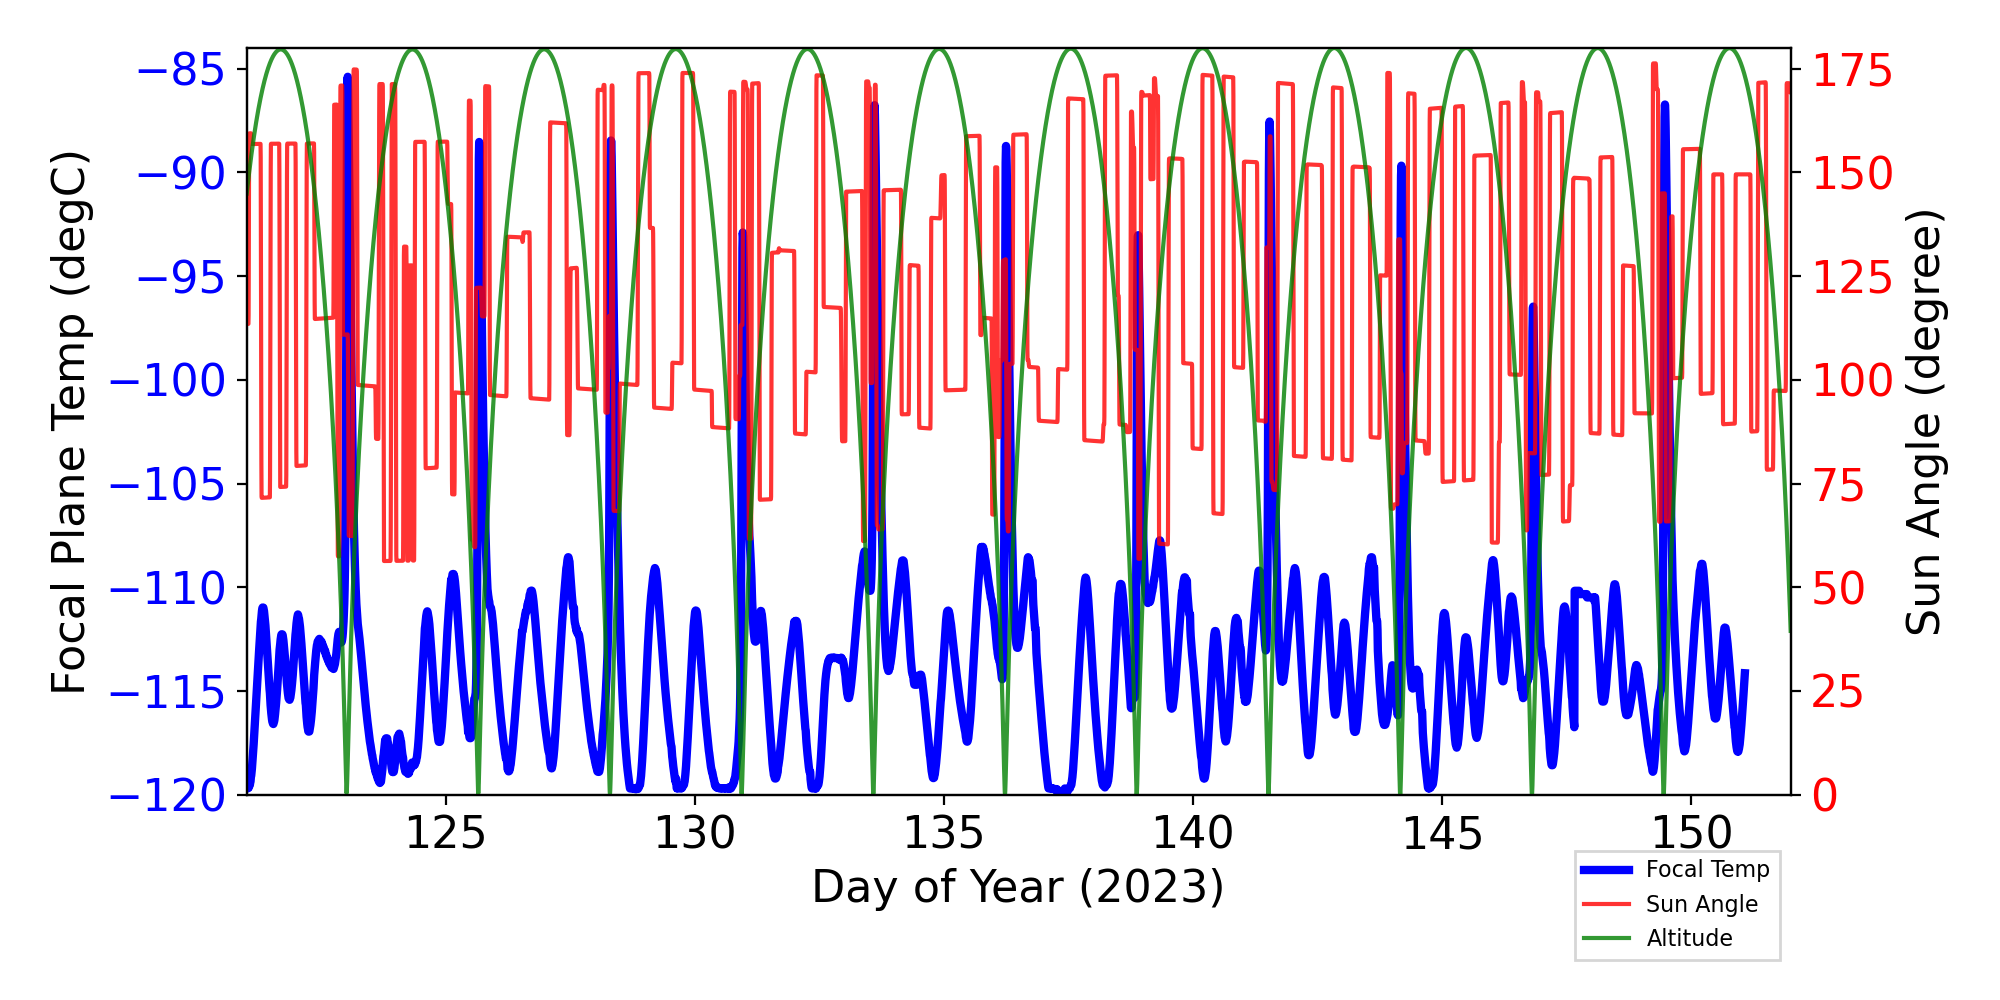
Focal Plane Temperature, Sun Angle and Altitude
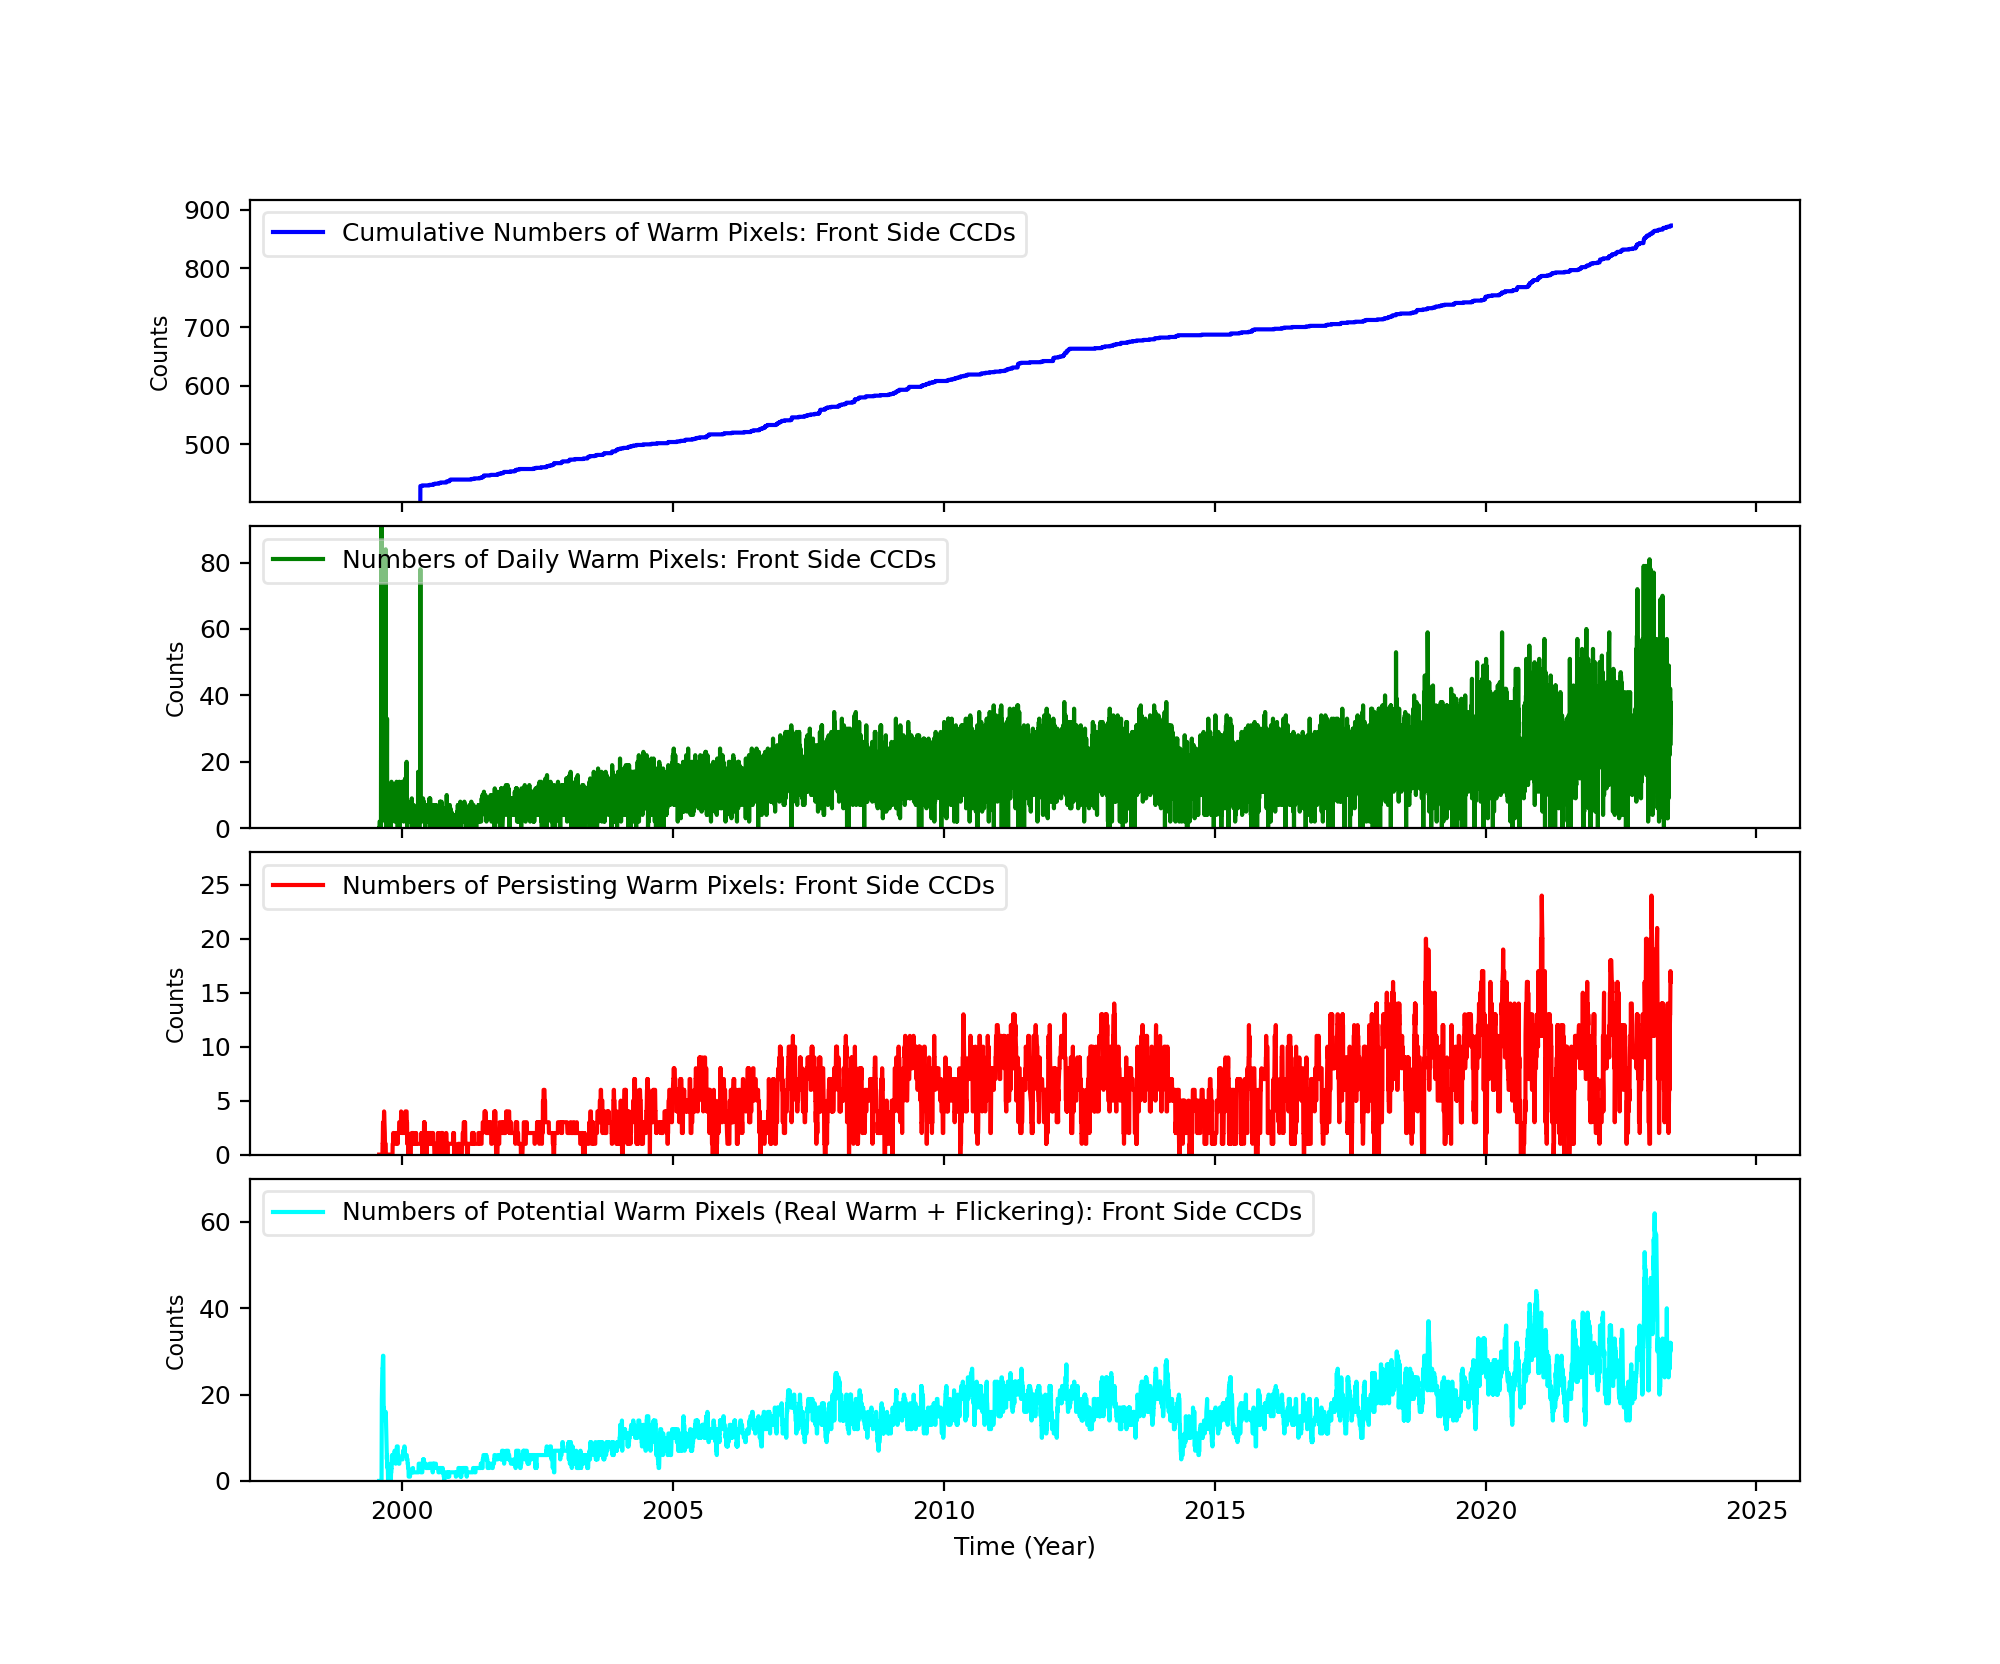
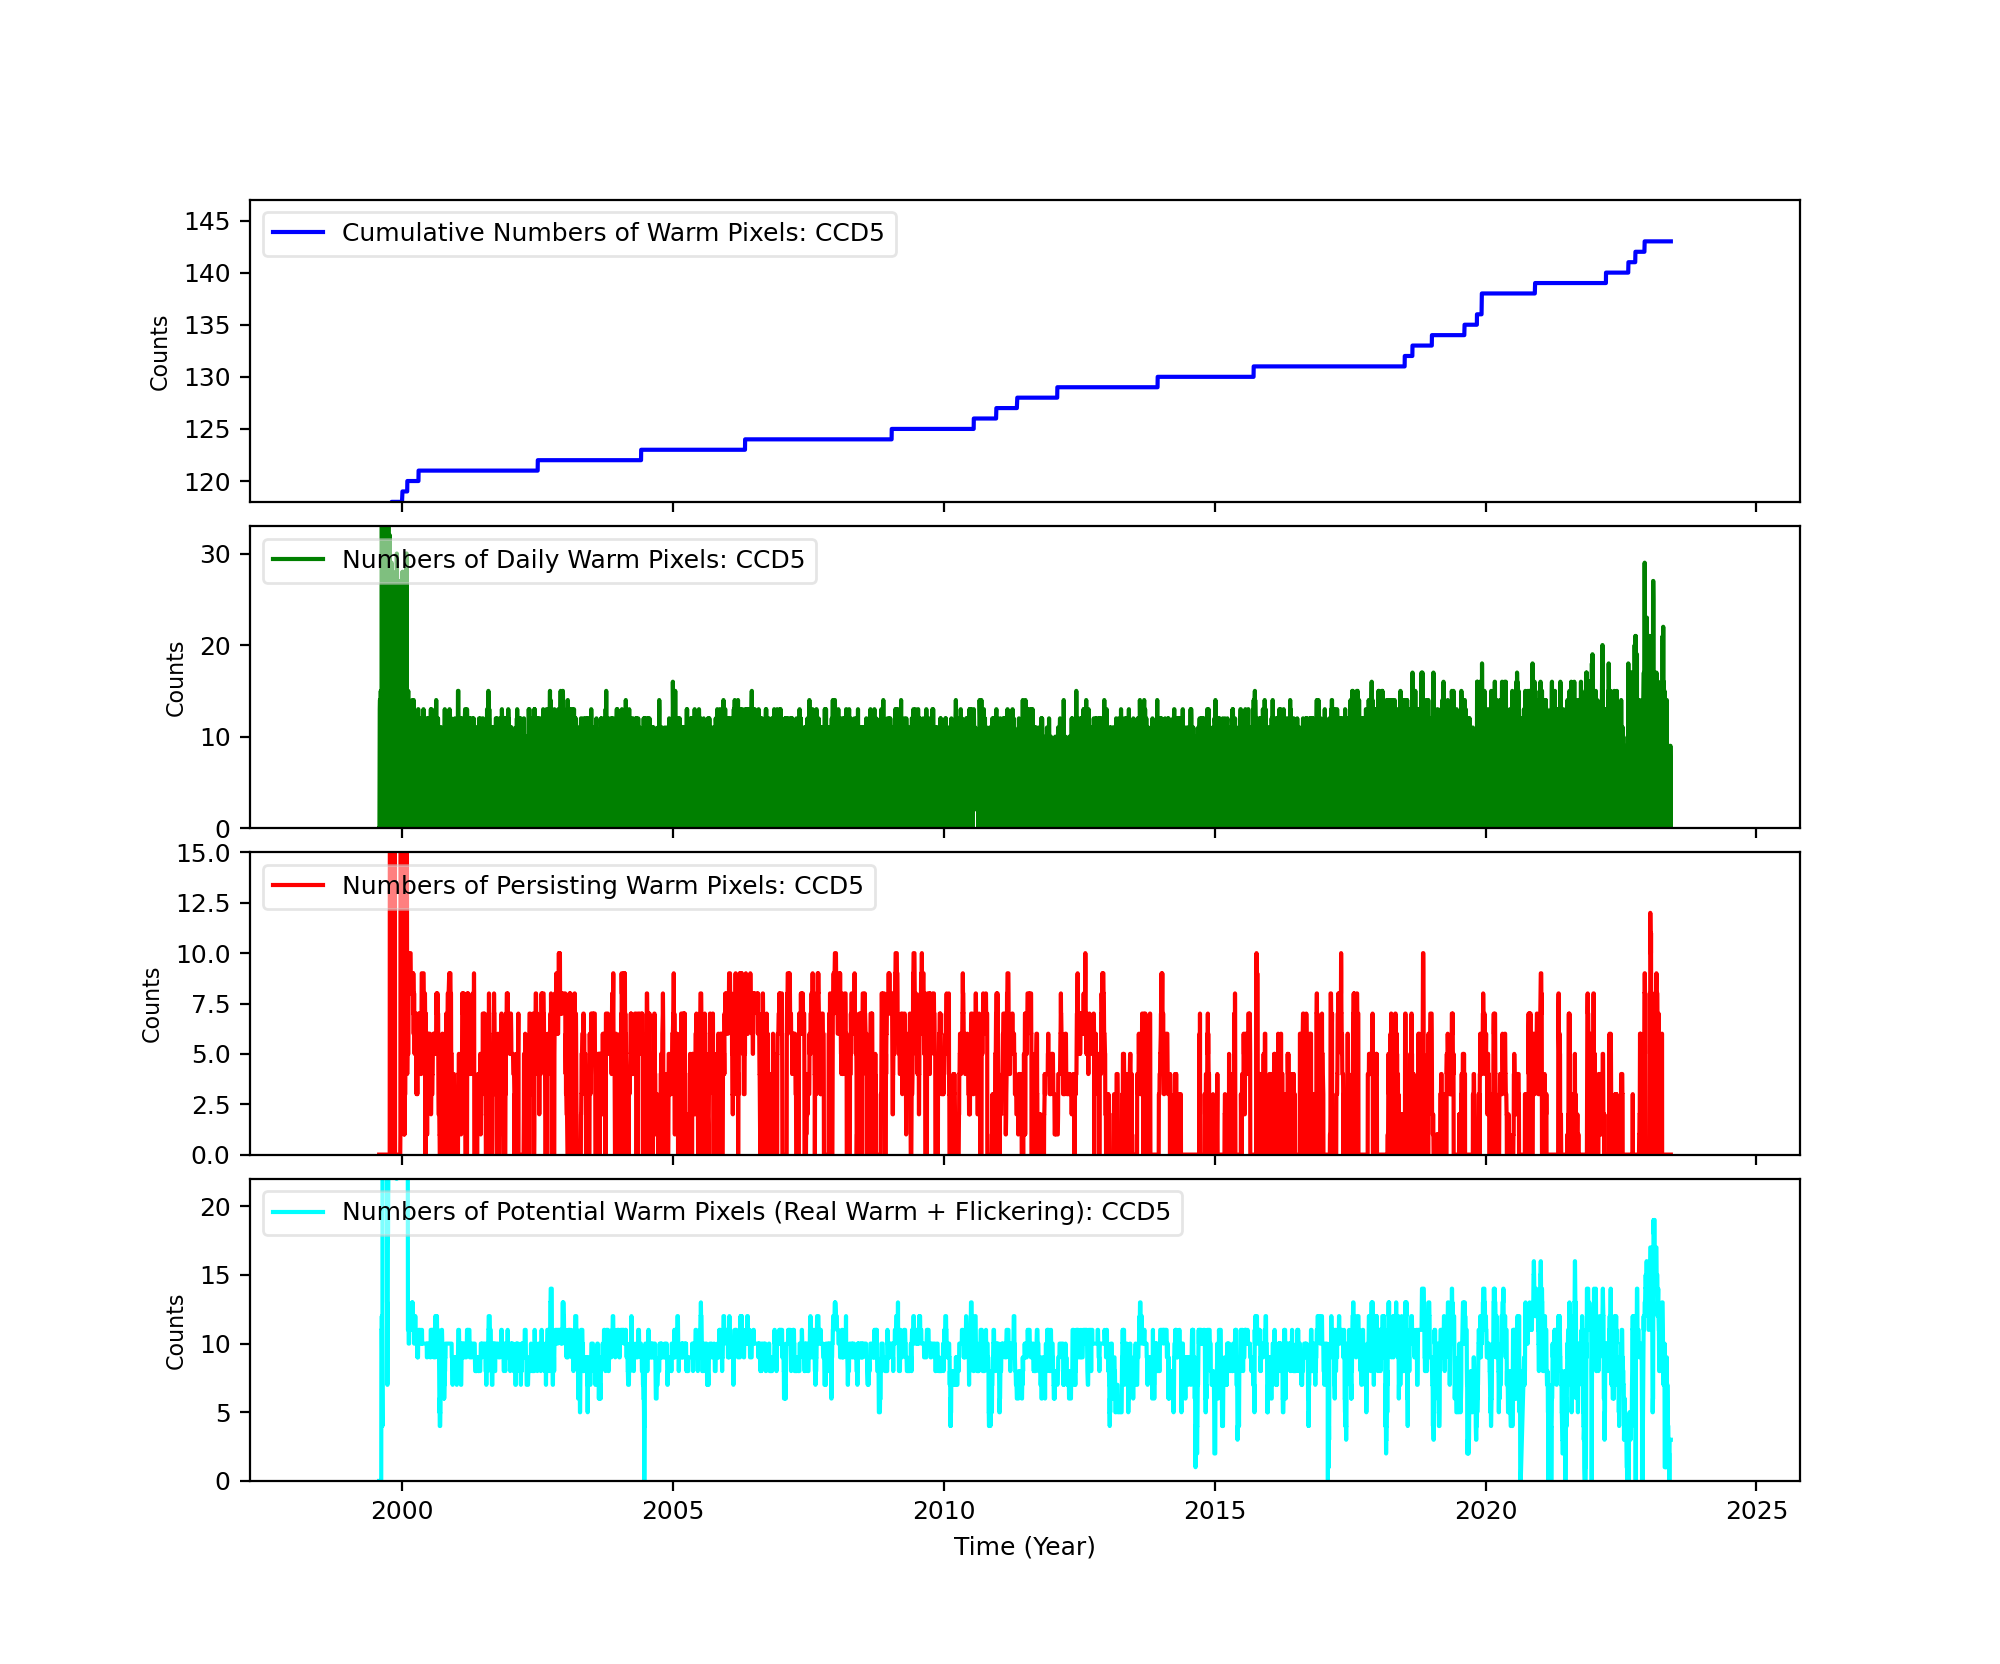
Bad Pixels
The plots below were generated with a new warm pixel finding script. Please see Acis Bad Pixel Page for details.
Front Side CCDs
Back Side CCD (CCD5)
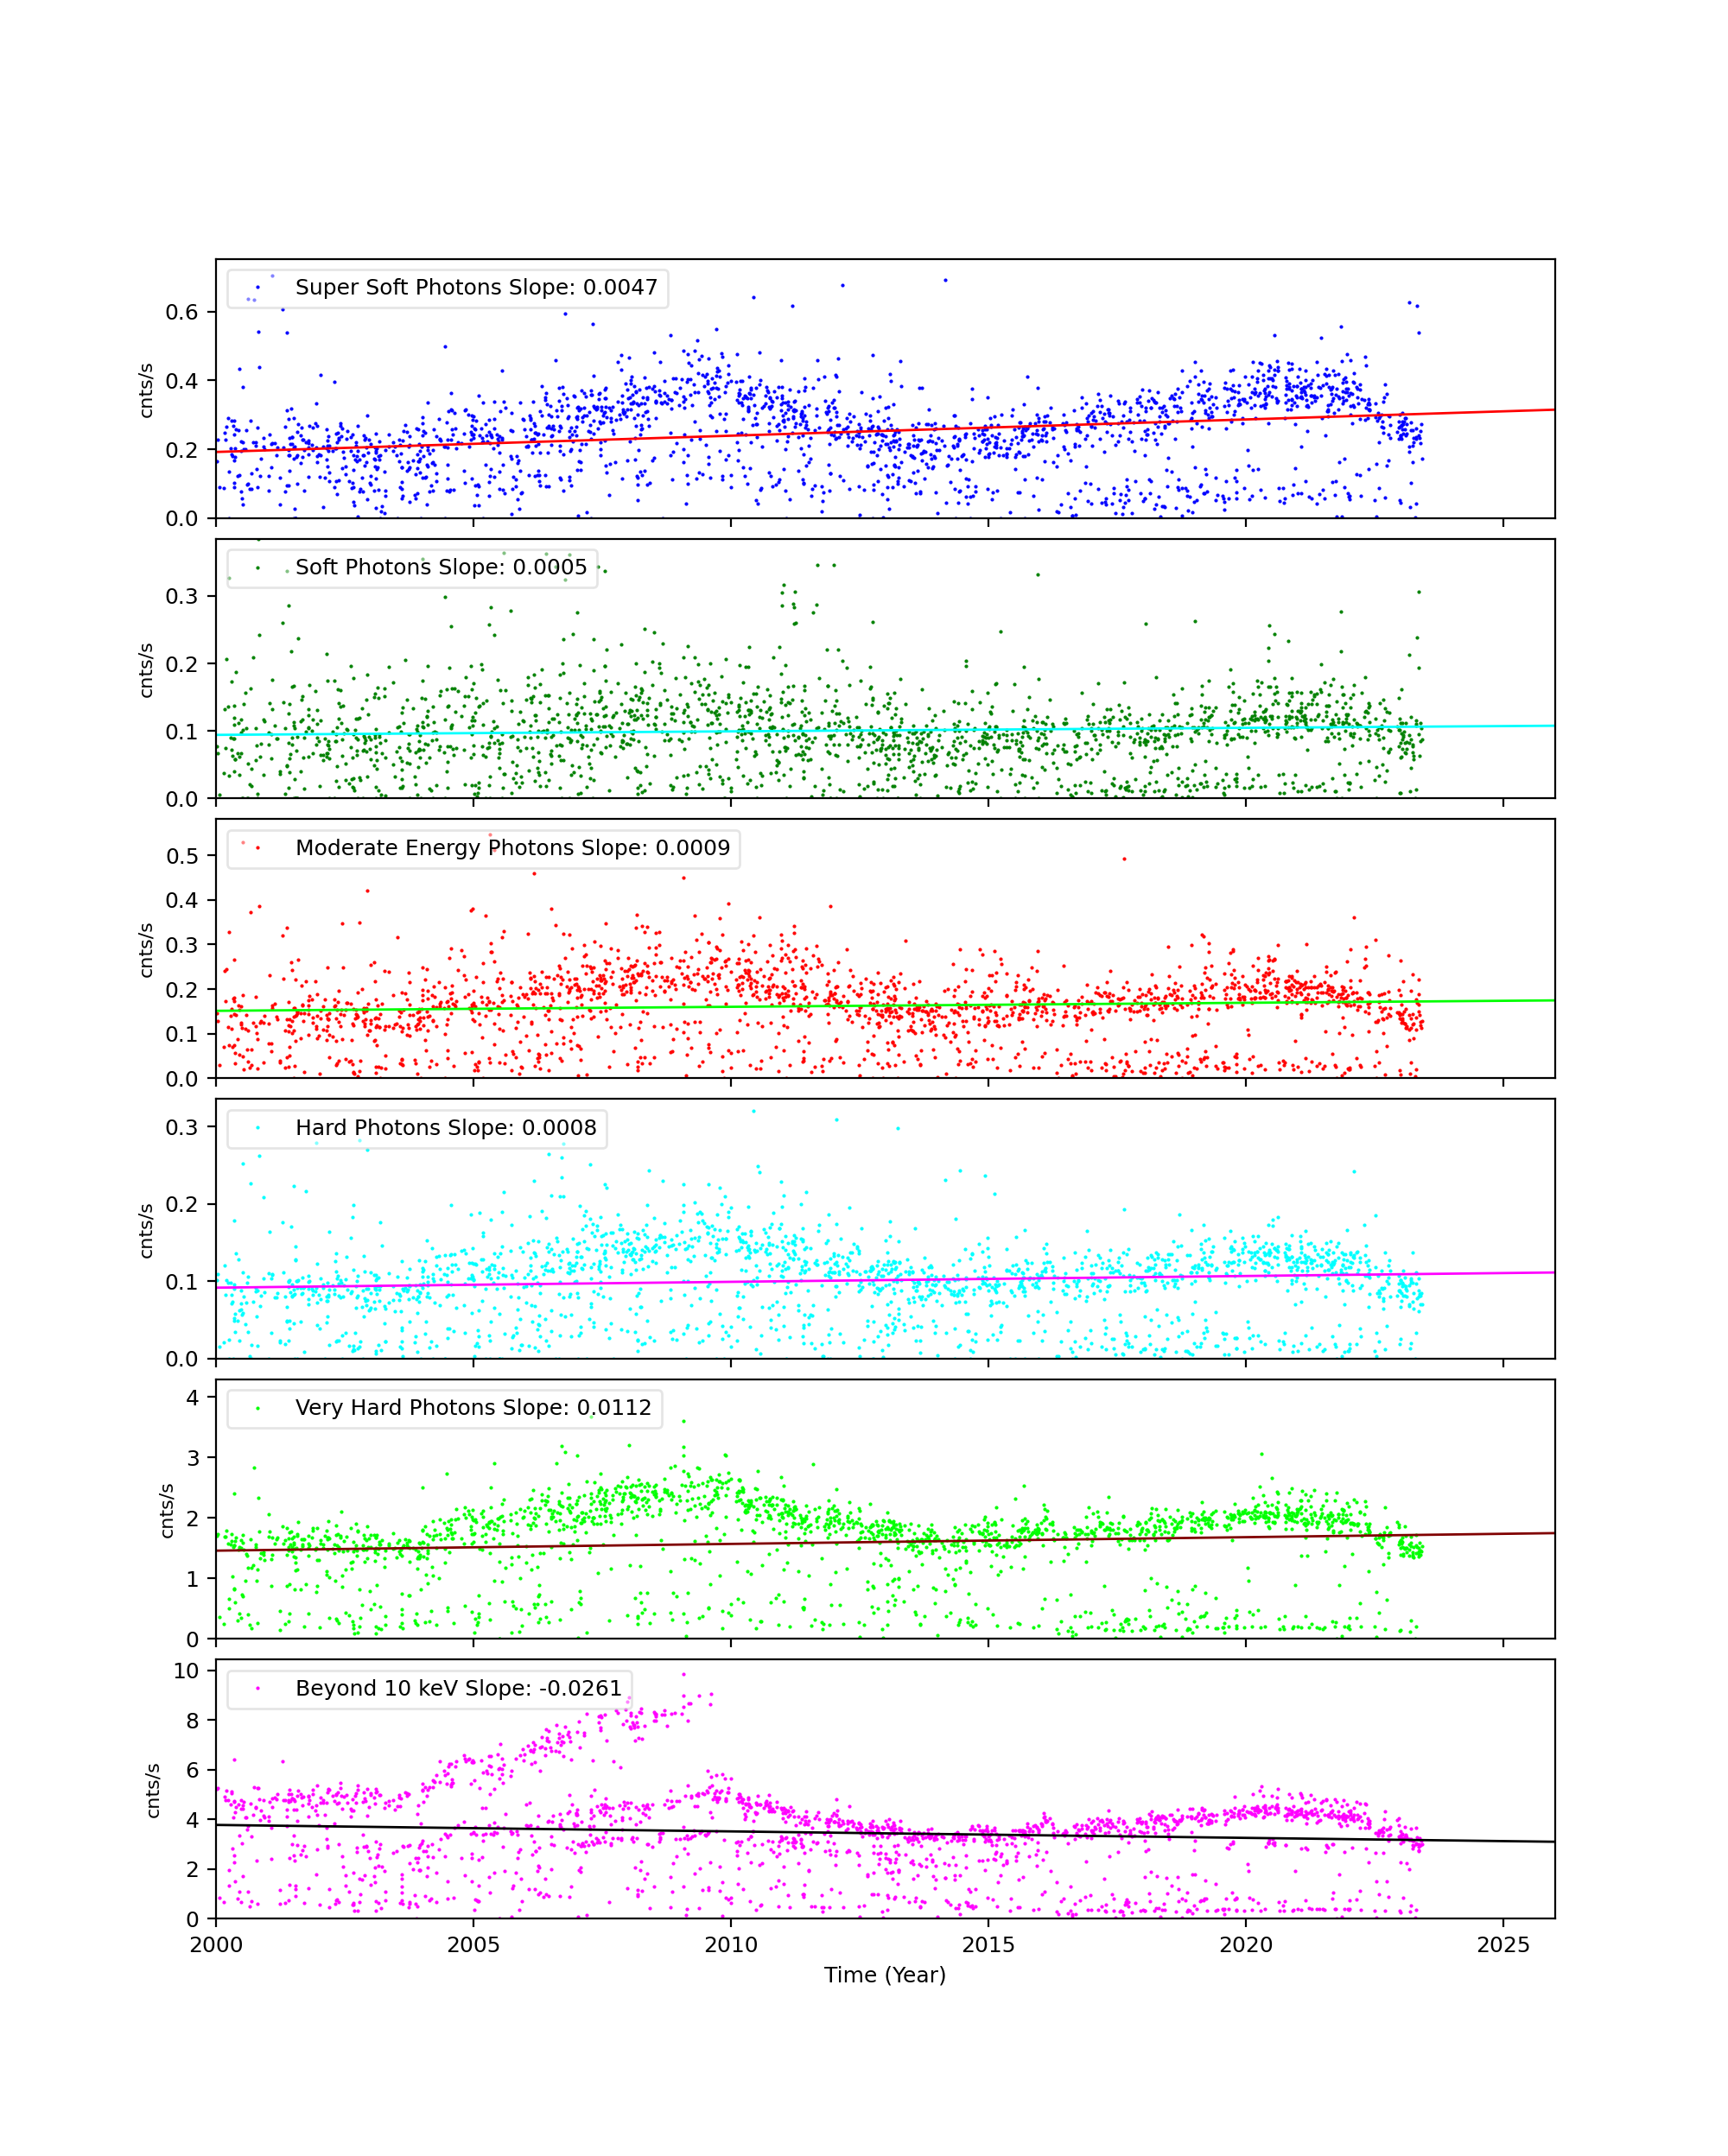
Science Instrument Background Rates
| Name | Low (keV) | High(KeV) | Description |
|---|---|---|---|
| SSoft | 0.00 | 0.50 | Super soft photons |
| Soft | 0.50 | 1.00 | Soft photons |
| Med | 1.00 | 3.00 | Moderate energy photons |
| Hard | 3.00 | 5.00 | Hard Photons |
| Harder | 5.00 | 10.00 | Very Hard photons |
| Hardest | 10.00 | Beyond 10 keV |
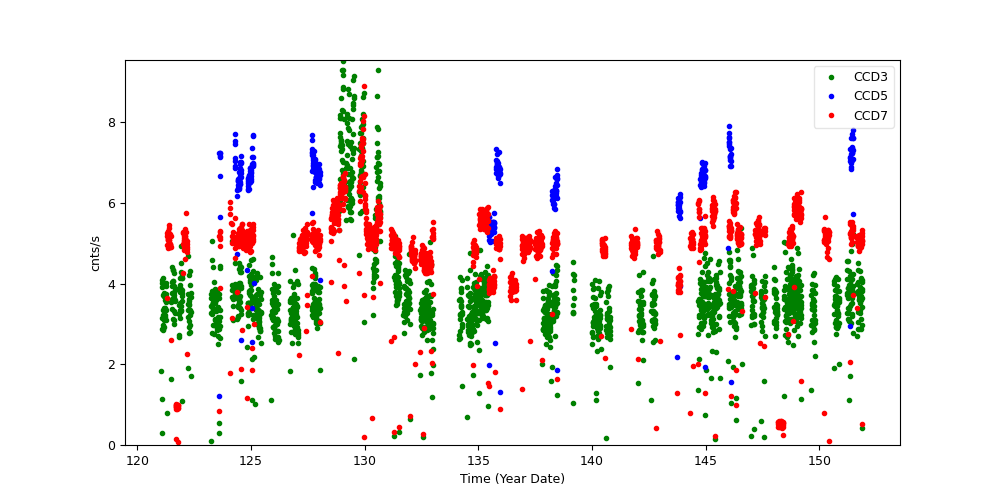
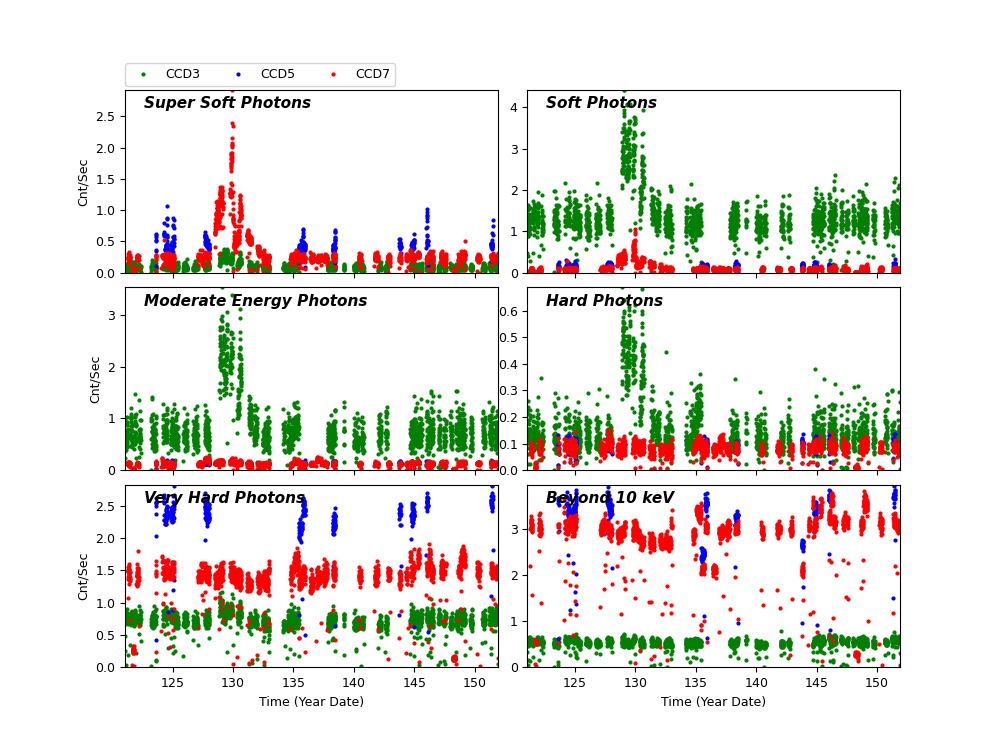
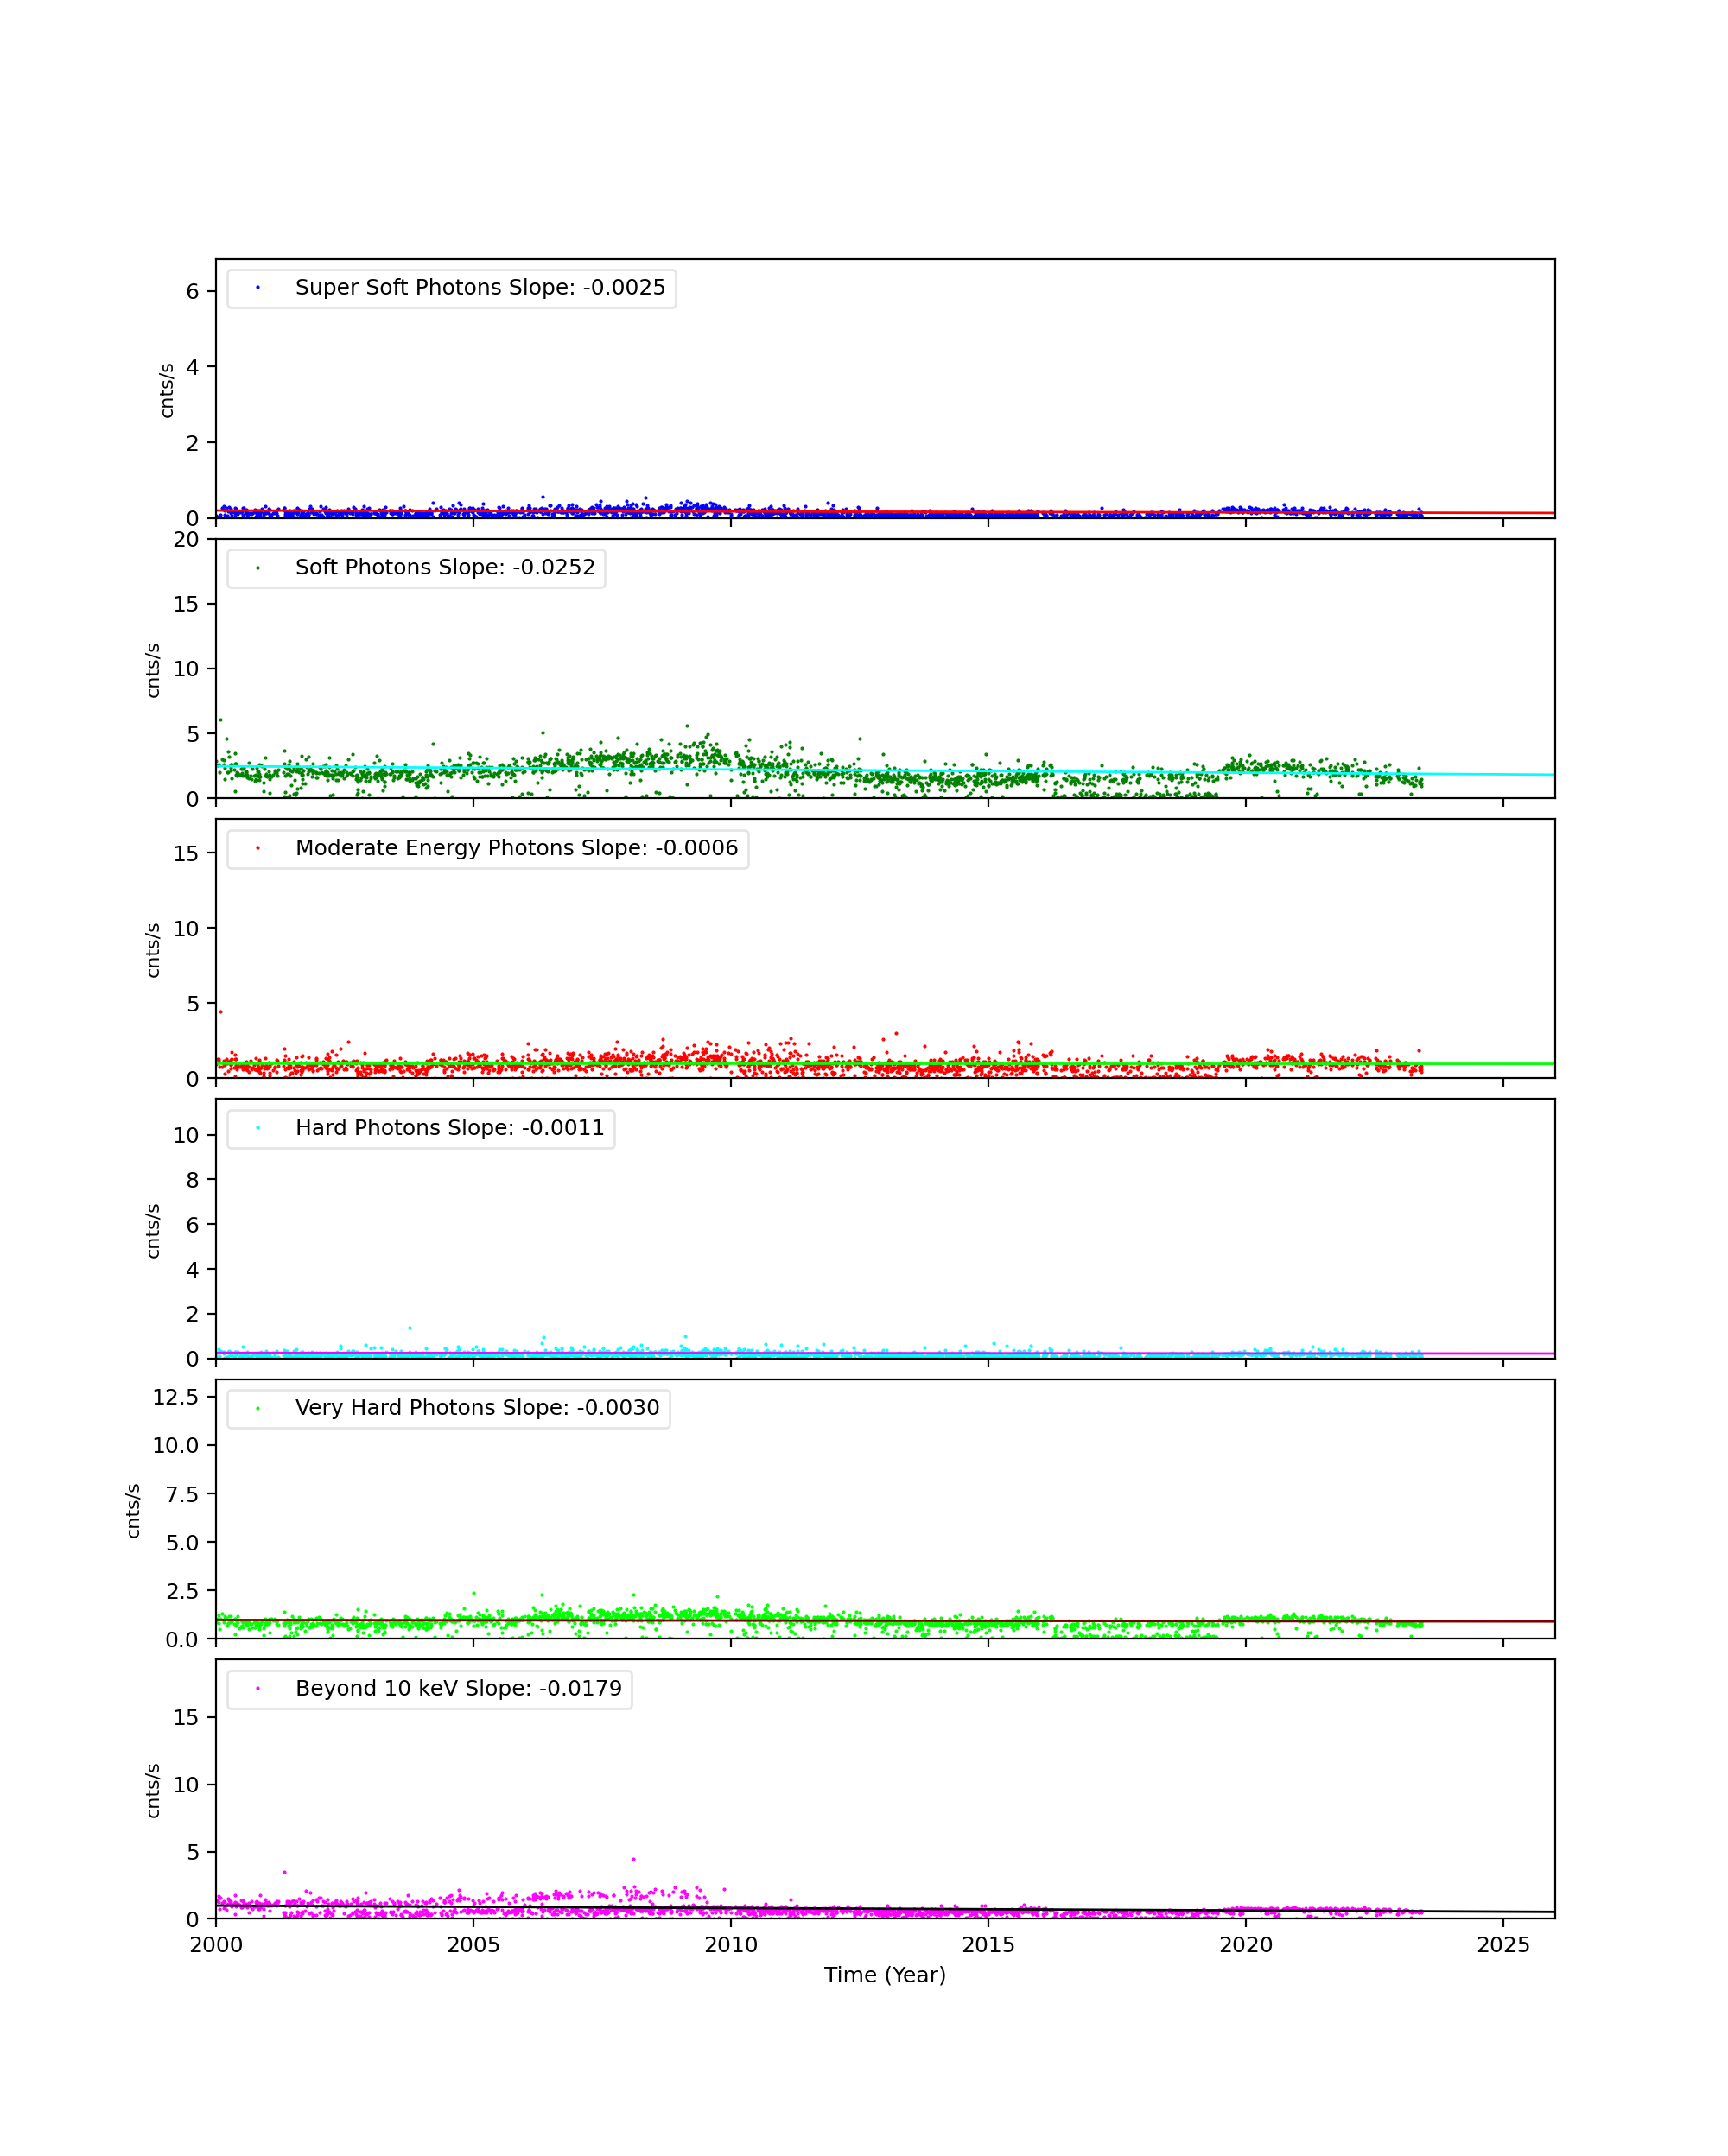
The following three plots show trends of SIB from year 2000. CCDs shown here are CCD3, CCD5, and CCD7. Fitted lines are linear fit after eliminating extreme outliers. For >10 keV plots, 2 lines are fit. One is with a 13 keV filter, and another without.
CCD 3
CCD 5
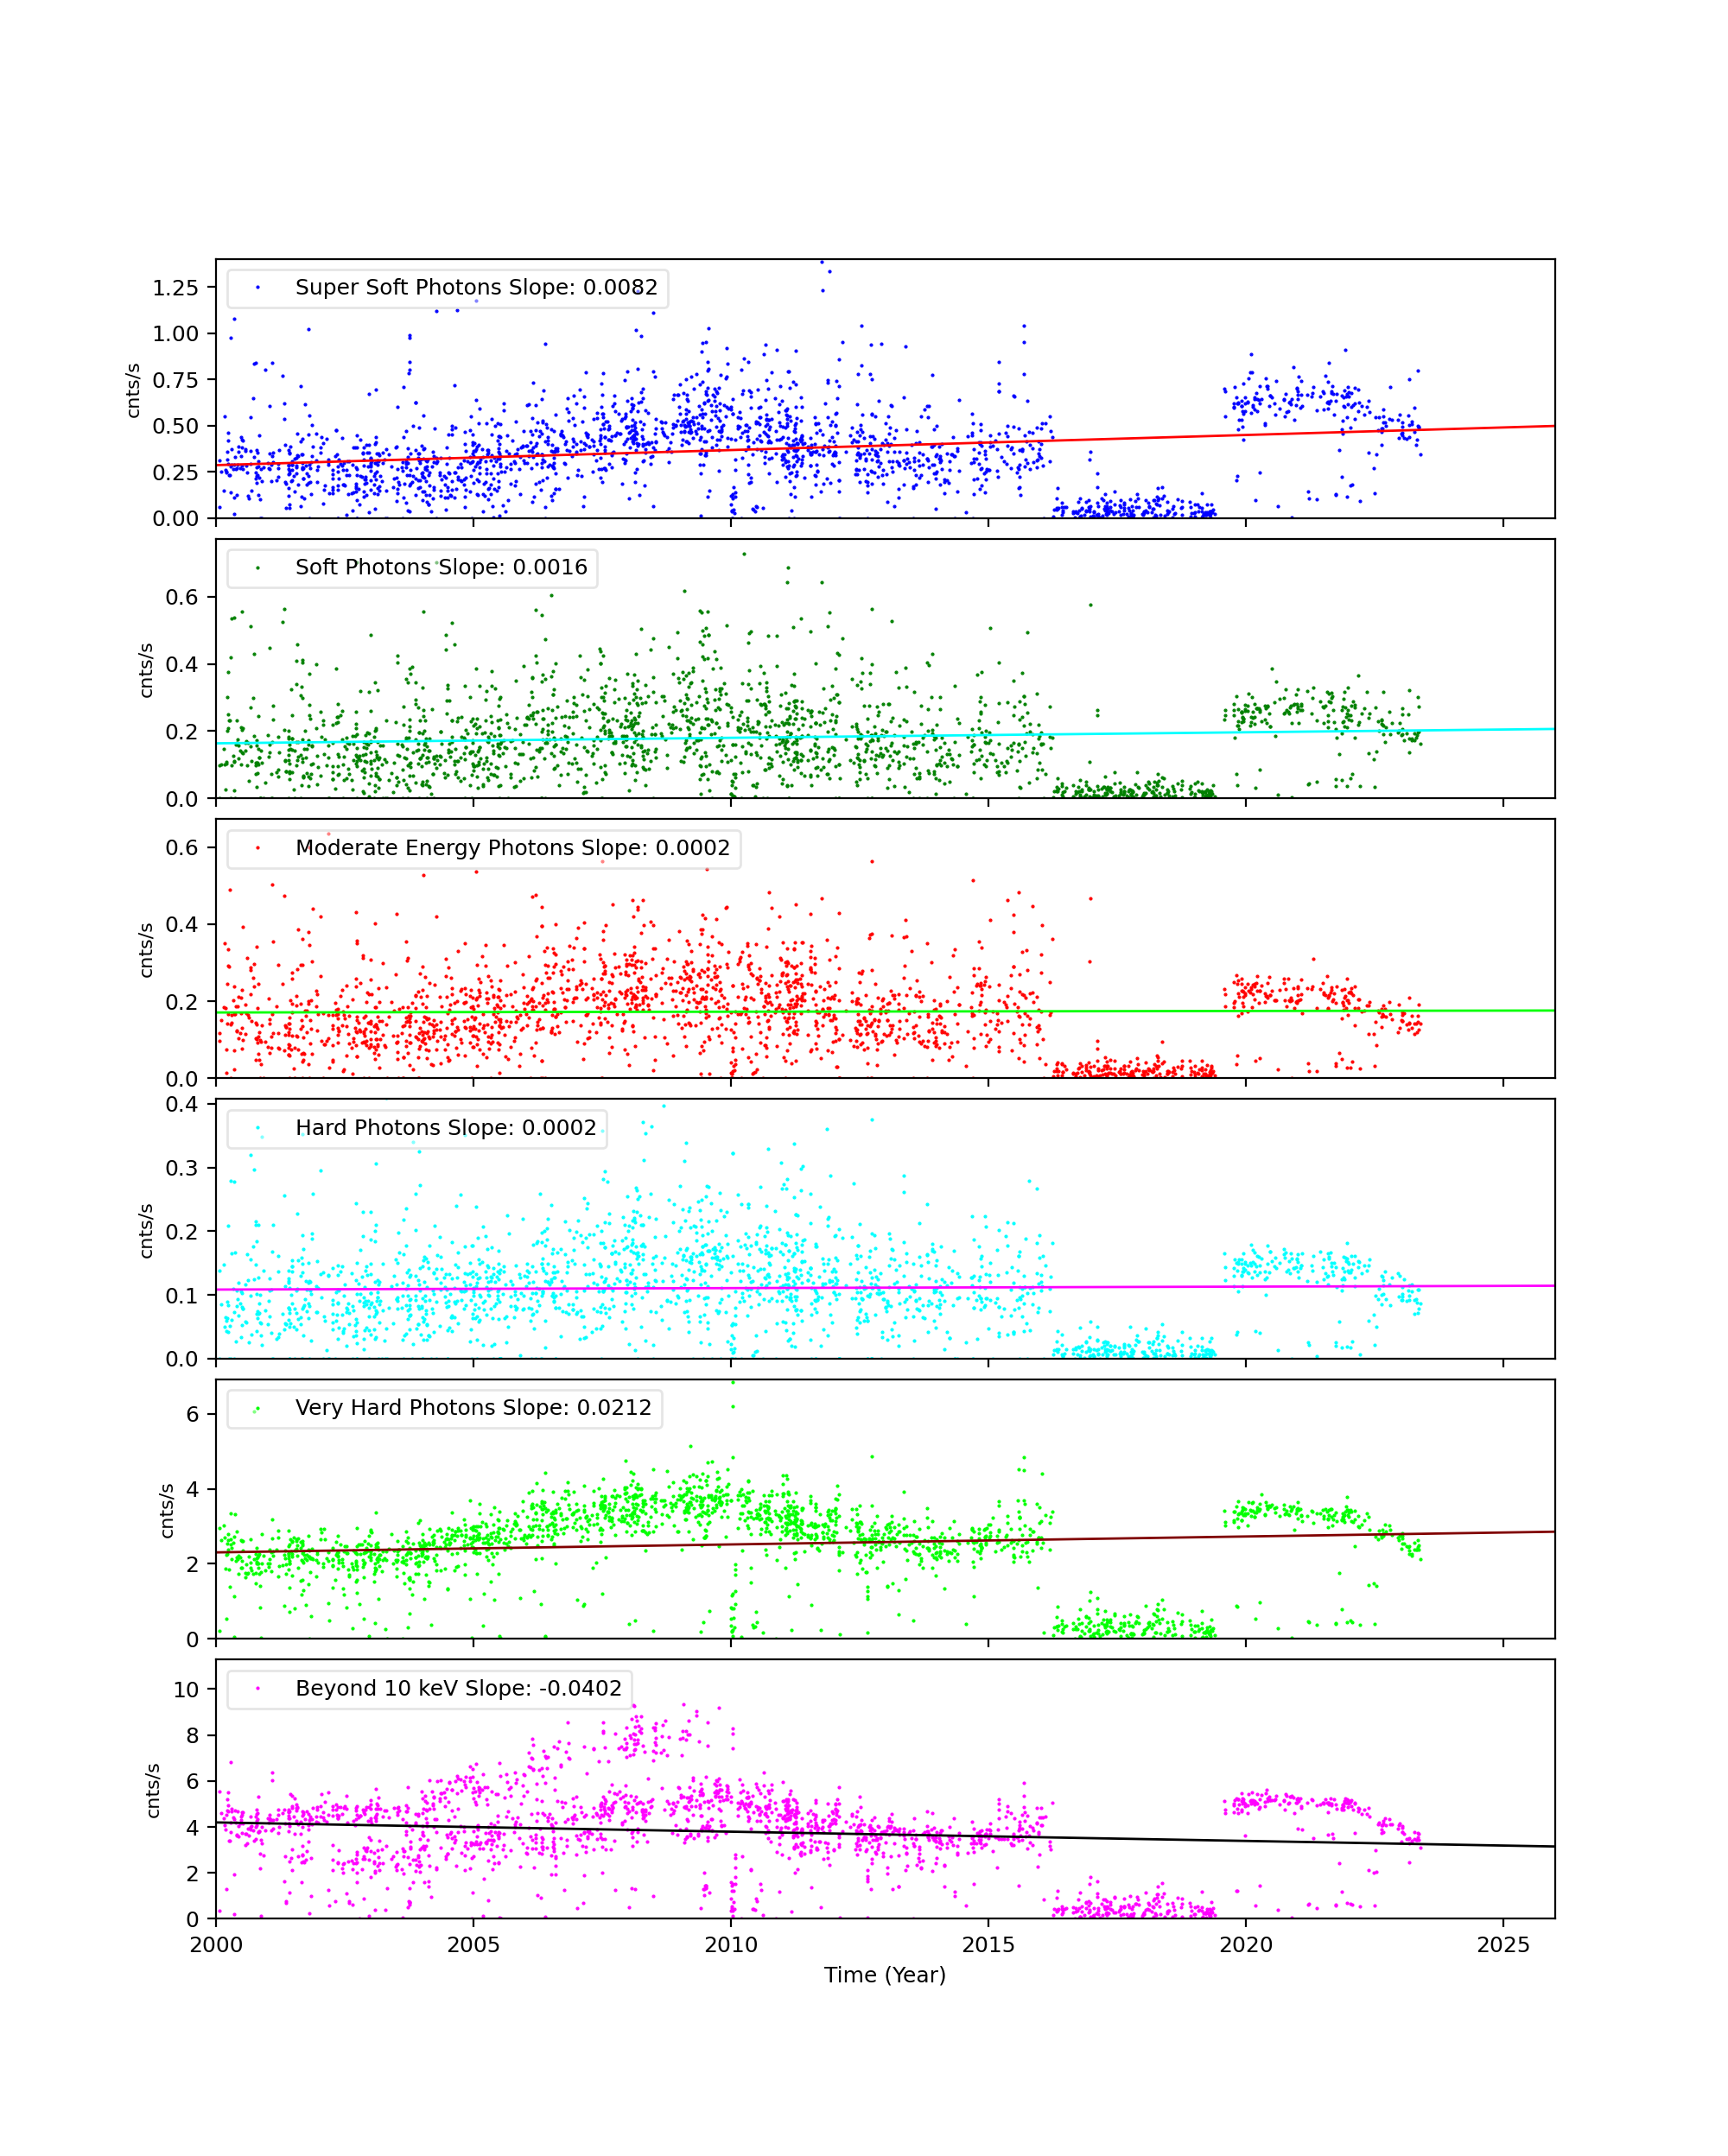
CCD 7
ACIS Histogram Mode Trends
We collected data from acis histogram mode data, and created trend plots of peak portions and peak widths against time (DOM). The peaks were estimated by fitting a simple Gaussian on three peaks (Al, Ti, and Mn), and the widths were estimated by a width at the half max from the peak.
All histogram data are taken under TIMED and GRADED_HIST mode, SIM position is at an external calibration source position, the focal temperature is around -119.7 C, and parameter settings in aciselec, acistemp are set to about same for all.
CCD 3, Peak Position
CCD 3, Peak Widths
CCD 3, Count Rates
HRC
DOSE of Central 4K Pore-Pairs
Please refer to Maximum Dose Trends for more details.
)
|
|---|
IMAGE                NPIX      MEAN    STDDEV      MIN       MAX
HRCI_05_2023.fits  16777216	0.063 	0.254 	0.000 	6.000
)
IMAGE                       NPIX      MEAN    STDDEV      MIN       MAX
HRCI_08_1999_05_2023.fits  16777216	na	na	na	na
)
|
|---|
IMAGE                NPIX      MEAN    STDDEV      MIN       MAX
HRCS_05_2023.fits  16777216	0.028 	0.169 	0.000 	4.000
)
IMAGE                       NPIX      MEAN    STDDEV      MIN       MAX
HRCS_08_1999_05_2023.fits  16777216	na	na	na	na
|
|
Max dose trend plots corrected for events that "pile-up"
in the center of the taps due to bad position information.
|
)
|
)
|
)
|
)
|
| Feb 2023 | Nov 2022 | Aug 2022 | May 2022 |
|---|
)
|
)
|
)
|
)
|
| Feb 2023 | Nov 2022 | Aug 2022 | May 2022 |
|---|
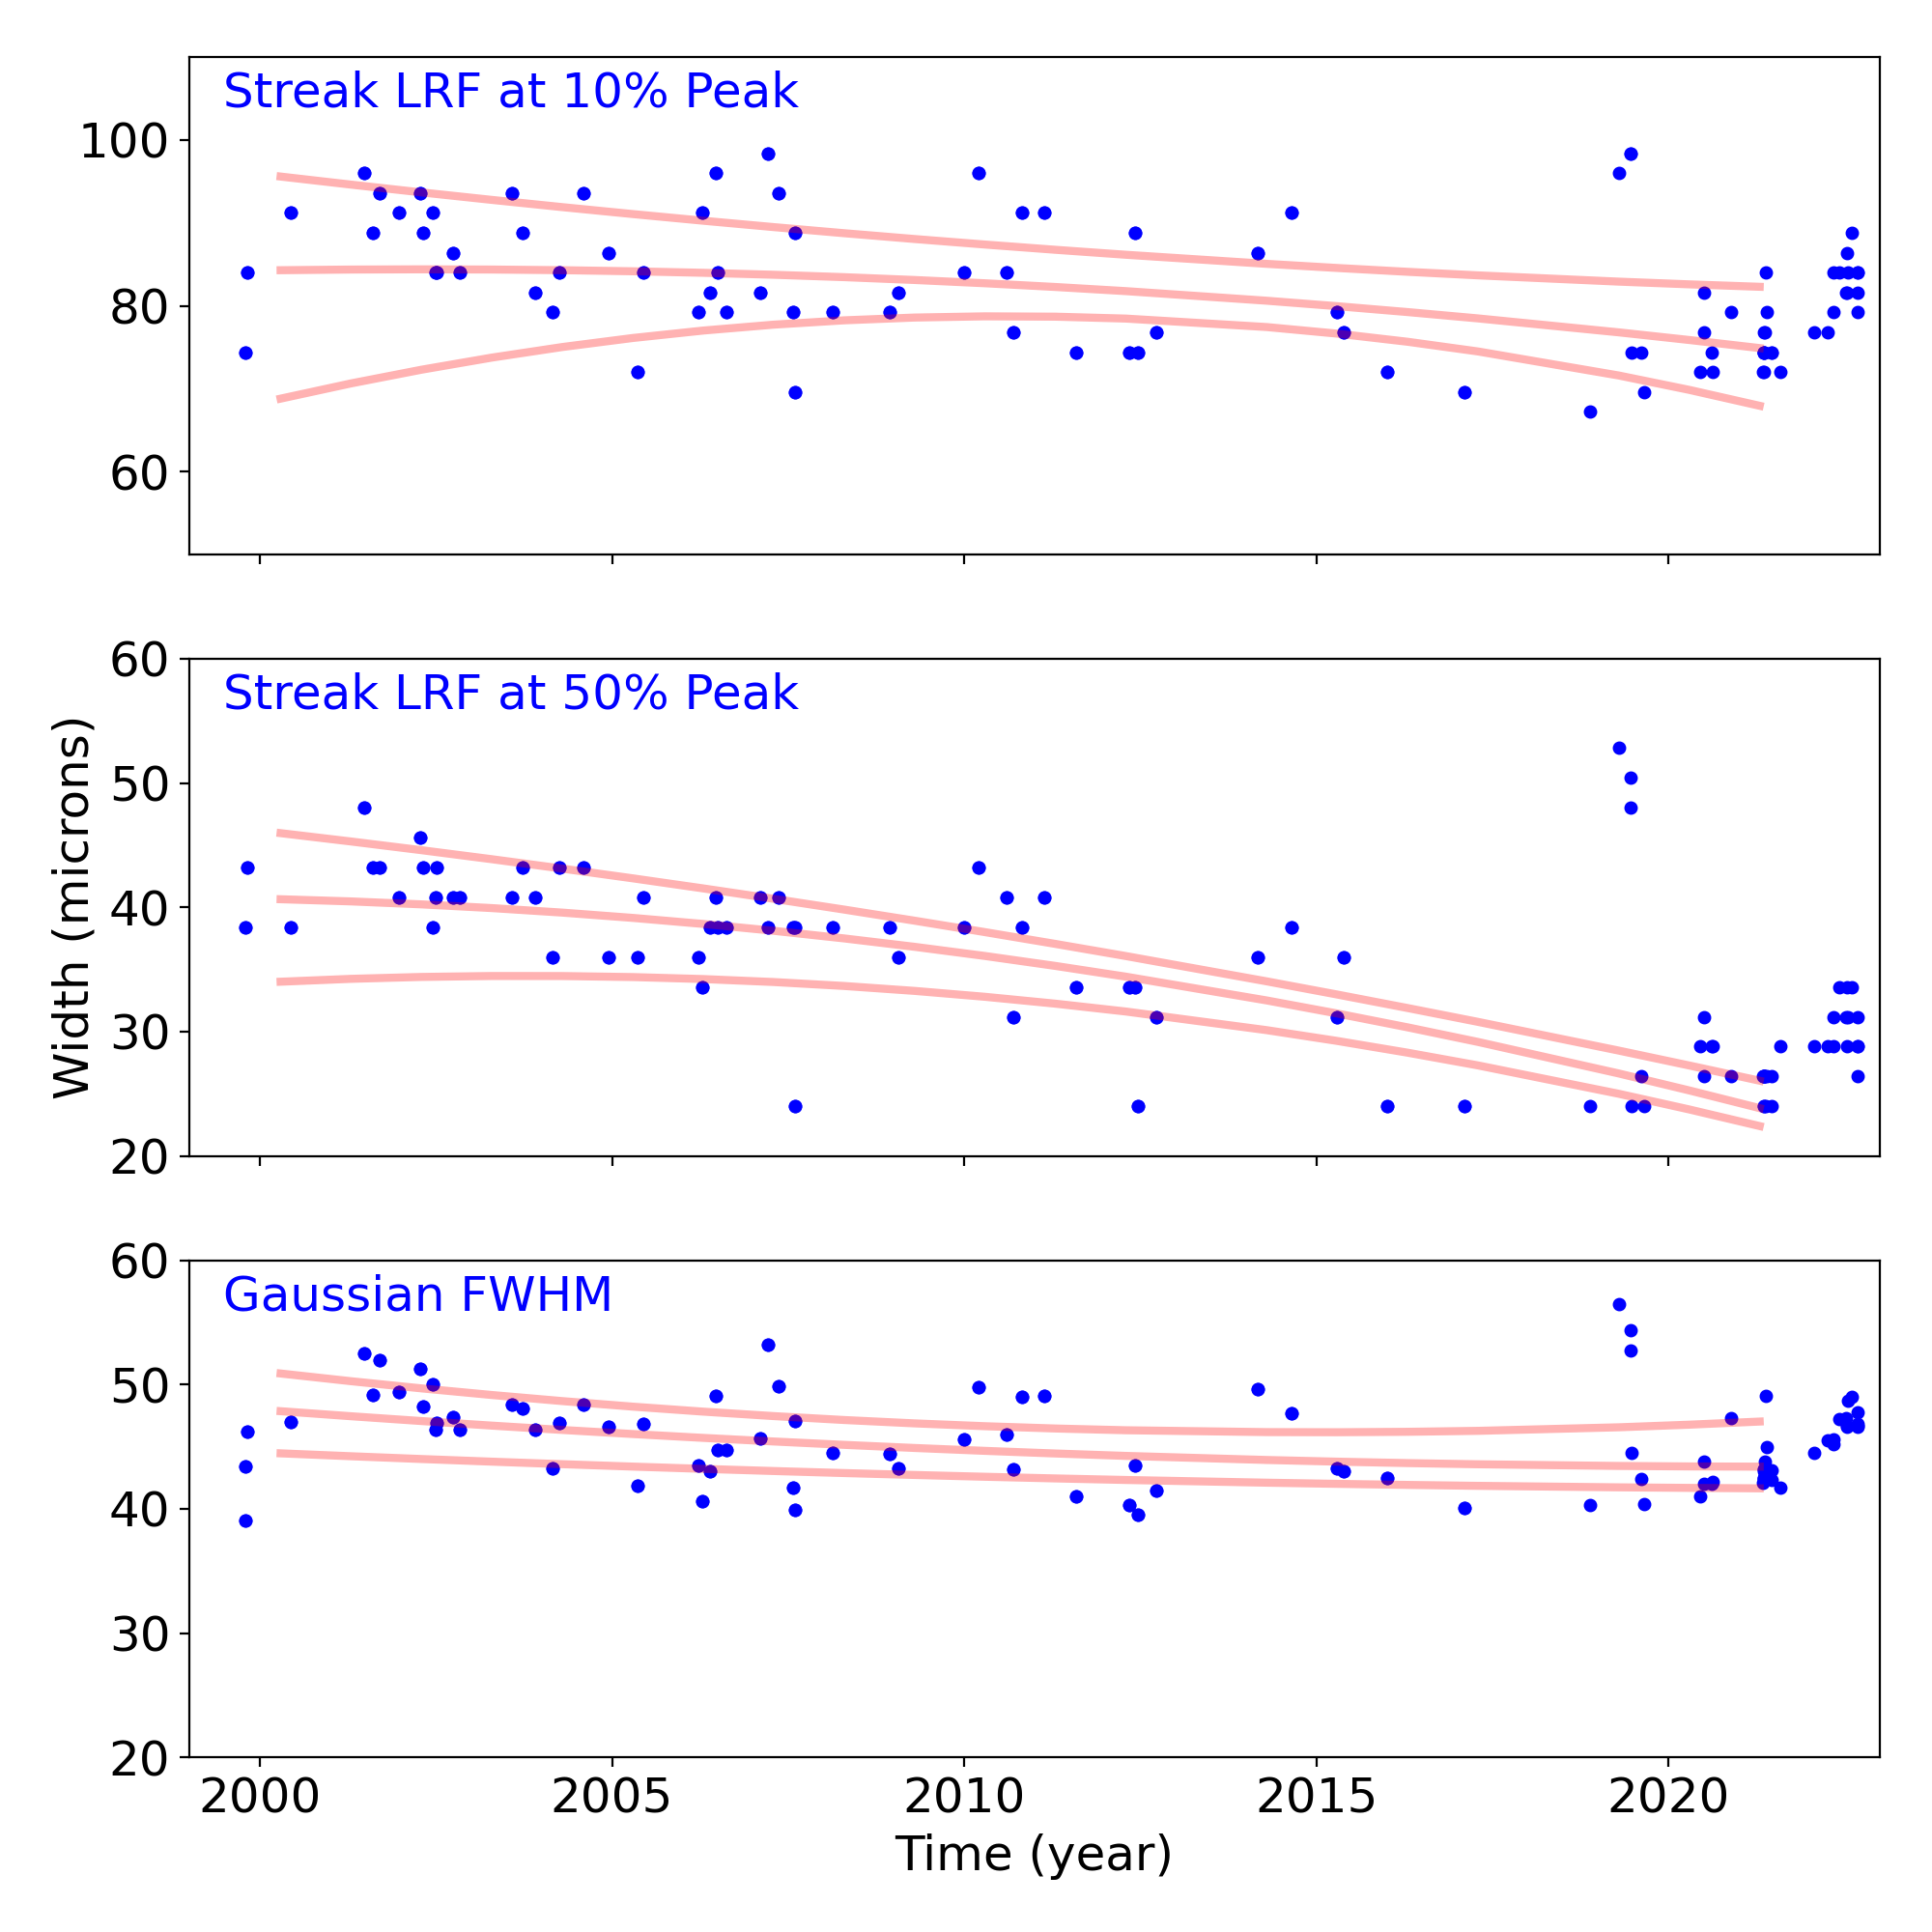
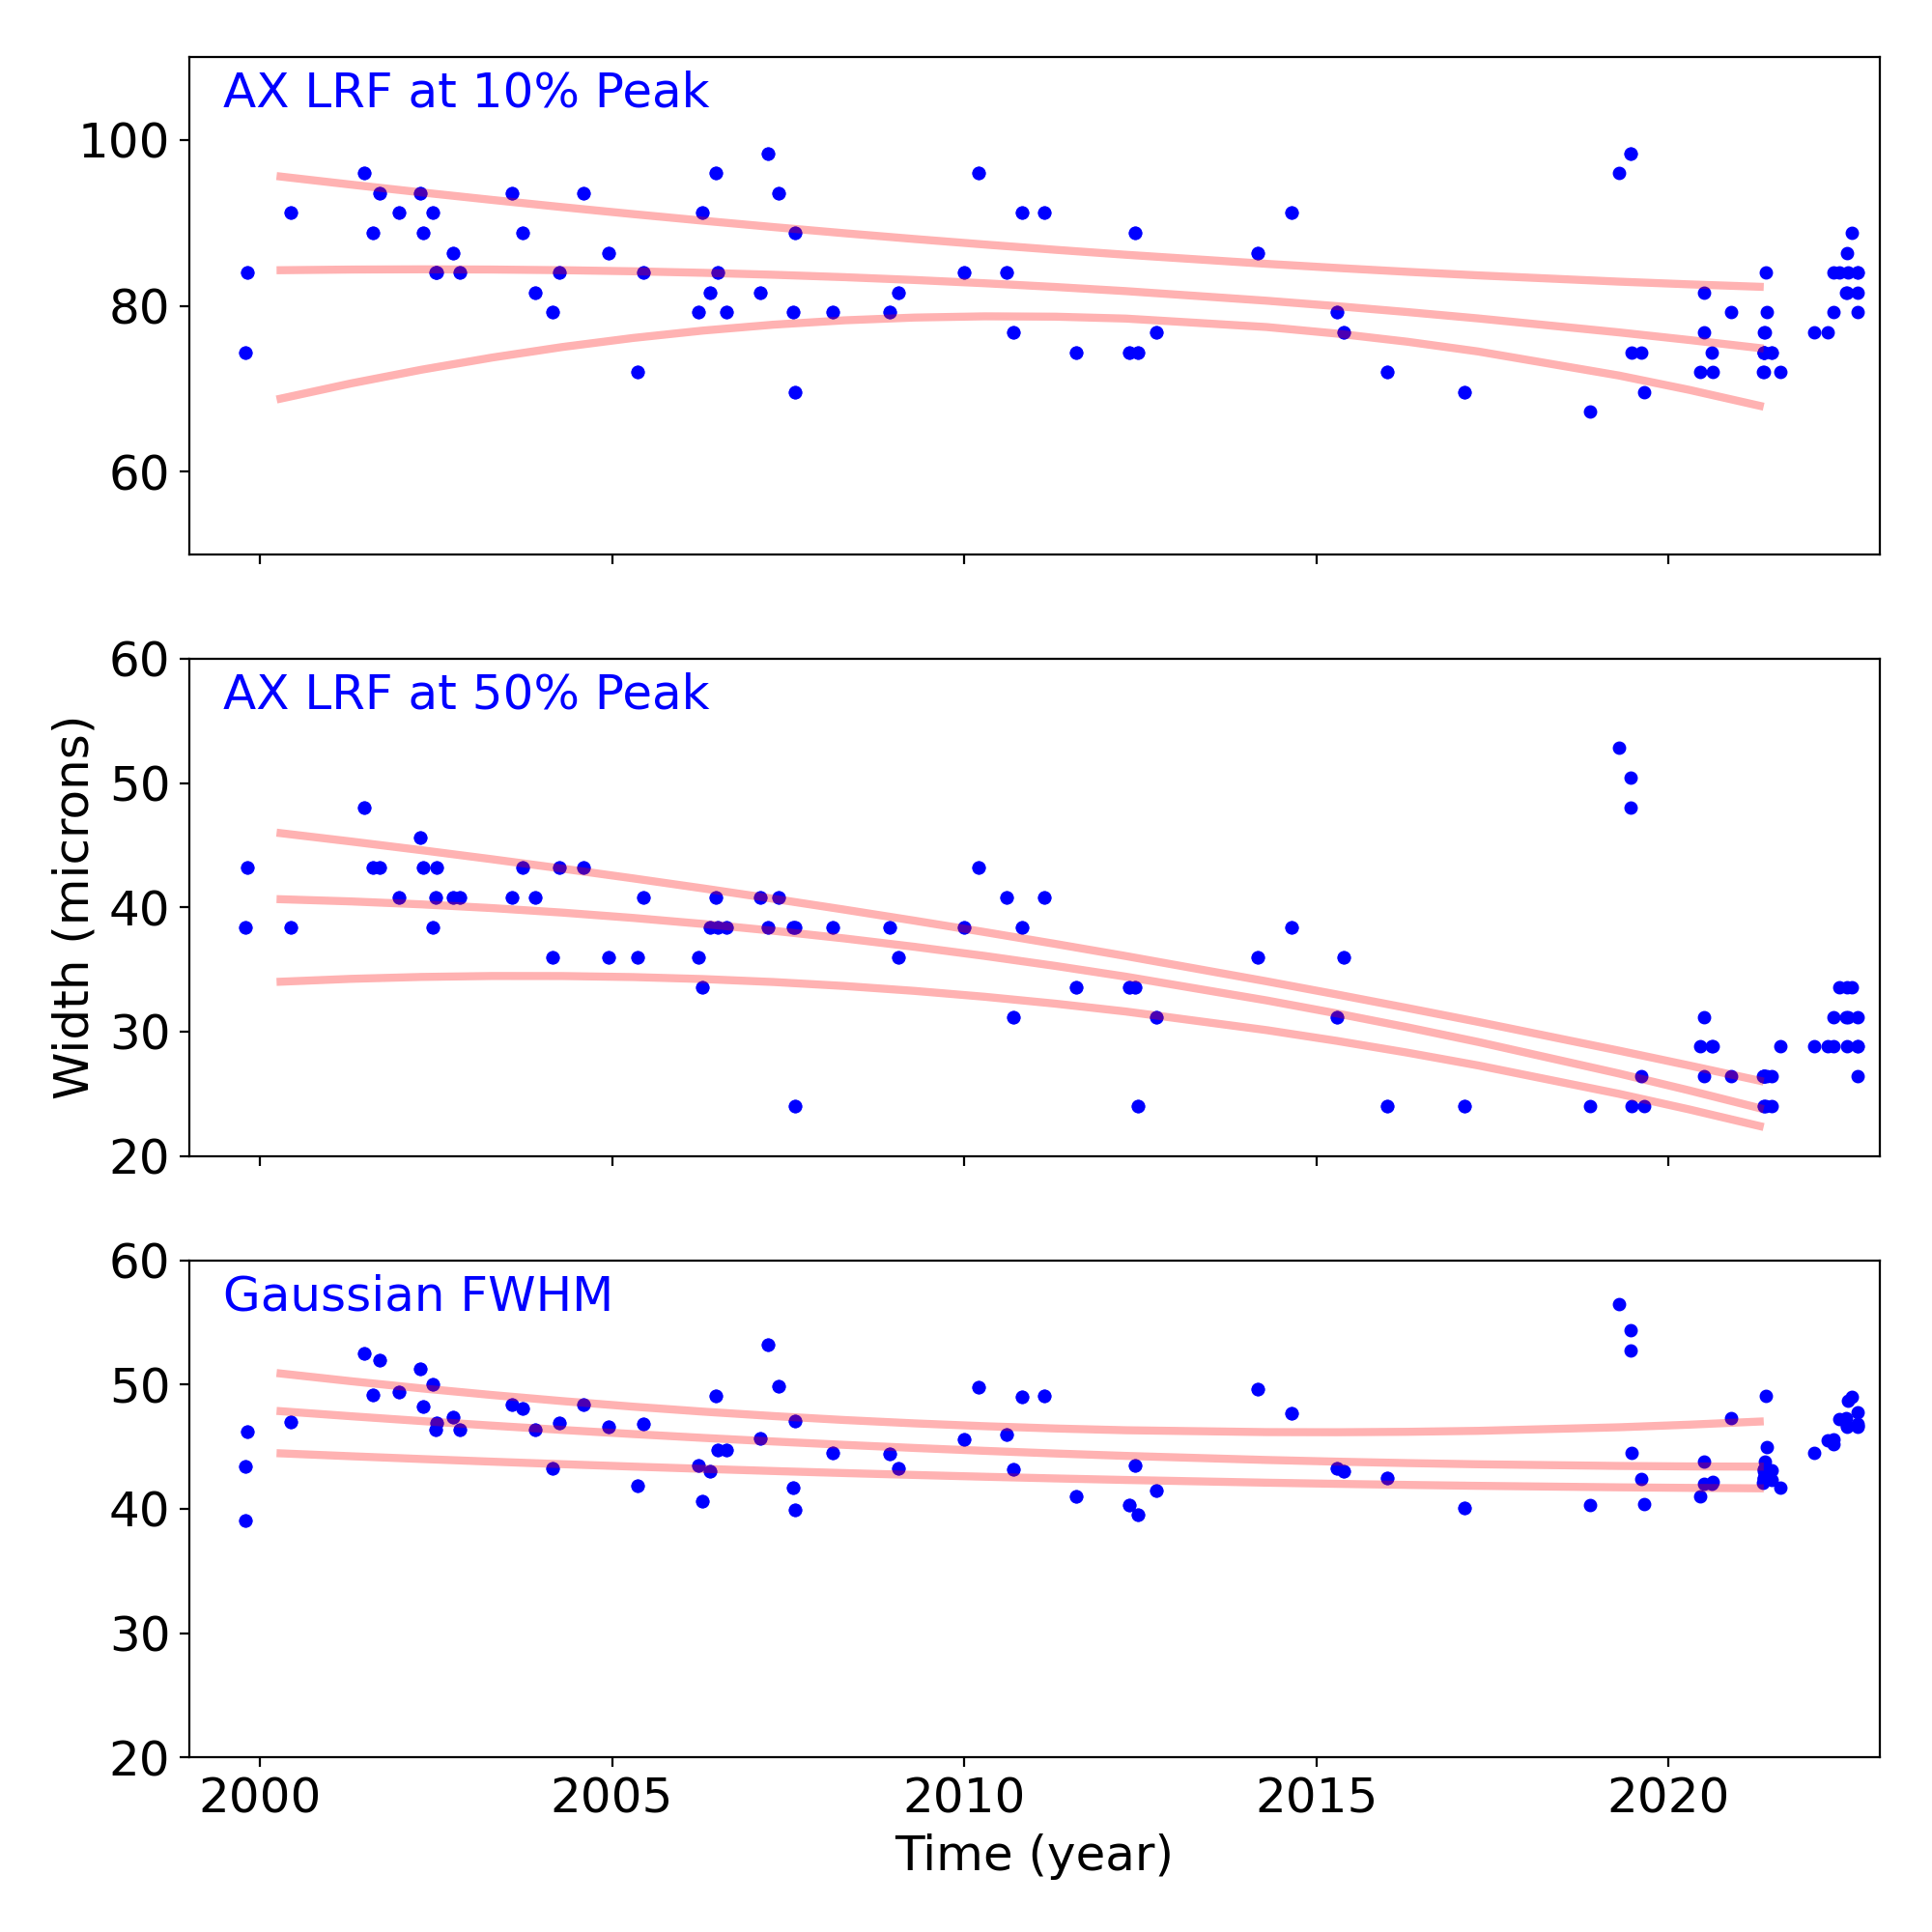
Gratings
Grating Trends/Focus
We plot the width of the zero order streak of ACIS/HETG observations and the width of the zero order image for HRC/LETG observations of point sources. No significant defocusing trend is seen at this time. See Gratings Trends pages.
PCAD
ACA Trending
| ACIS |
)
|
)
|
)
|
|
|---|---|---|---|---|
)
|
)
|
)
| ||
| HRCI |
)
|
)
|
)
|
)
|
| HRCI |
)
|
)
|
)
|
)
|
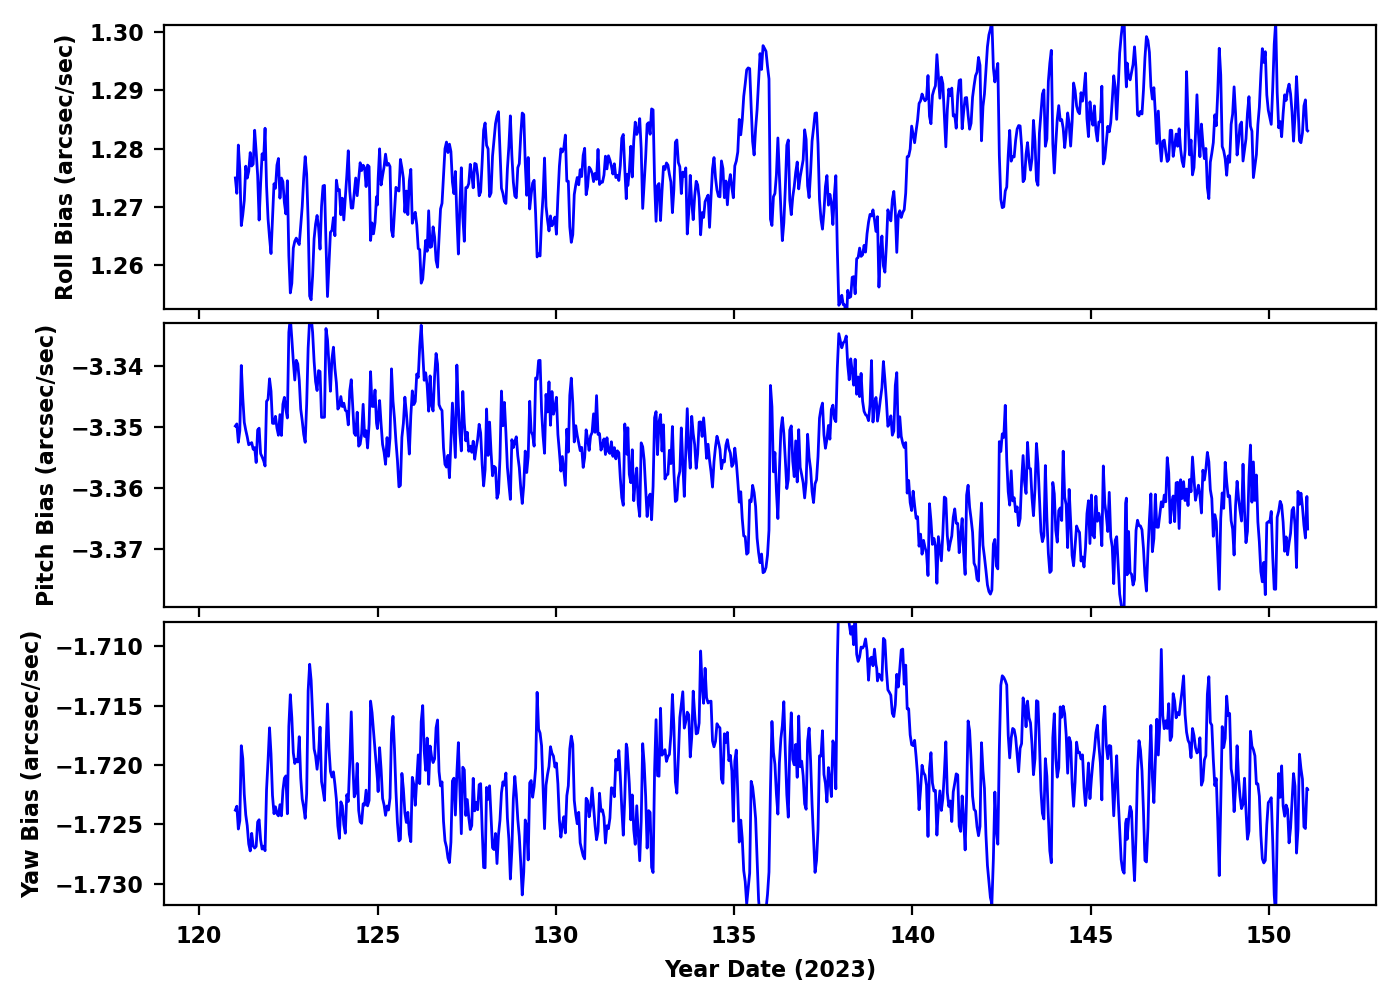
Gyro Bias Drift
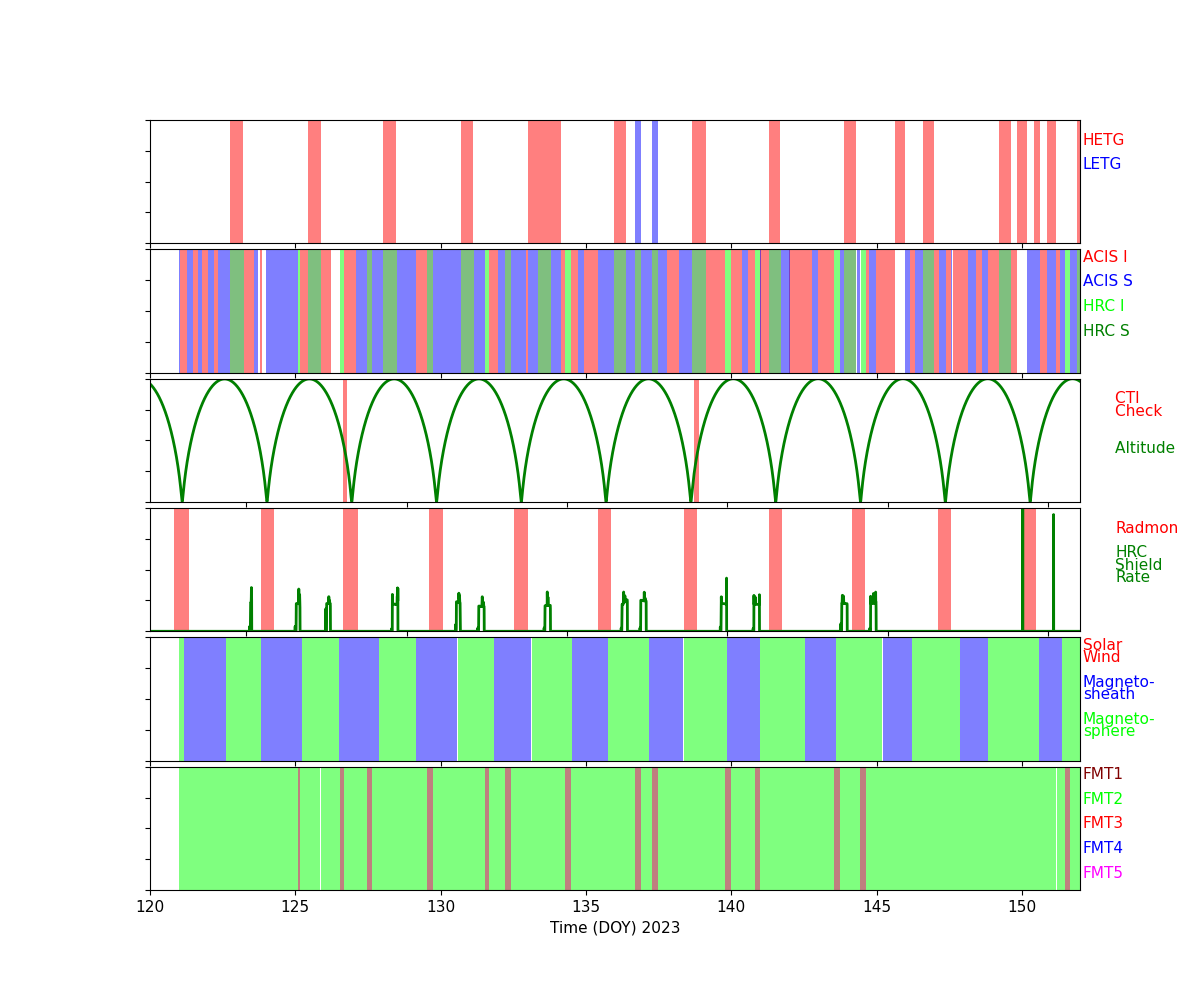
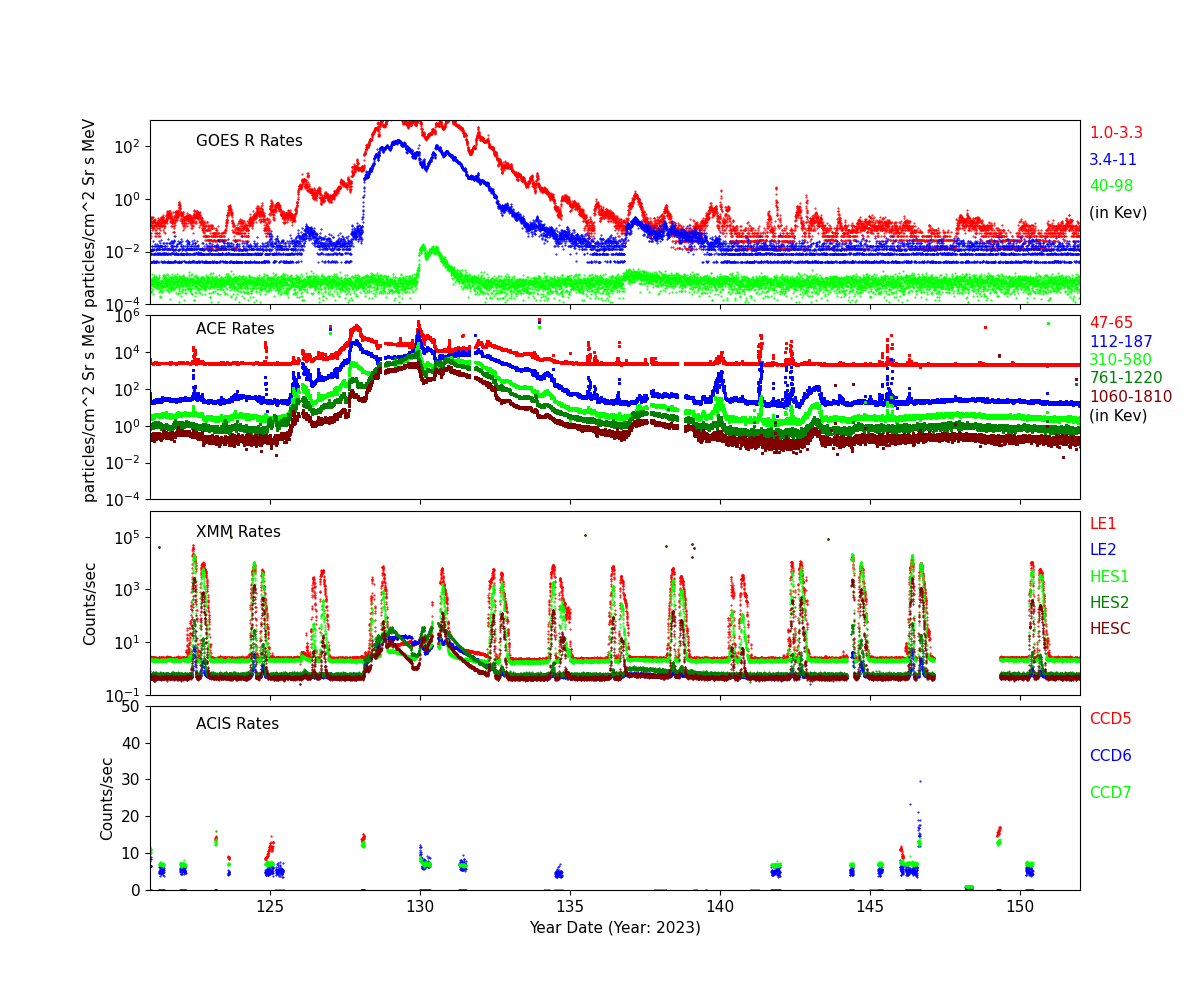
Radiation History
Radiation Count Rates of May 2023
Sun Spot History (See:NOAA Page)

Trending
Quarterly Trends
- HRMA Heater
| Previous Quarter | |||||||
| MSID | MEAN | RMS | DELTA/YR | DELTA/YR/YR | UNITS | DESCRIPTION | |
| ohrthr03 | -4.542e-04 | 1.028e-04 | (2.95+/-0.00)e2 | 0.03 +/- 0.01 | K | RT 5: HRMA FORWARD APERTURE PLATE | |
|---|---|---|---|---|---|---|---|
| ohrthr09 | -0.001 | 2.489e-04 | (2.96+/-0.01)e2 | -0.09 +/- 0.06 | K | RT 105: HRMA CAP | |
| ohrthr17 | -0.001 | 3.075e-04 | (2.96+/-0.01)e2 | -0.11 +/- 0.07 | K | RT 125: HSA OUTER CYNLINDER | |
| ohrthr24 | -0.002 | 3.917e-04 | (2.97+/-0.01)e2 | -0.07 +/- 0.16 | K | RT 12: HRMA AFT HEATER PLATE | |
| ohrthr38 | -0.004 | 0.001 | (3.02+/-0.03)e2 | 0.01 +/- 0.54 | K | RT 120: HRMA AFT COLLIMATOR OUTER CYLINDER | |
| ohrthr52 | -0.002 | 2.555e-04 | (2.96+/-0.01)e2 | -0.10 +/- 0.07 | K | RT 100: HRMA CAP | |
- HRMA Thermal
| Previous Quarter | |||||||
| MSID | MEAN | RMS | DELTA/YR | DELTA/YR/YR | UNITS | DESCRIPTION | |
| 4rt568t | -0.005 | 0.001 | (3.01+/-0.03)e2 | 0.39 +/- 0.59 | K | RT 568 - HRMA TEMP | |
|---|---|---|---|---|---|---|---|
| 4rt569t | -0.002 | 4.001e-04 | (2.97+/-0.01)e2 | -0.11 +/- 0.13 | K | RT 569 - HRMA TEMP | |
| 4rt570t | -0.002 | 2.343e-04 | (2.96+/-0.01)e2 | -0.12 +/- 0.06 | K | RT 570 - HRMA TEMP | |
| 4rt575t | -0.005 | 0.001 | (3.06+/-0.03)e2 | 0.01 +/- 0.73 | K | RT 575 - OB CONE TEMP | |
| 4rt576t | -0.006 | 0.001 | (2.96+/-0.03)e2 | -0.20 +/- 0.58 | K | RT 576 - OB CONE TEMP | |
| 4rt578t | -0.006 | 0.002 | (3.04+/-0.04)e2 | 0.31 +/- 0.91 | K | RT 578 - OB CONE TEMP | |
- MUPS
| Previous Quarter | |||||||
| MSID | MEAN | RMS | DELTA/YR | DELTA/YR/YR | UNITS | DESCRIPTION | |
| pm1thv1t | -0.033 | 0.007 | (3.53+/-0.16)e2 | -0.76 +/- 3.27 | K | MUPS 1 THRUSTER VALVE 01 TEMP | |
|---|---|---|---|---|---|---|---|
| pline02t | -0.026 | 0.005 | (3.37+/-0.13)e2 | 0.81 +/- 2.95 | K | PROP LINE TEMP 02 | |
| pline03t | -0.032 | 0.006 | (3.29+/-0.14)e2 | 0.90 +/- 2.49 | K | PROP LINE TEMP 03 | |
| pline04t | -0.035 | 0.005 | (3.18+/-0.12)e2 | 0.67 +/- 2.50 | K | PROP LINE TEMP 04 | |
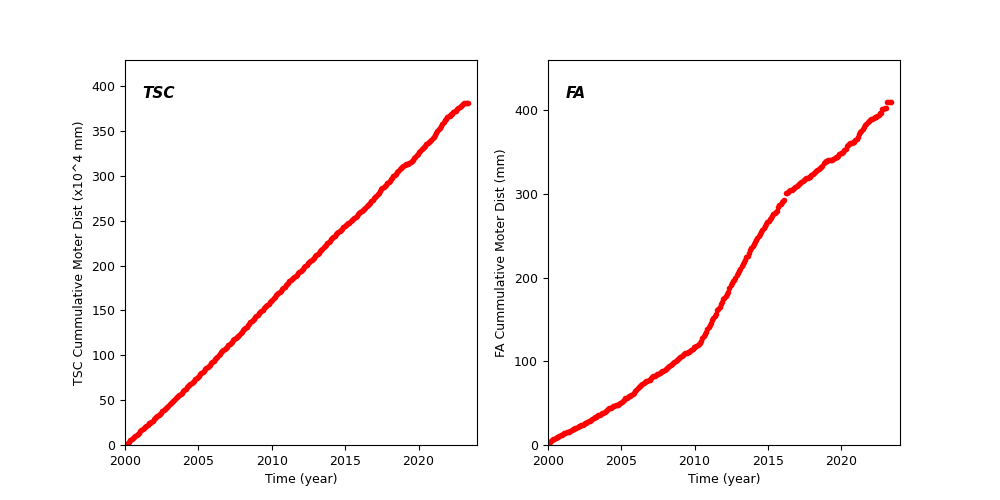
Spacecraft Motions
TSC and FA Cummulative Moter Distance
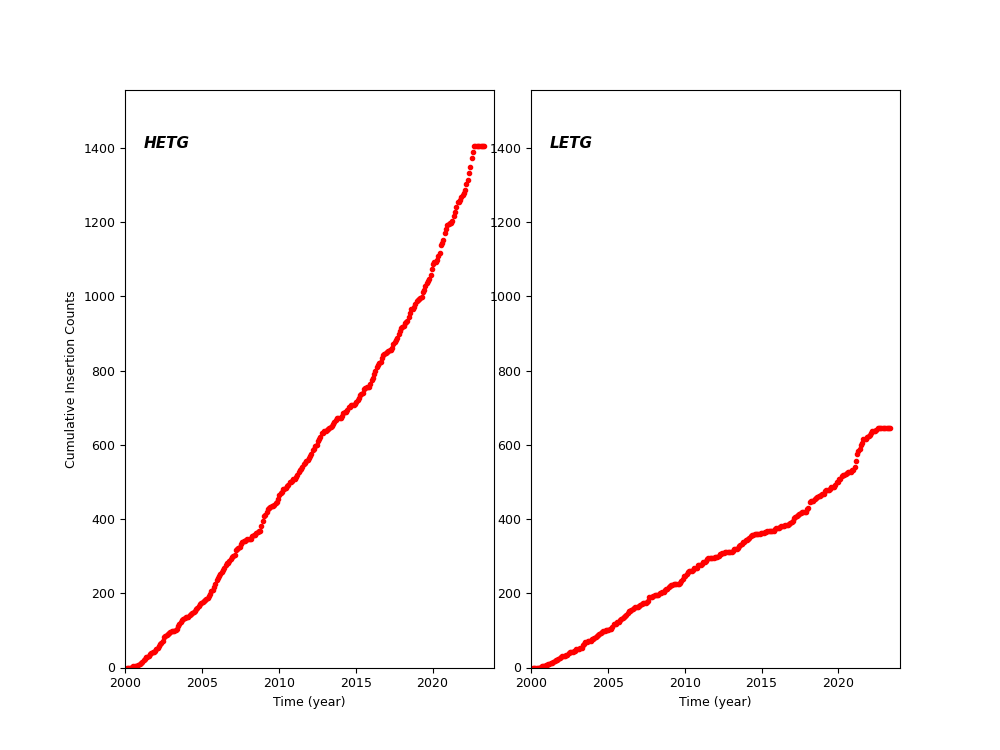
HETG and LETG Cummulative Insertion Counts
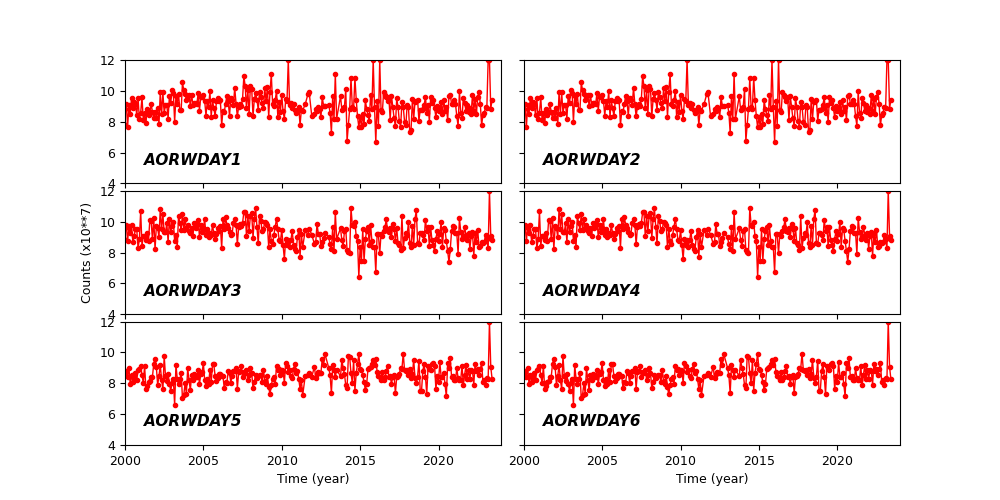
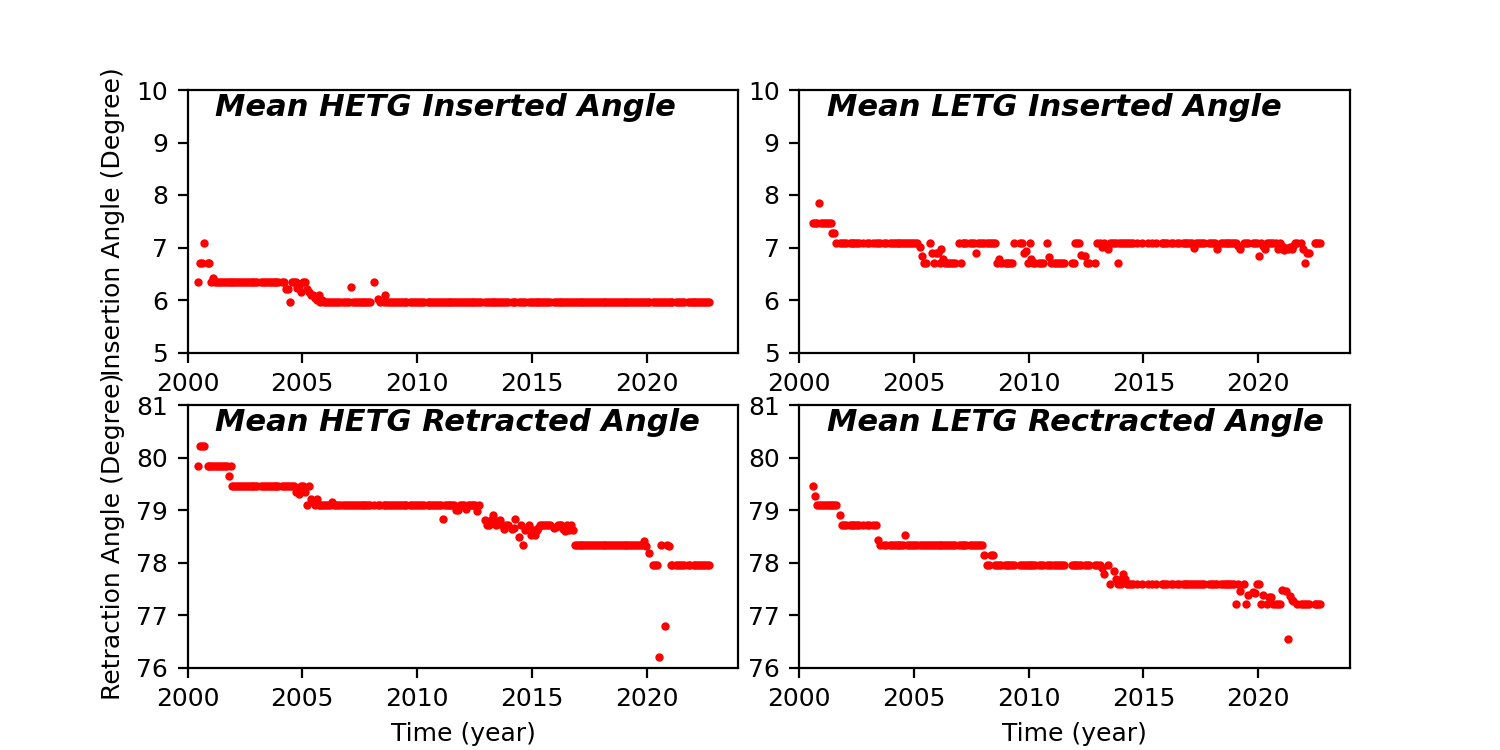
HETG/LETG Insertion/Retraction Angle
Reaction Wheel Rotations