ACIS
ACIS DOSE Registered-Photon-Map
The steps we took to compute the dose map are;
- Level 1 Event files for a specified month are obtained from archive.
- Image data including I2, I3, S2, S3 CCDs are extracted from all event files.
- All the extracted image data were merged to create a month long exposure map for the month.
- The exposure map is opened with ds9, and check a distribution of count rates against energy. From this, estimate the upper threshold value. Any events beyond this upper threshold are assumed erroneous events such as bad pixels.
- Using this upper threshold, the data is filtered, and create a cleaned exposure map for the month.
- The exposure map from each month from the Sep 1999 is added up to create a cumulative exposure map for each month.
- Using fimgstatistic, we compute count rate statistics for each CCDs.
- For observations with high data drop rates (e.g., Crab nebula, Cas A), we corrected the observations by adding events.
Please check more detail plots at Telemetered Photon Dose Trend page.
)
)
)
Statistics:
# IMAGE     NPIX     MEAN        RMS        MIN     MAX
ACIS_jun23 6004901       4.839         10.002           0.0      357


I2 node 0  262654	2.864420	1.882347	0.0	 37.0
I2 node 1  262654	3.025677	2.021565	0.0	142.0
I2 node 2  262654	3.061969	1.974845	0.0	 42.0
I2 node 3  262654	3.143374	2.164871	0.0	200.0

I3 node 0  262654	3.440453	2.292769	0.0	 49.0
I3 node 1  262654	3.223719	2.111350	0.0	119.0
I3 node 2  262654	3.157150	1.987402	0.0	 34.0
I3 node 3  262654	3.036460	2.011627	0.0	284.0

S2 node 0  262654	5.466789	4.827673	0.0	 48.0
S2 node 1  262654	6.320950	6.628639	0.0	153.0
S2 node 2  262654	9.502788	13.620249	0.0	178.0
S2 node 3  262654	10.810296	14.985759	0.0	231.0

S3 node 0  262654	12.946963	21.100340	0.0	357.0
S3 node 1  262654	12.172051	17.852574	0.0	251.0
S3 node 2  262654	12.051892	17.785201	0.0	233.0
S3 node 3  262654	9.936037	12.700780	0.0	141.0
)
)
)
Statistics:
 IMAGE     NPIX      MEAN        RMS           MIN      MAX
ACIS_total   6004901       2643.835         3370.135           0.0   148219


I2 node 0  262654	2295.793328	464.296167	490.0	14403.0
I2 node 1  262654	2417.858436	668.204347	504.0	146213.0
I2 node 2  262654	2446.341396	518.088197	527.0	15388.0
I2 node 3  262654	2451.482958	634.065028	488.0	31860.0

I3 node 0  262654	2637.569169	649.319553	491.0	14360.0
I3 node 1  262654	2719.323122	1746.520691	516.0	55937.0
I3 node 2  262654	2431.043744	454.152538	487.0	14645.0
I3 node 3  262654	2411.717363	489.083919	457.0	35411.0

S2 node 0  262654	3081.719727	499.831759	1672.0	22490.0
S2 node 1  262654	3268.788745	743.341133	1854.0	17635.0
S2 node 2  262654	3618.796086	745.112344	2266.0	31710.0
S2 node 3  262654	3581.886439	601.996164	1997.0	77904.0

S3 node 0  262654	5472.006955	2974.428806	2405.0	54692.0
S3 node 1  262654	6686.688535	2381.692768	0.0	62613.0
S3 node 2  262654	5416.012791	1361.830922	2511.0	27408.0
S3 node 3  262654	4238.736298	764.257738	2566.0	26570.0
)
|
)
|
)
|
)
|
| Mar 2023 | Dec 2022 | Sep 2022 | Jun 2022 |
|---|
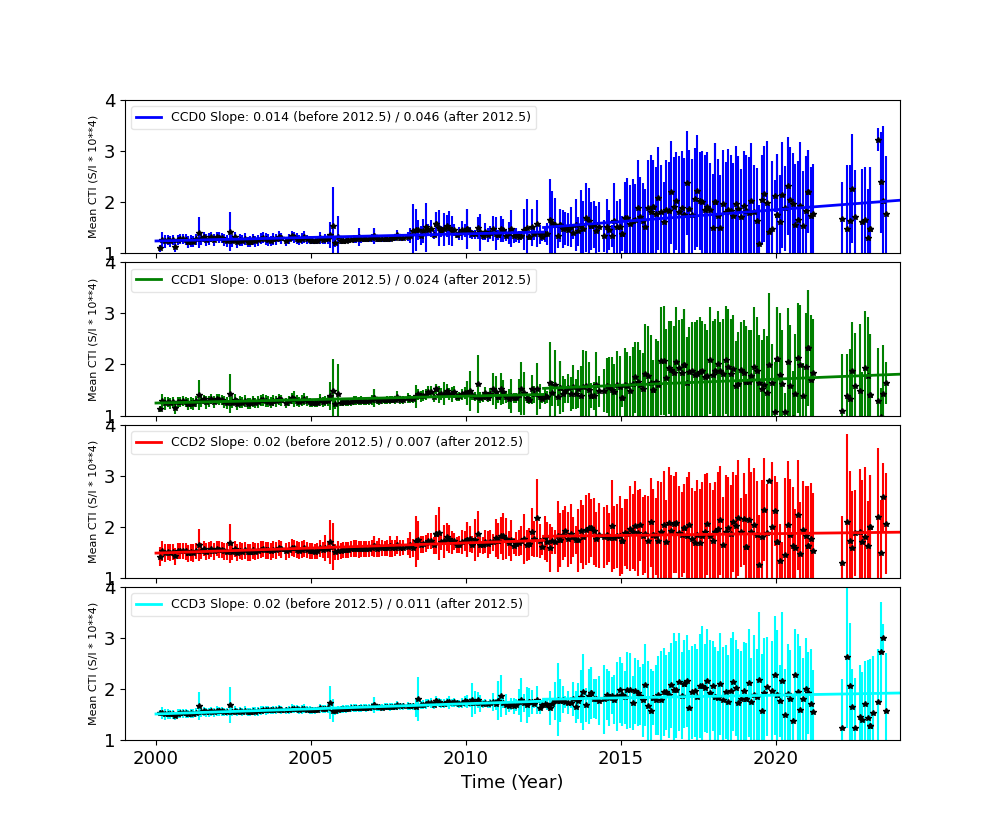
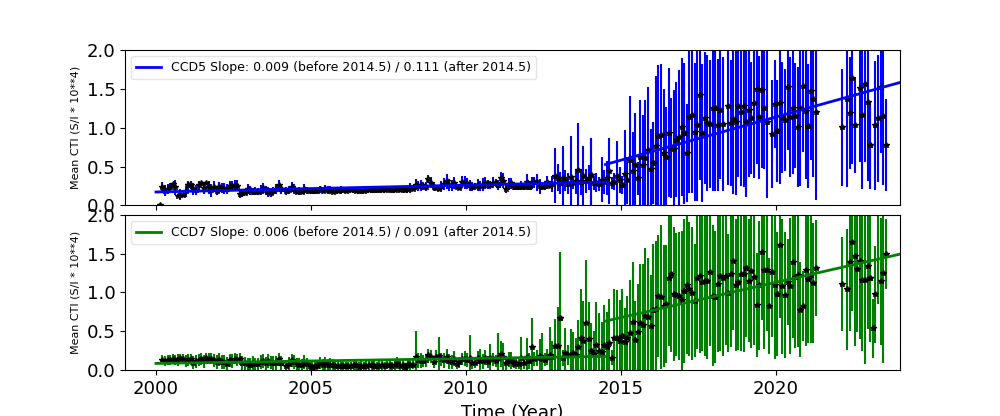
The Mean Detrended CTI
We report CTIs with a refined data definition. CTIs were computed for the temperature dependency corrected data. Please see CTI page for detailed explanation. CTI's are computed for Mn K alpha, and defined as slope/intercept x10^4 of row # vs ADU. Data file: here
Imaging CCDs
Spectral CCDs
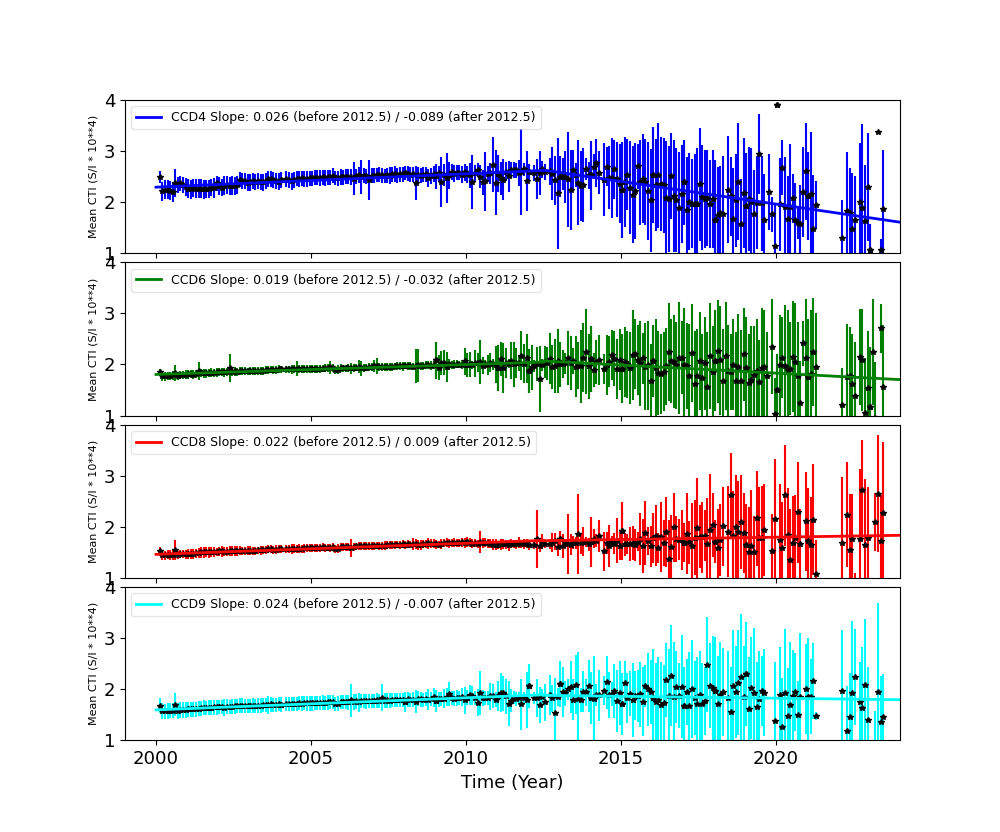
Backside CCDs
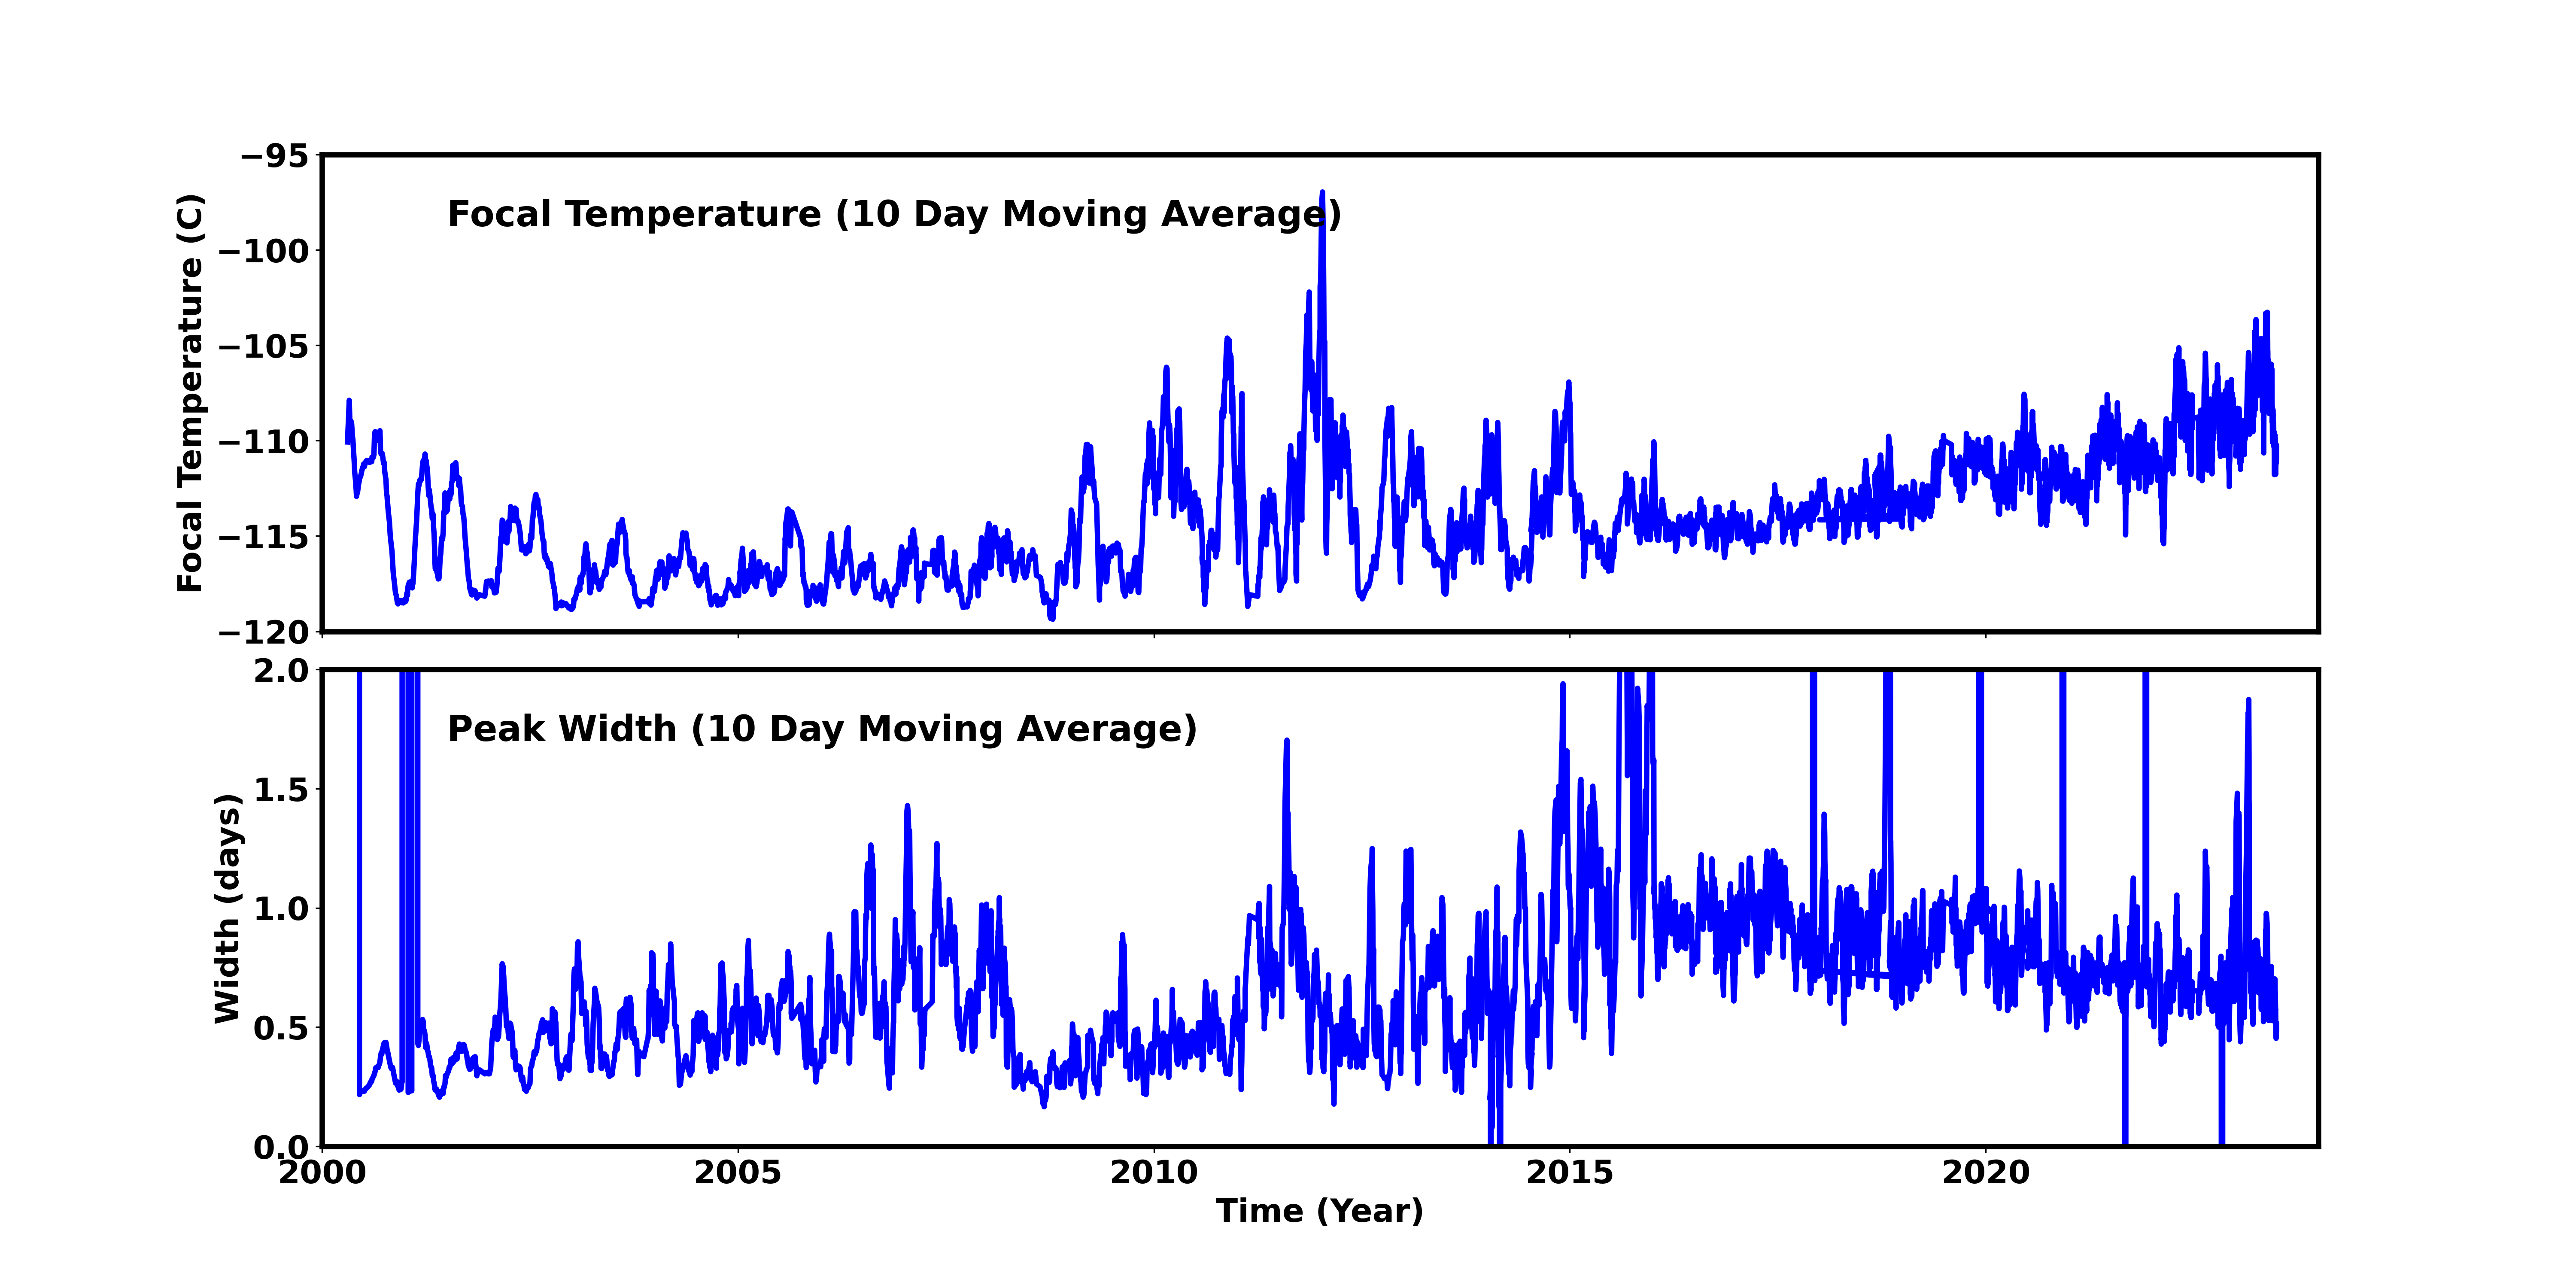
Focal Plane Temperature
Jun 2023 Focal Temperature
| The Mean (max) FPT: | |
|---|---|
| -109.6 | +/- 6.14 C |
| Mean Width: | |
| 0.6 | +/- 0.24 days |
Averaged Focal Plane Temperature
We are using 10 period moving averages to show trends of peak temperatures and peak widths. Note, the gaps in the width plot are due to missing/corrupted data.
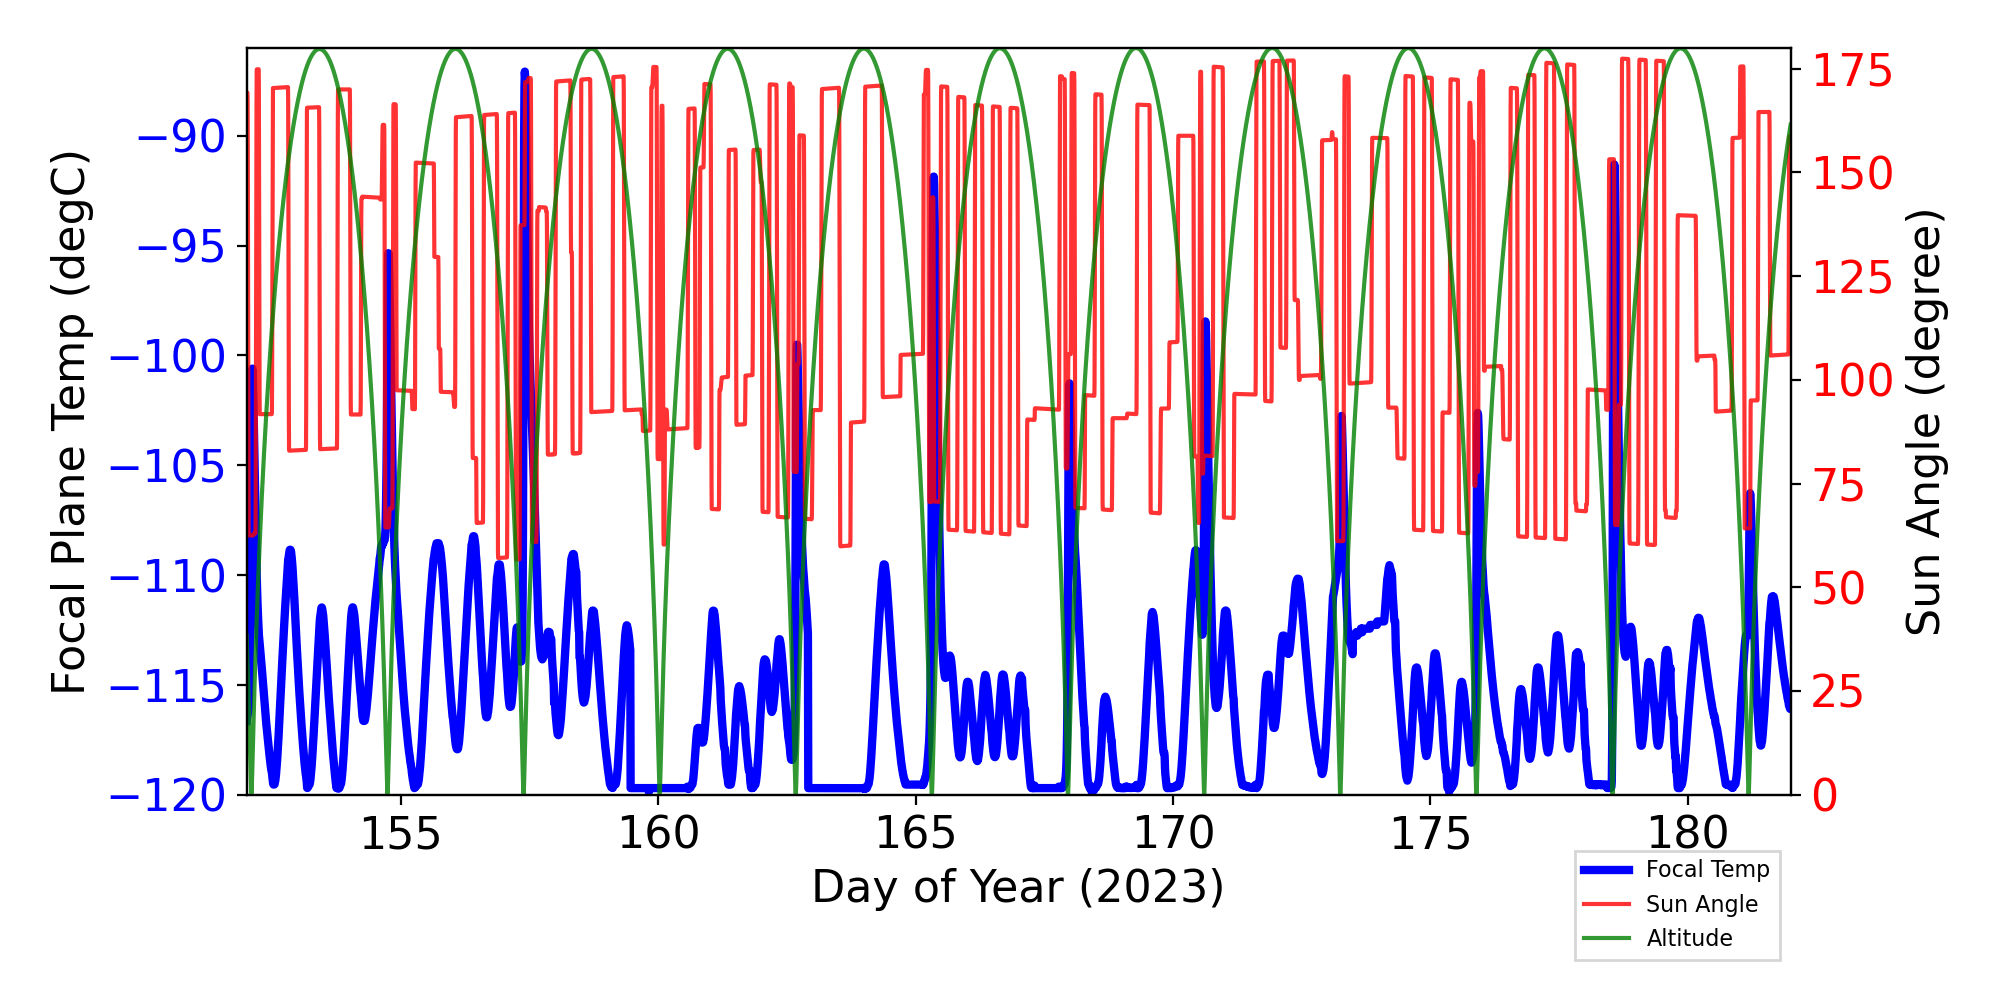
Focal Plane Temperature, Sun Angle and Altitude
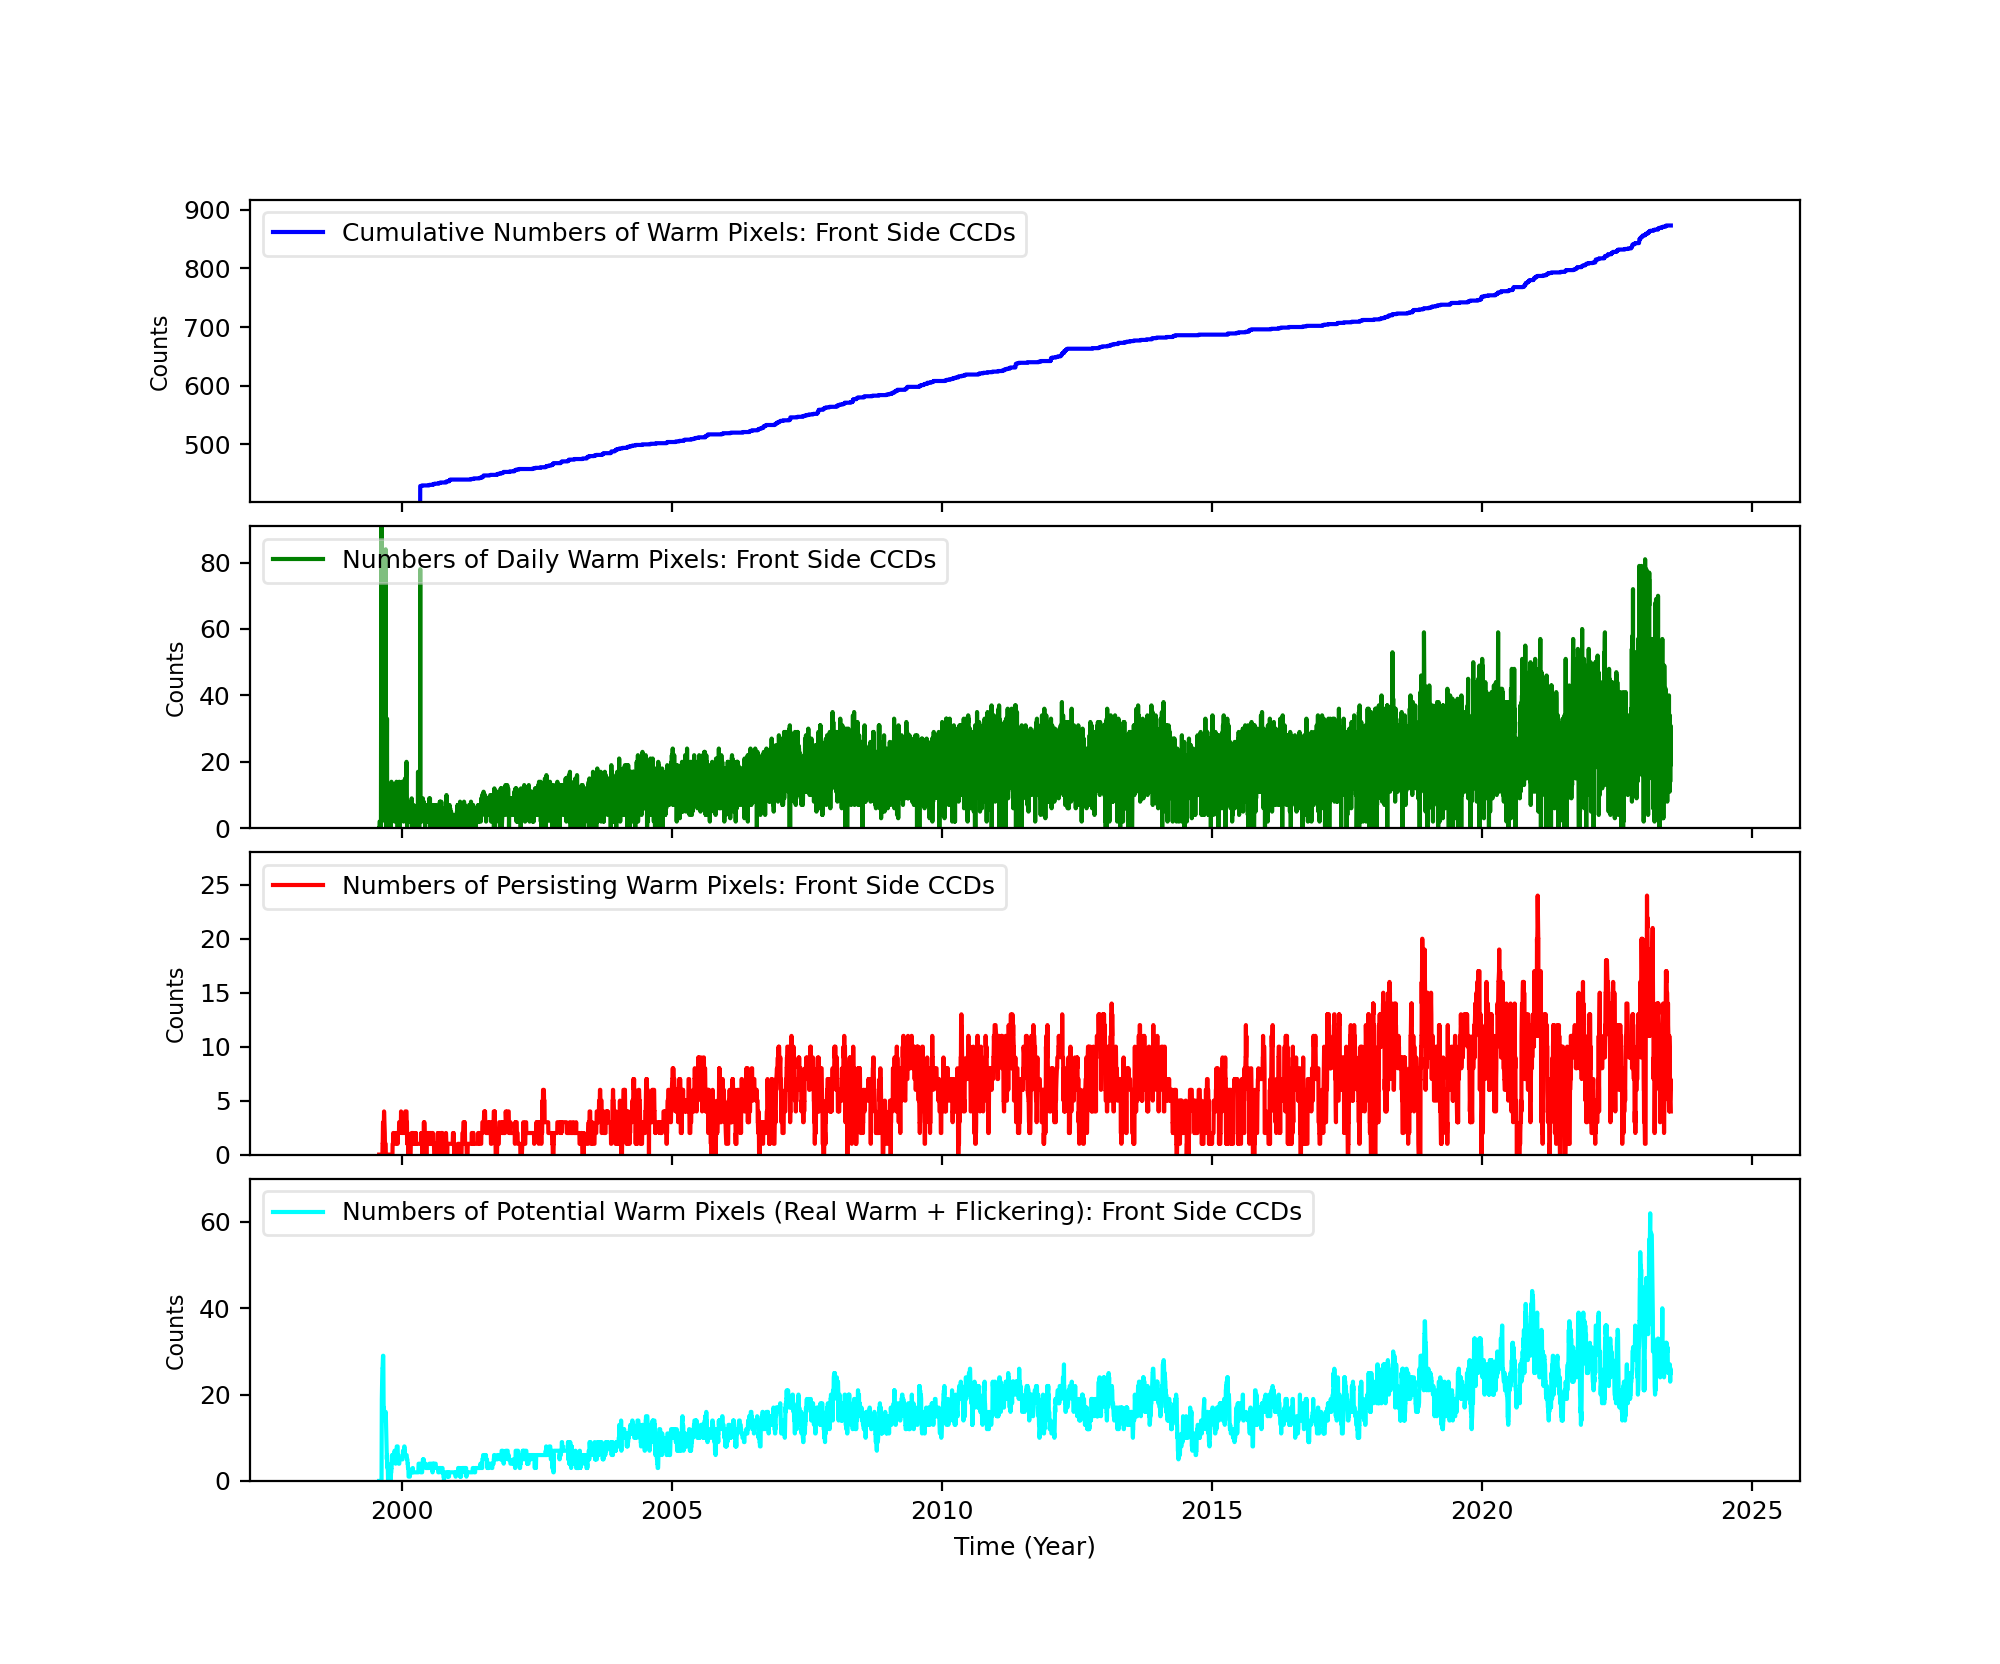
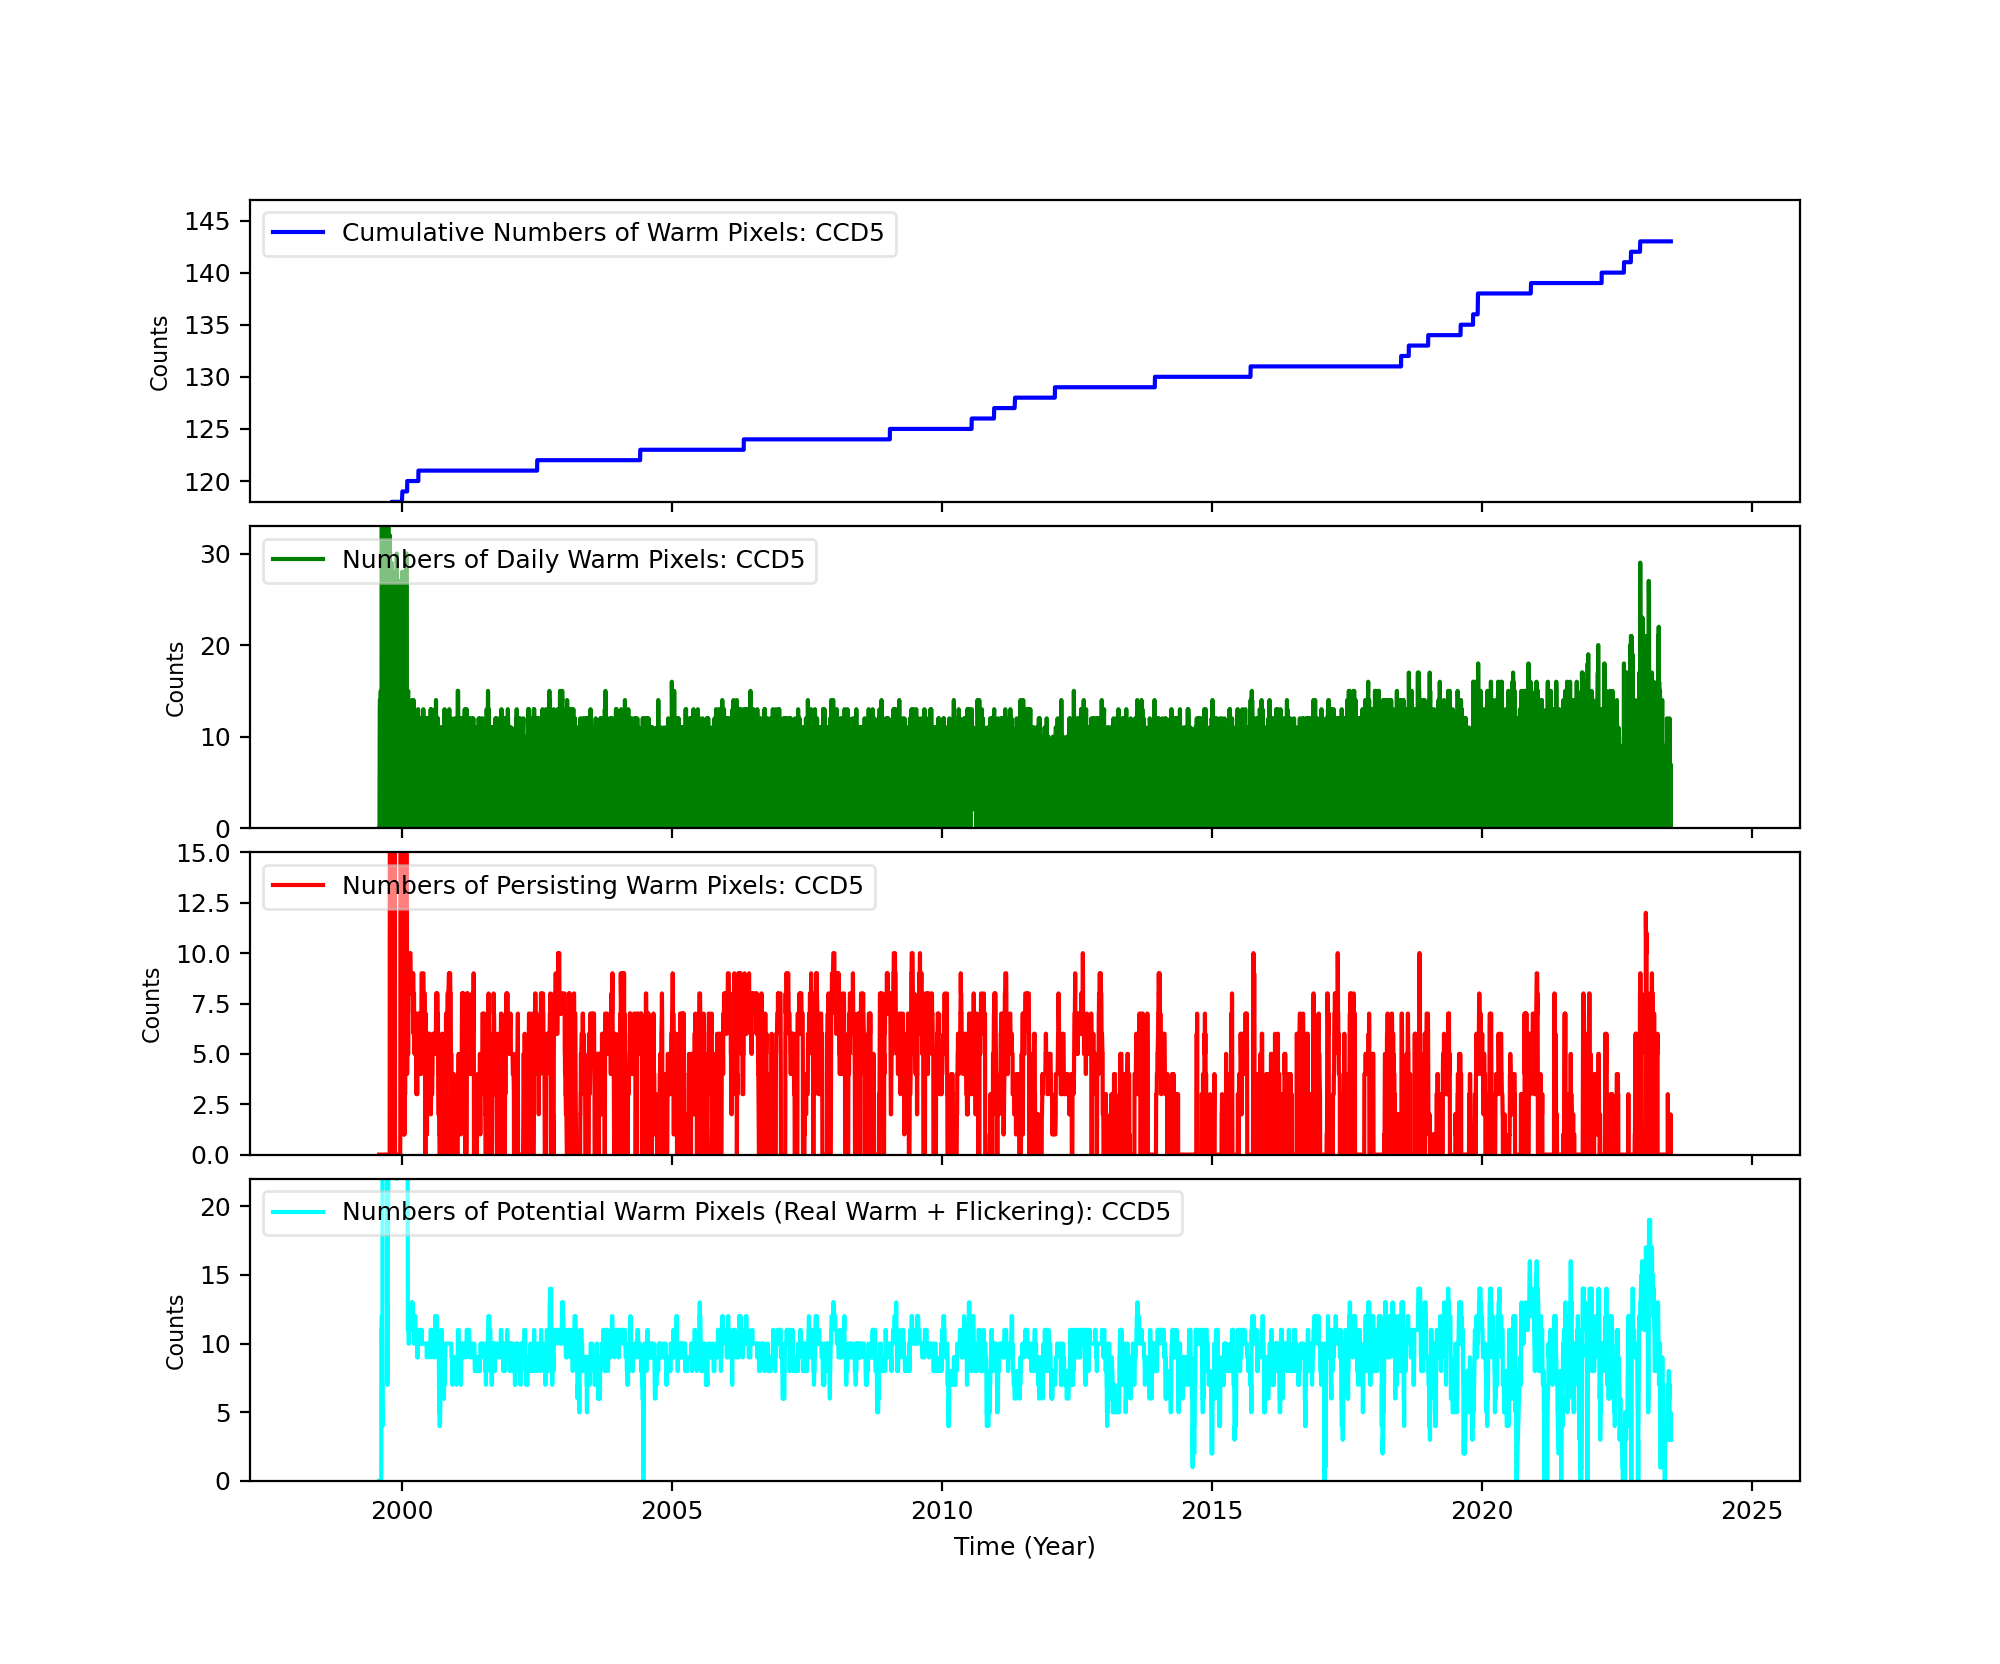
Bad Pixels
The plots below were generated with a new warm pixel finding script. Please see Acis Bad Pixel Page for details.
Front Side CCDs
Back Side CCD (CCD5)
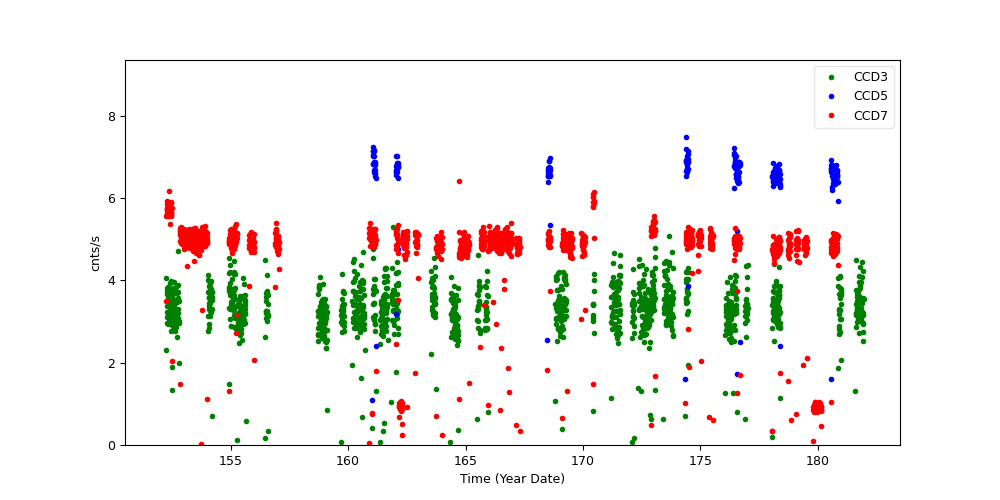
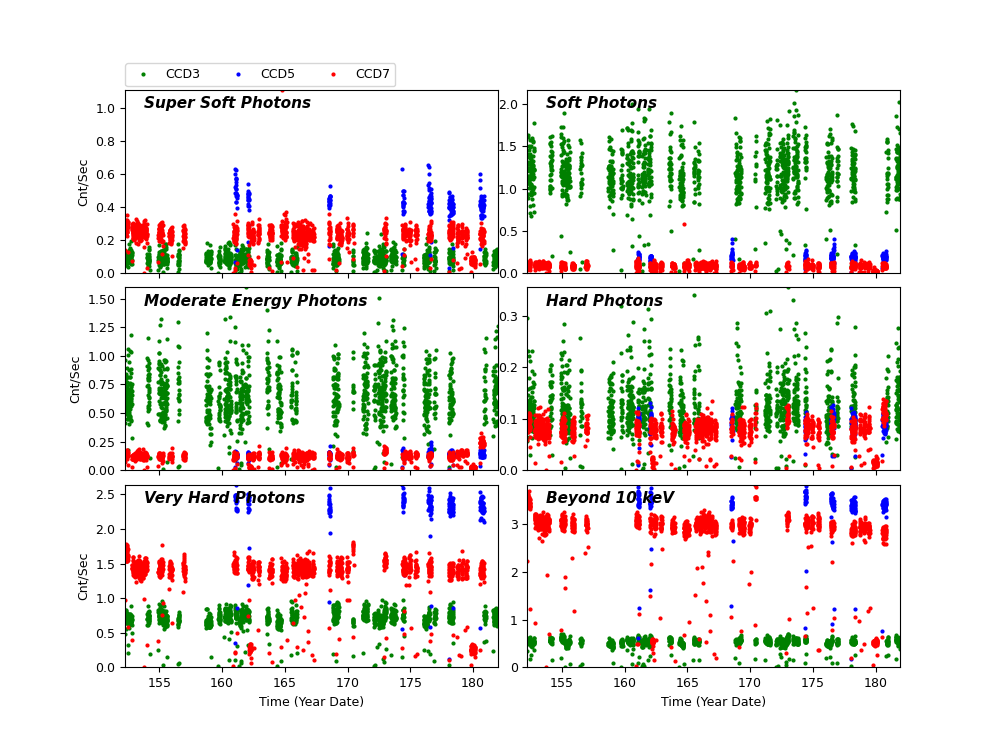
Science Instrument Background Rates
| Name | Low (keV) | High(KeV) | Description |
|---|---|---|---|
| SSoft | 0.00 | 0.50 | Super soft photons |
| Soft | 0.50 | 1.00 | Soft photons |
| Med | 1.00 | 3.00 | Moderate energy photons |
| Hard | 3.00 | 5.00 | Hard Photons |
| Harder | 5.00 | 10.00 | Very Hard photons |
| Hardest | 10.00 | Beyond 10 keV |
HRC
DOSE of Central 4K Pore-Pairs
Please refer to Maximum Dose Trends for more details.
)
|
|---|
IMAGE                NPIX      MEAN    STDDEV      MIN       MAX
HRCI_06_2023.fits  16777216	0.123 	0.411 	0.000 	15.000
)
IMAGE                       NPIX      MEAN    STDDEV      MIN       MAX
HRCI_08_1999_06_2023.fits  16777216	na	na	na	na
)
|
|---|
IMAGE                NPIX      MEAN    STDDEV      MIN       MAX
HRCS_06_2023.fits  16777216	0.021 	0.200 	0.000 	17.000
)
IMAGE                       NPIX      MEAN    STDDEV      MIN       MAX
HRCS_08_1999_06_2023.fits  16777216	na	na	na	na
|
|
Max dose trend plots corrected for events that "pile-up"
in the center of the taps due to bad position information.
|
)
|
)
|
)
|
)
|
| Mar 2023 | Dec 2022 | Sep 2022 | Jun 2022 |
|---|
)
|
)
|
)
|
)
|
| Mar 2023 | Dec 2022 | Sep 2022 | Jun 2022 |
|---|
Gratings
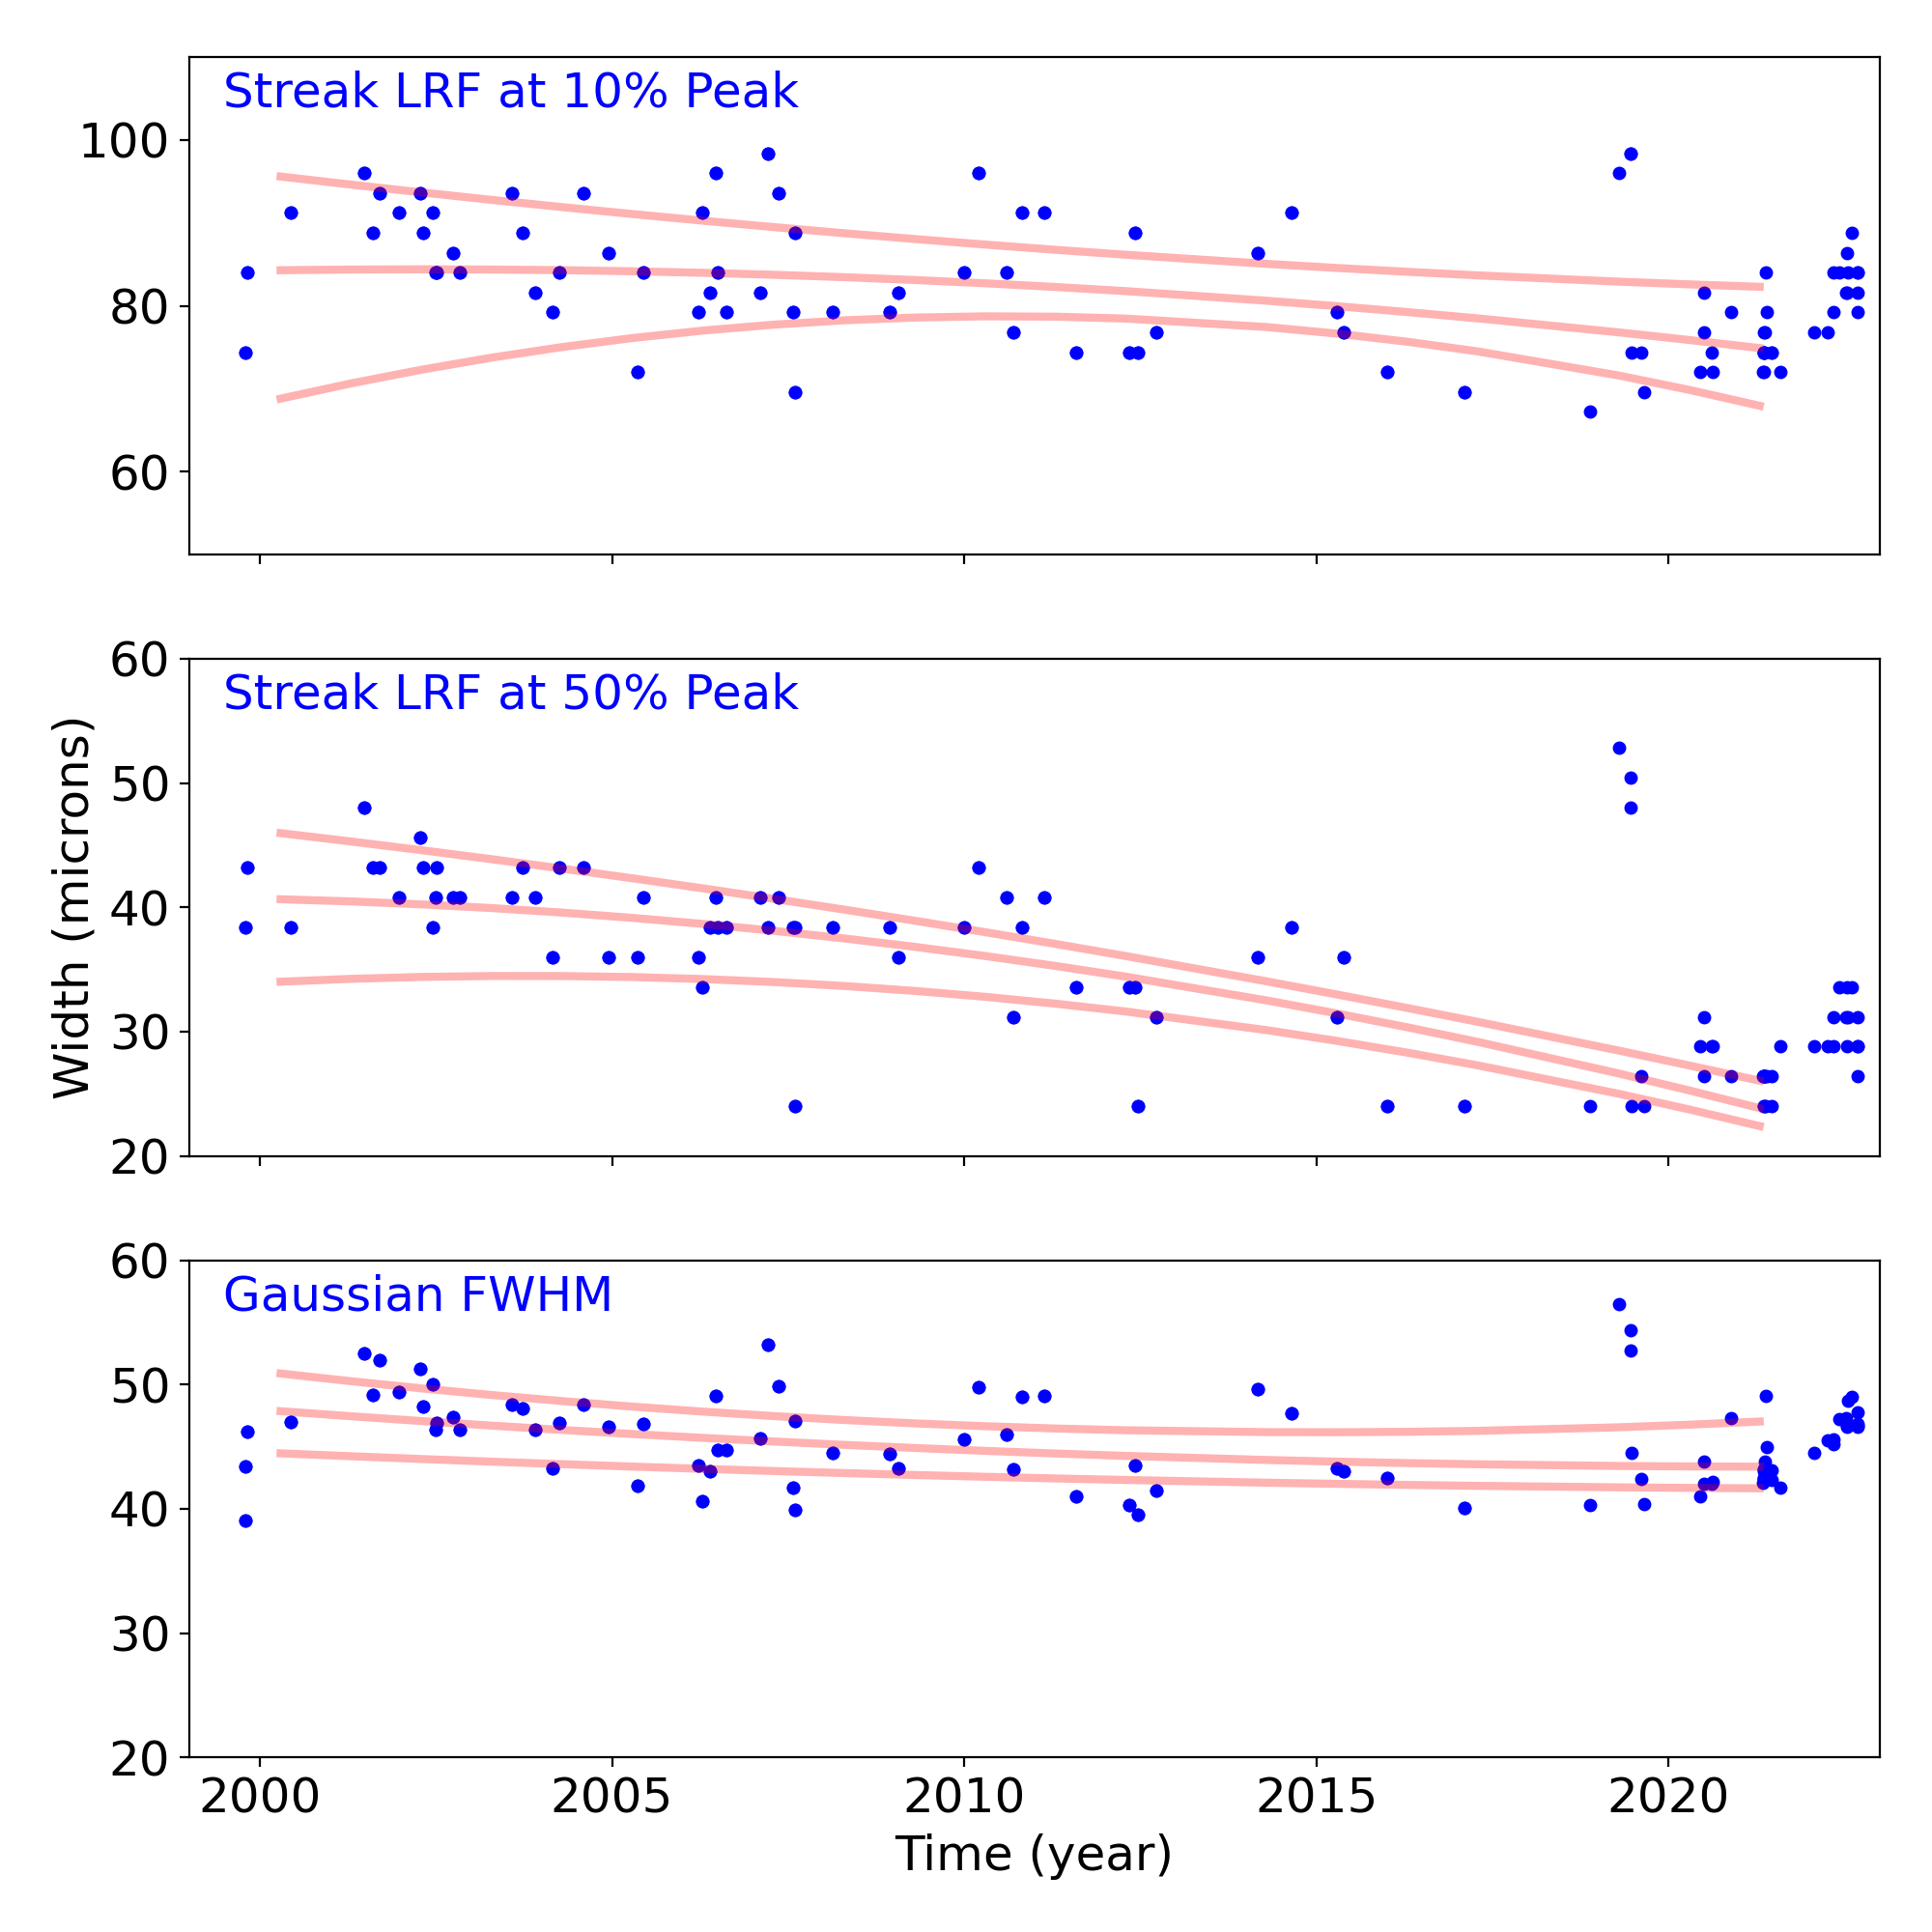
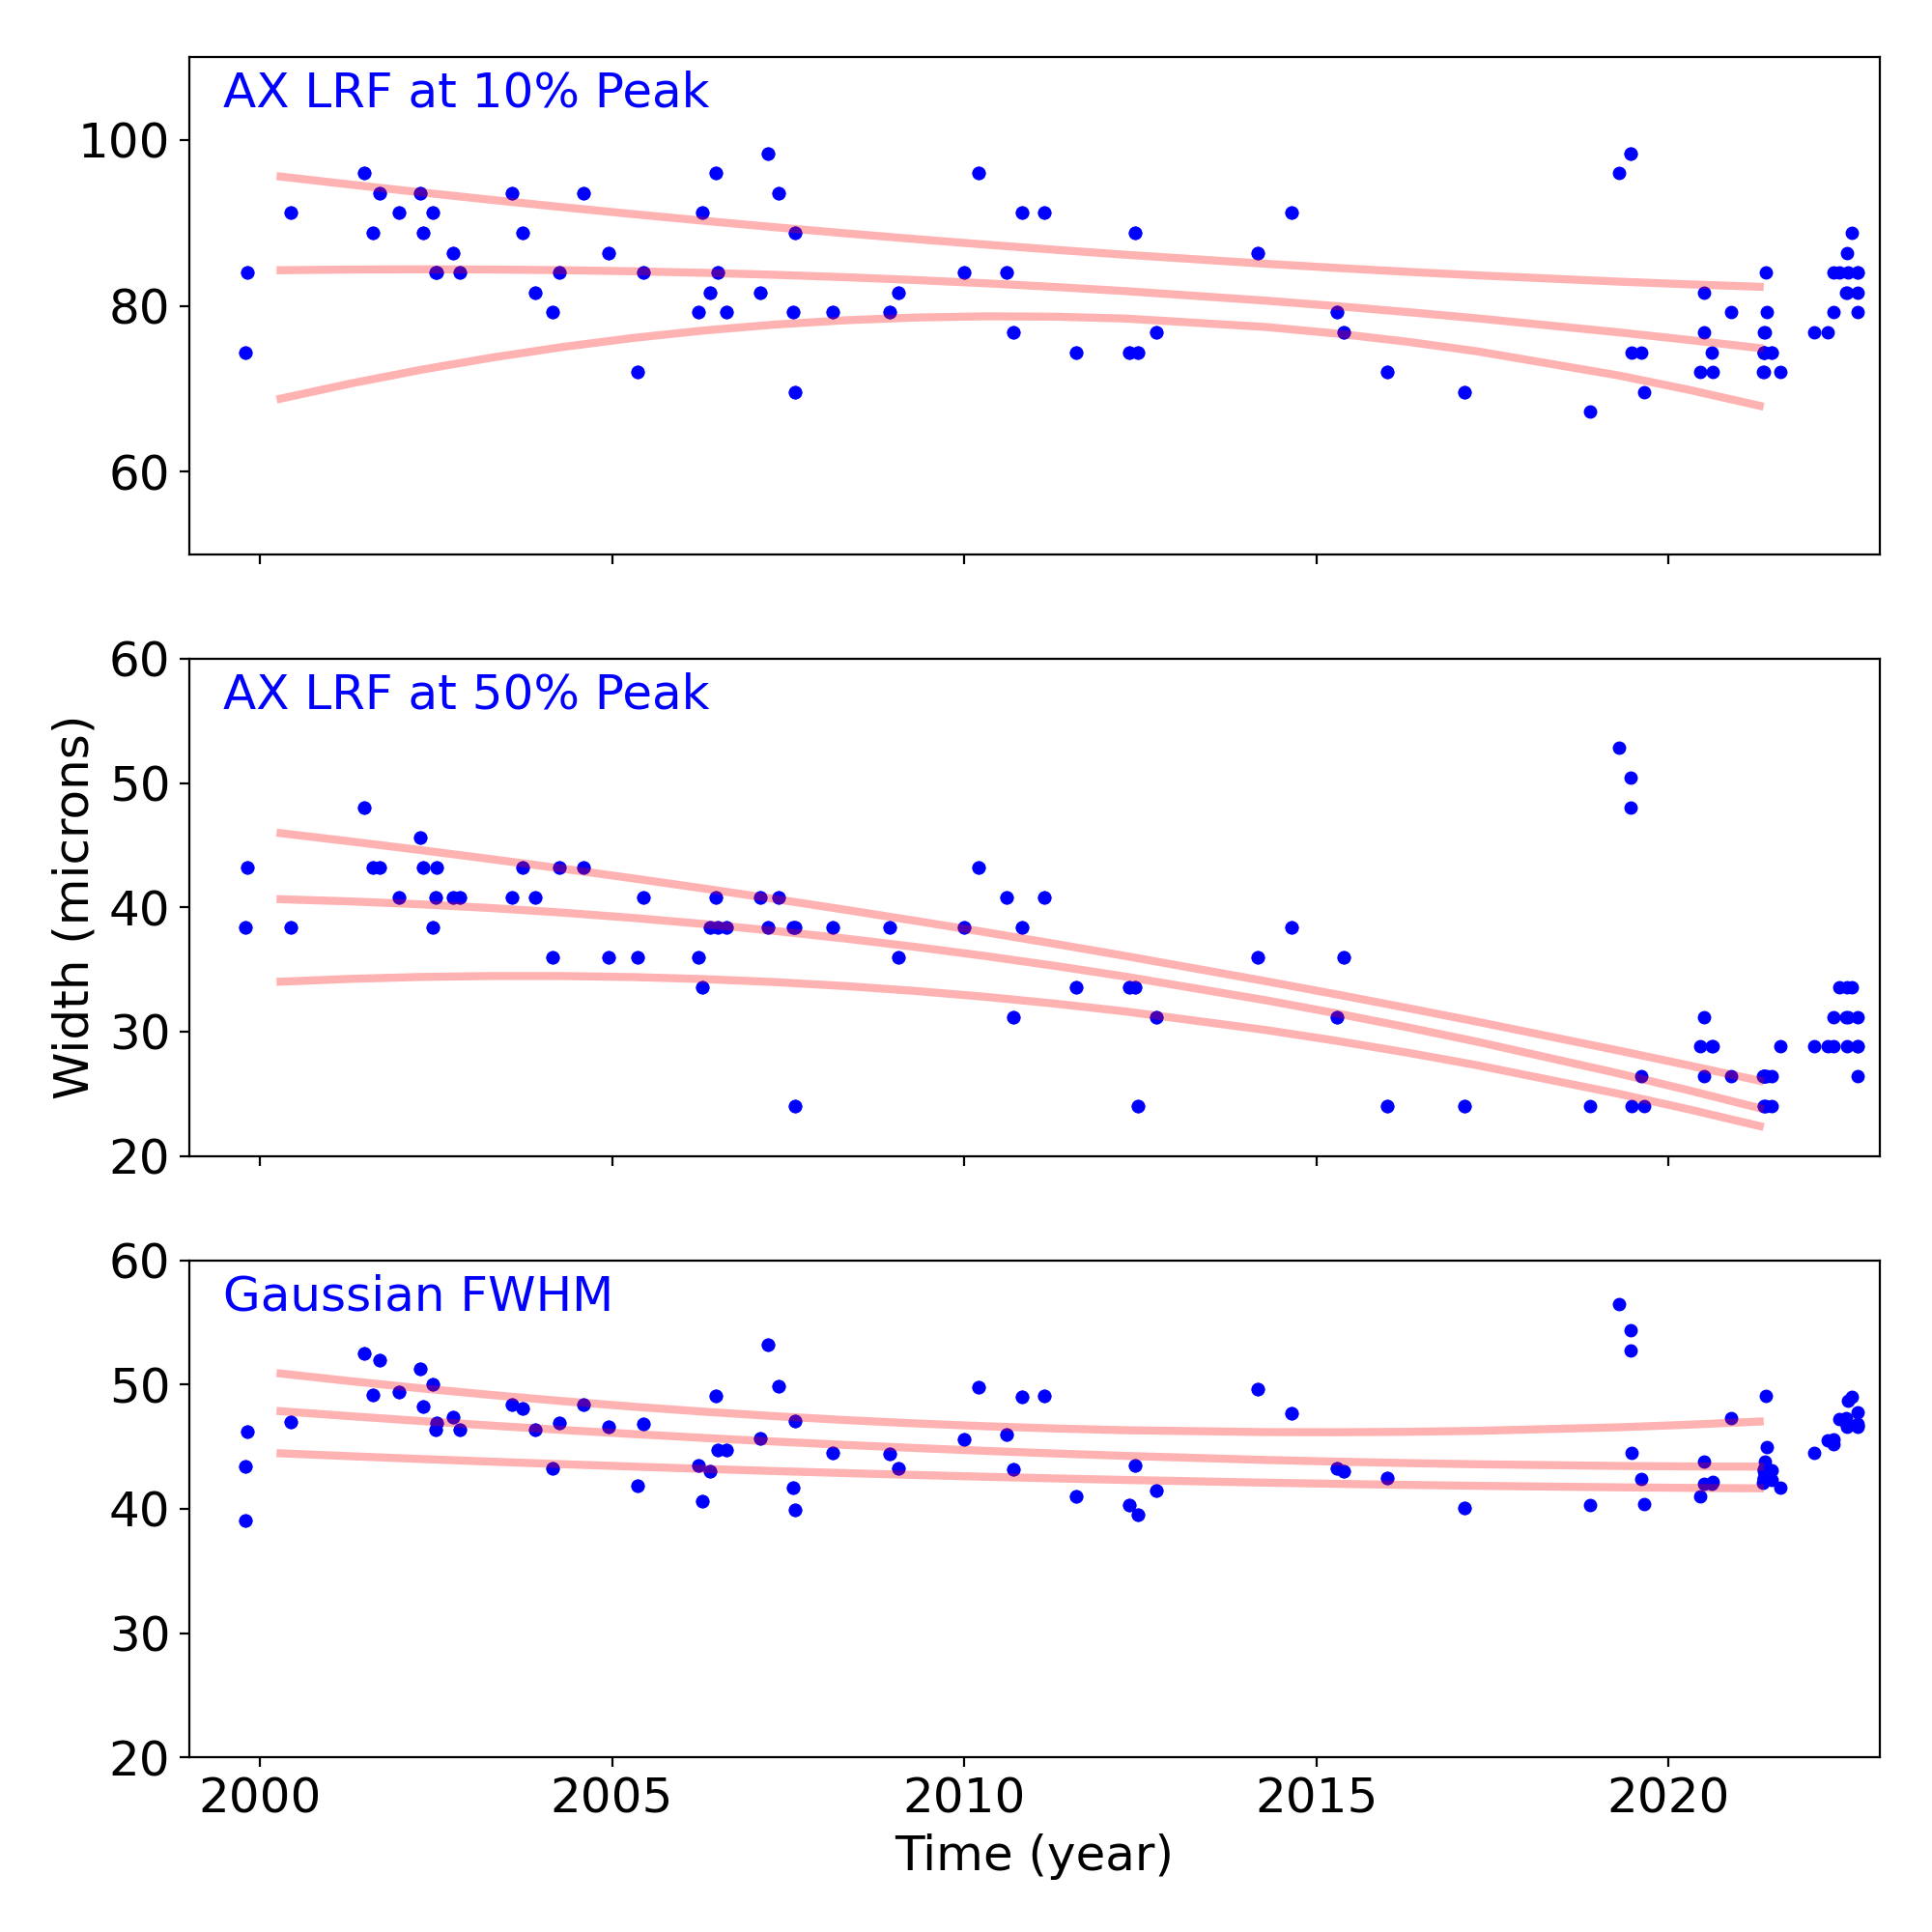
Grating Trends/Focus
We plot the width of the zero order streak of ACIS/HETG observations and the width of the zero order image for HRC/LETG observations of point sources. No significant defocusing trend is seen at this time. See Gratings Trends pages.
PCAD
ACA Trending
| ACIS |
)
|
)
|
)
|
|
|---|---|---|---|---|
)
|
)
|
)
| ||
| HRCI |
)
|
)
|
)
|
)
|
| HRCI |
)
|
)
|
)
|
)
|
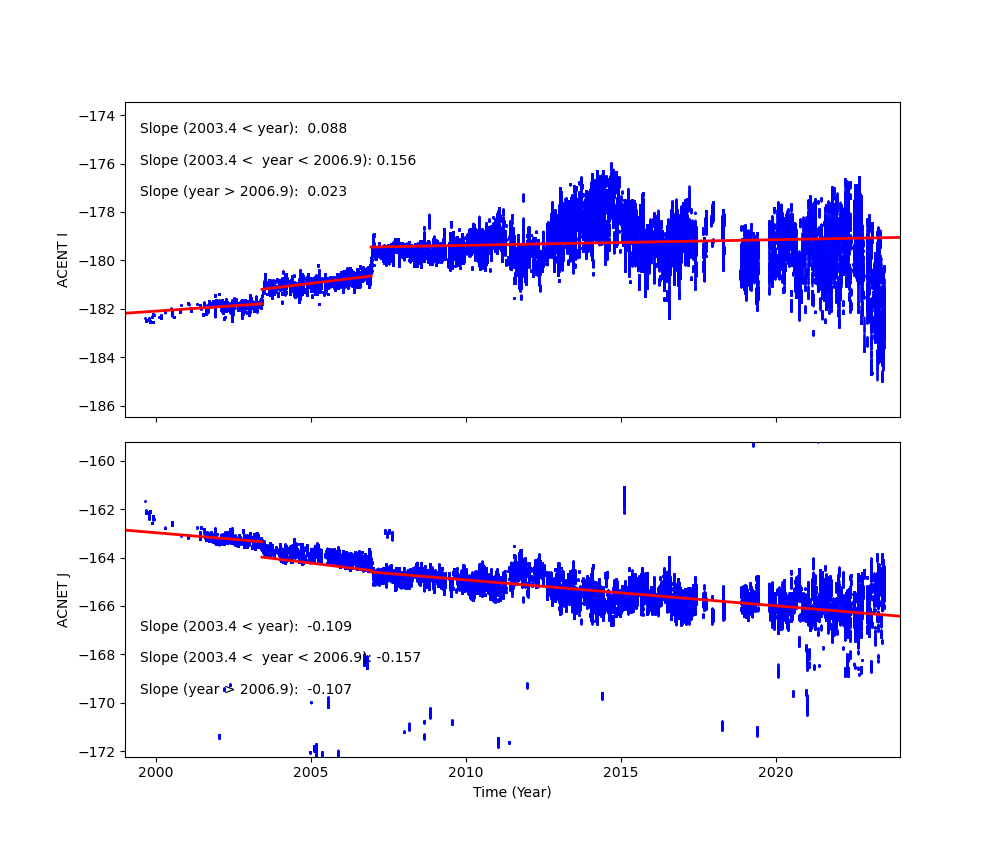
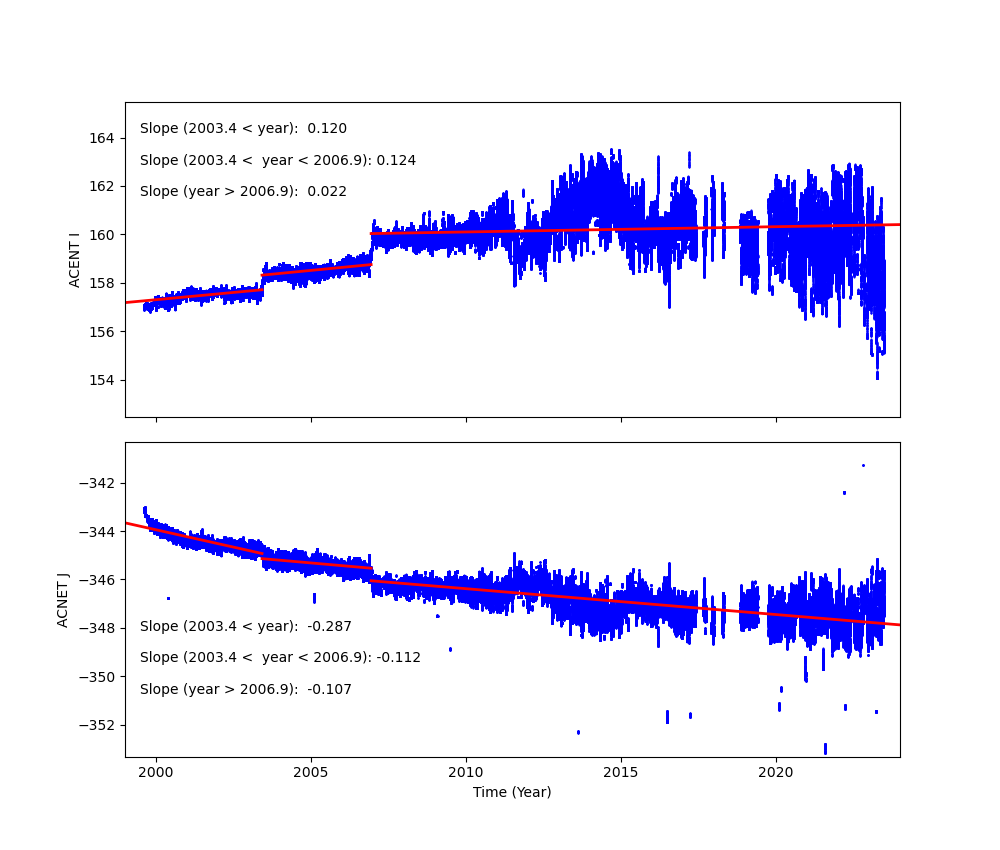
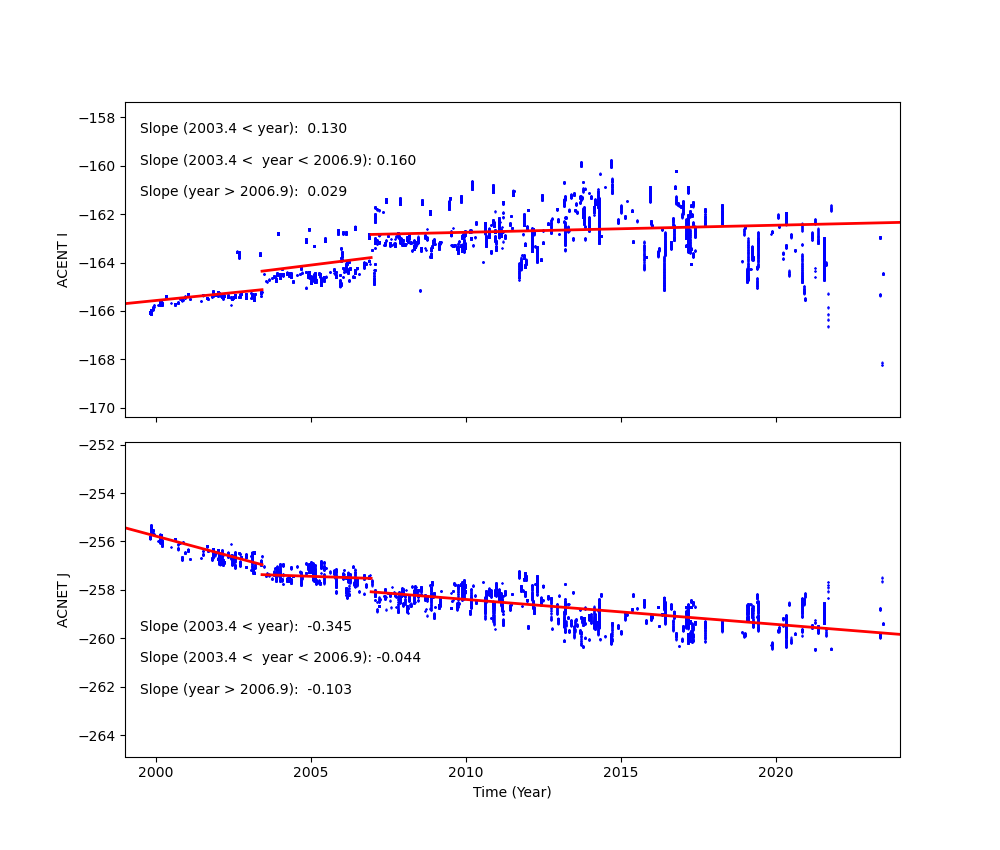
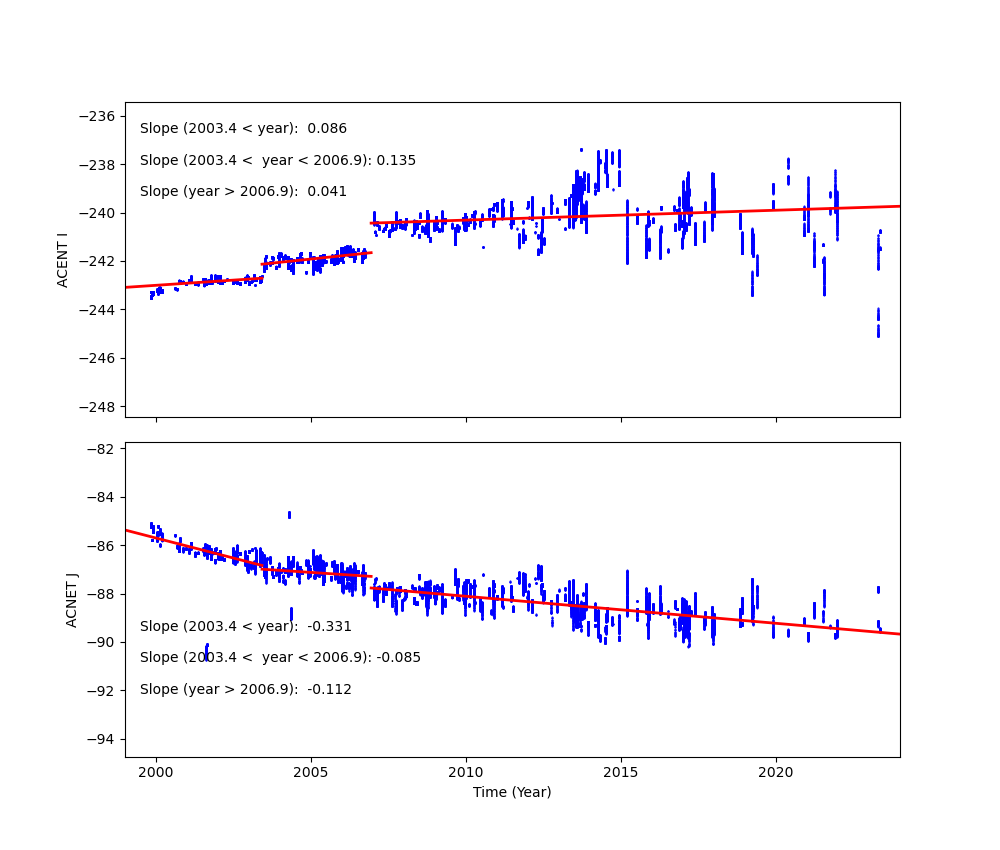
Fid Light Drift
Fid light positions on ACA drift with time. The drift trends of Fid light 2 with ACIS-I and ACIS-S configurations are shown below.
The top panel shows Fid light 2 drift in ACENT I (app. along with -Y axis), and the
bottom panel shows that in ACENT J (app. along with Z axis). The unit is a pixel, and
one pixel is approximately 0.5 arcsec. The slope listed at the top right corner is
the change in a position per year (arcsec/yr). The vertical line on DOM = 1411 (Jun 1, 2003)
indicates a transition date of use of IRU-1 to IRU-2.
See also Tom Aldcroft's updated page:
https://cxc.cfa.harvard.edu/mta/ASPECT/fid_drift
Fid 2 (ACIS-I)
Fid 2 (ACIS-S)
Fid 8 (HRC-I)
Fid 12 (HRC-S)
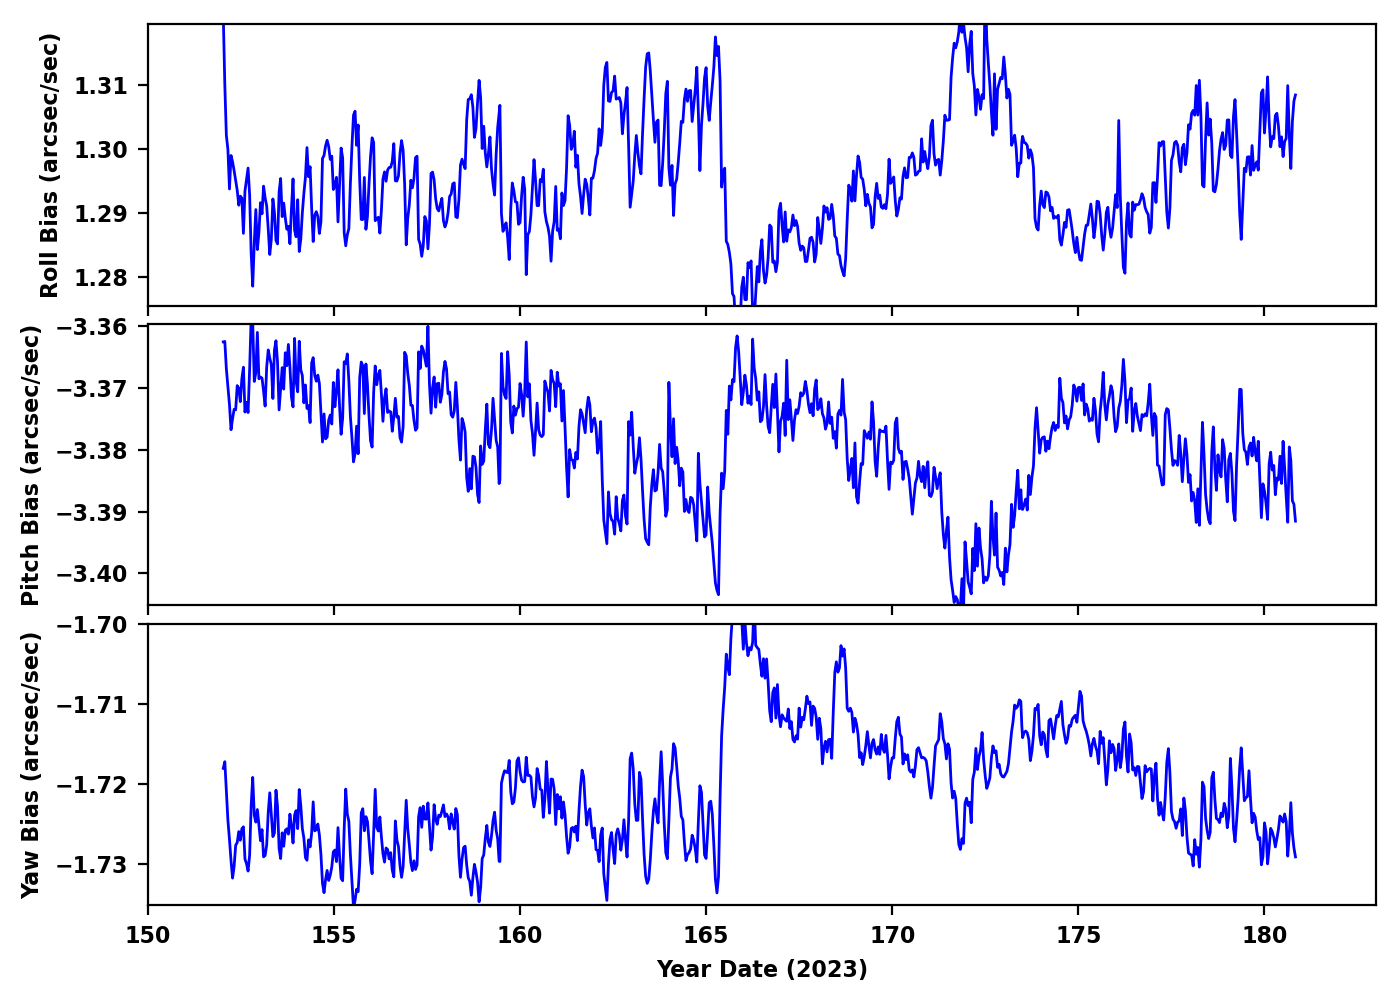
Gyro Bias Drift
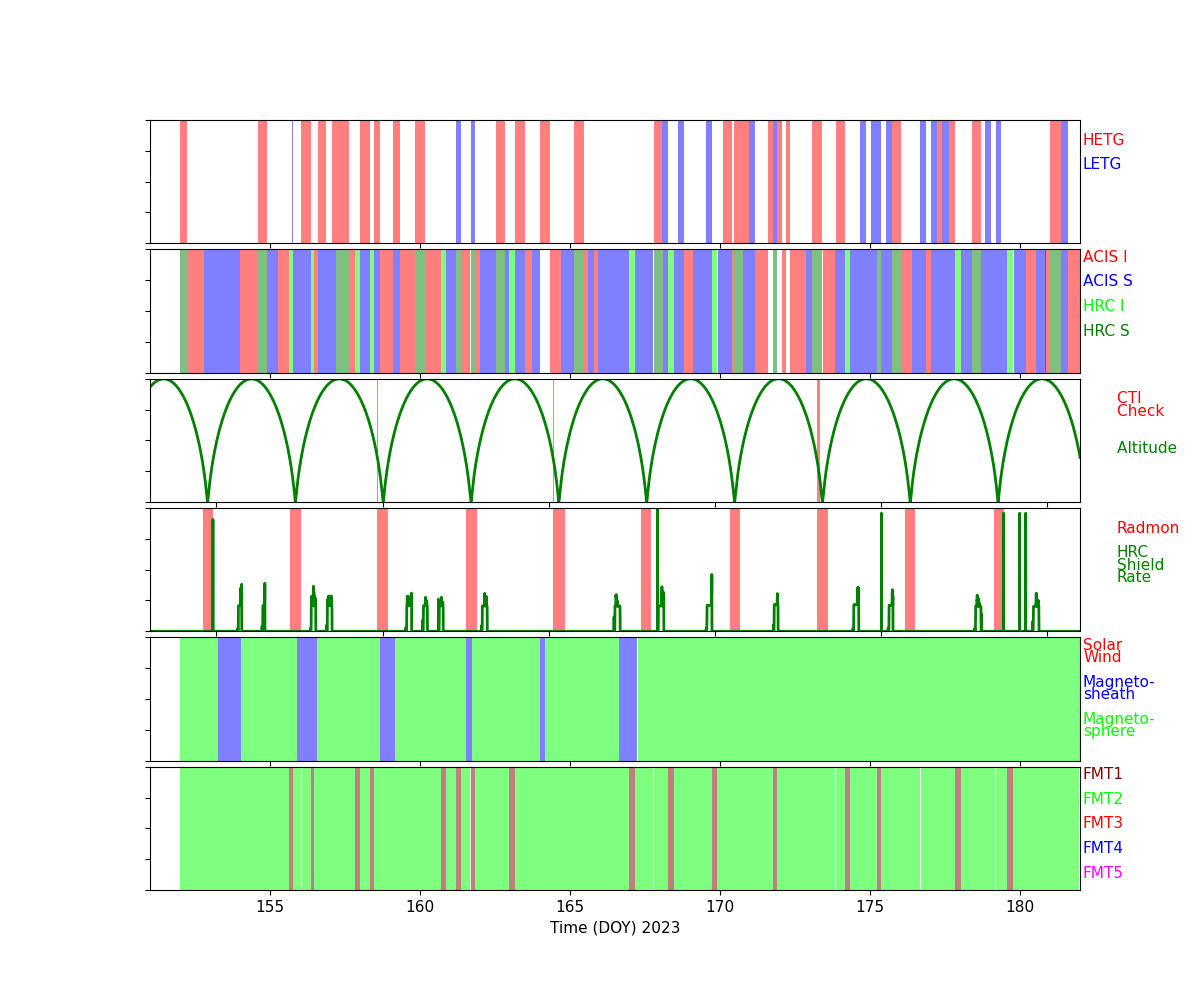
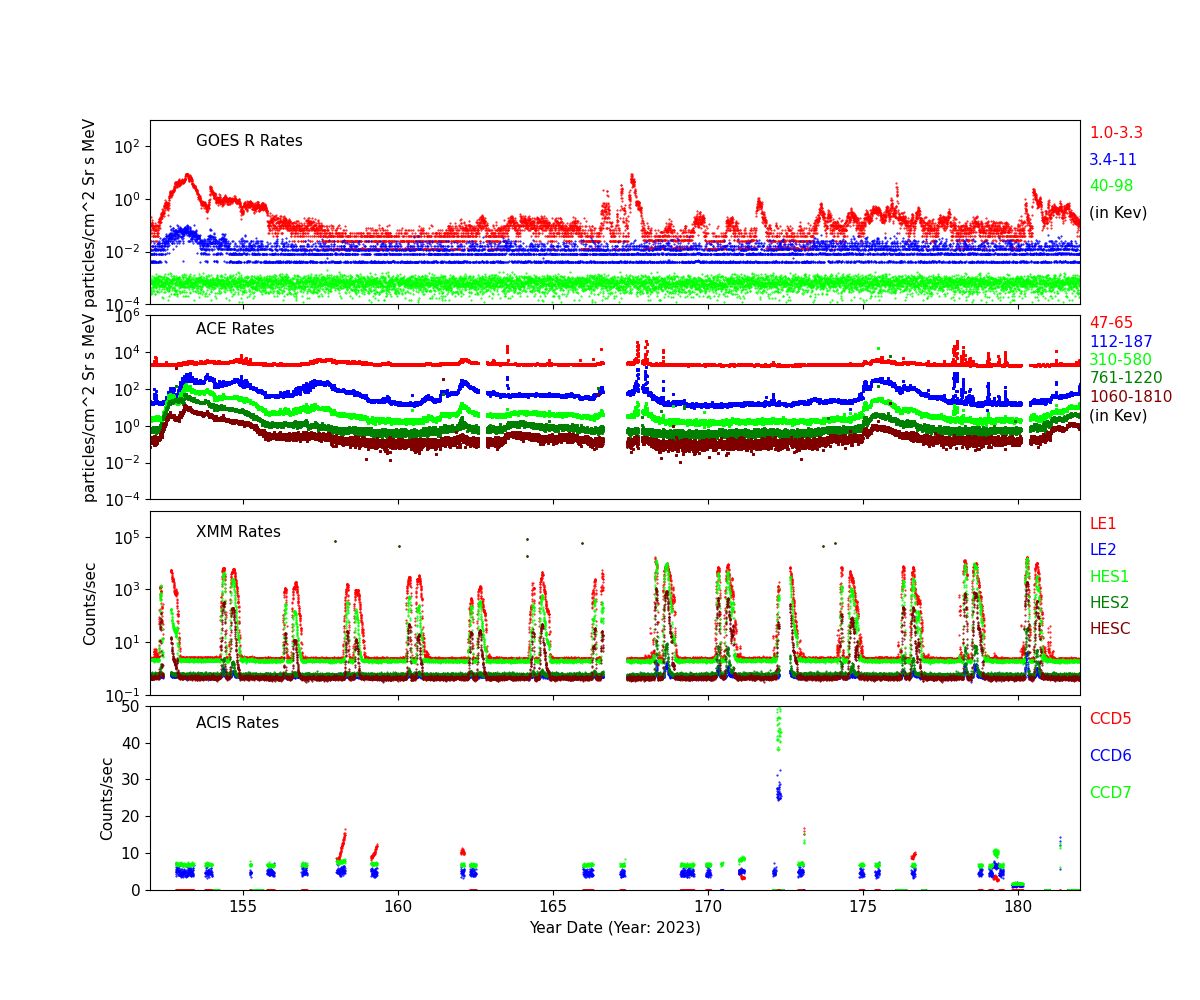
Radiation History
Radiation Count Rates of Jun 2023
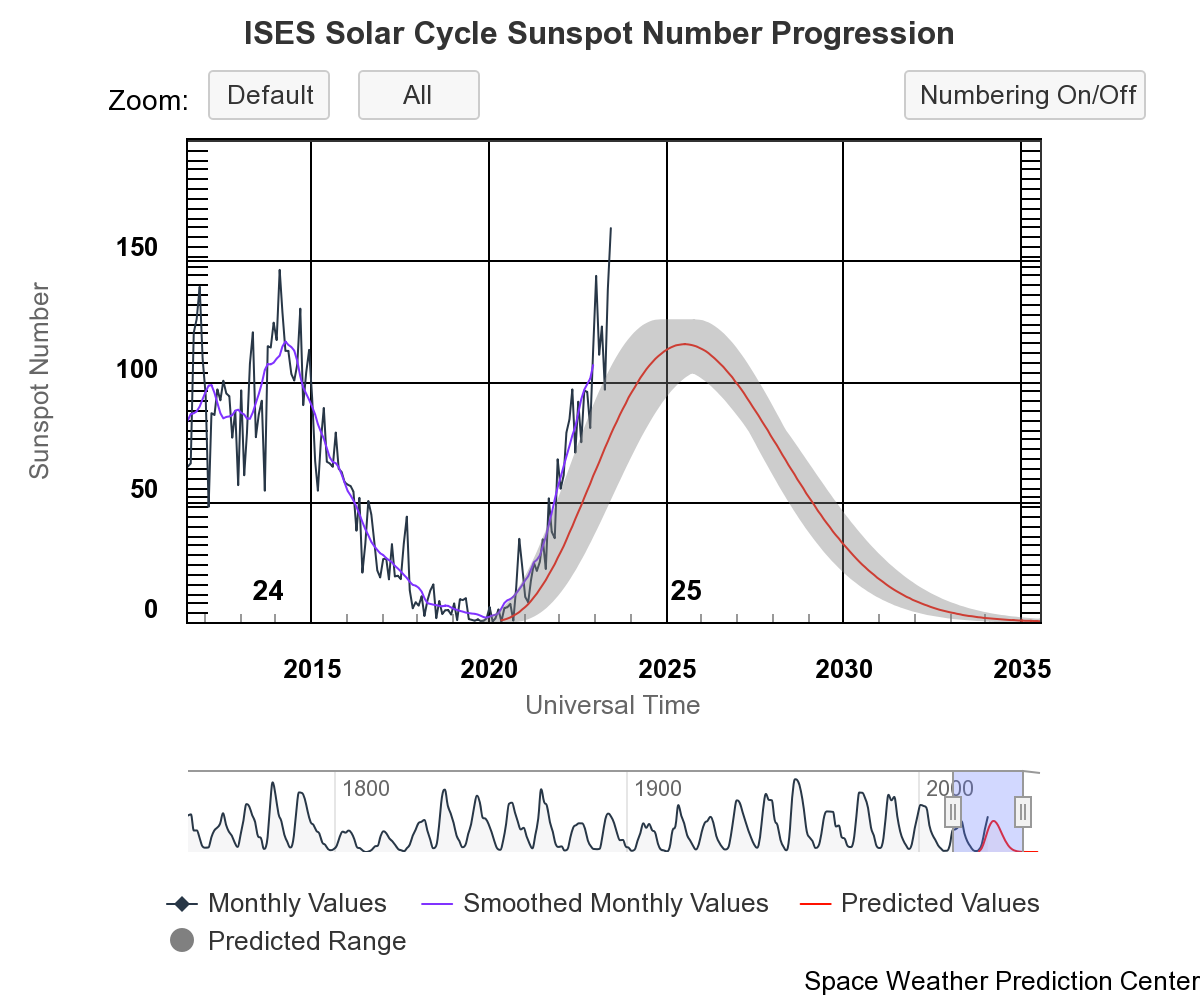
Sun Spot History (See:NOAA Page)
Trending
Critical Trends
| ACIS Temperatures - Daily Maximums | |||||||
|---|---|---|---|---|---|---|---|
| MSID | MEAN | RMS | DELTA/YR | DELTA/YR/YR | UNITS | DESCRIPTION | |
| 1pdeaat | -0.009 | 0.002 | (2.99+/-0.05)e2 | 3.07 +/- 1.28 | K | PSMC DEA PS A TEMP | |
| HRMA Computed Averages - Daily Maximums | |||||||
|---|---|---|---|---|---|---|---|
| MSID | MEAN | RMS | DELTA/YR | DELTA/YR/YR | UNITS | DESCRIPTION | |
| obaavg | -0.024 | 0.001 | (2.99+/-0.03)e2 | -0.59 +/- 0.68 | TEMP | OBA/TFTE | |
| EPHIN Temperatures - Daily Maximums | |||||||
|---|---|---|---|---|---|---|---|
| MSID | MEAN | RMS | DELTA/YR | DELTA/YR/YR | UNITS | DESCRIPTION | |
| teio | -6.598e-04 | 0.010 | (3.29+/-0.23)e2 | 0.10 +/- 3.84 | K | EPHIN ELECTRONICS HOUSING TEMP | |
| tephin | -0.039 | 0.003 | (3.39+/-0.08)e2 | 0.48 +/- 2.28 | K | EPHIN SENSOR HOUSING TEMP | |
| S/C Main Temperatures - Daily Maximums | |||||||
|---|---|---|---|---|---|---|---|
| MSID | MEAN | RMS | DELTA/YR | DELTA/YR/YR | UNITS | DESCRIPTION | |
| tcylfmzm | 0.020 | 0.005 | (3.13+/-0.12)e2 | 5.44 +/- 2.00 | K | CNT CYL TEMP:-Z SIDE UNDER LAE-1 | |
| tcylfmzp | 0.017 | 0.005 | (3.16+/-0.11)e2 | 5.53 +/- 1.89 | K | CNT CYL TEMP:-Z SIDE UNDER LAE-2 | |
| S/C Ancillary Temperatures - Daily Maximums | |||||||
|---|---|---|---|---|---|---|---|
| MSID | MEAN | RMS | DELTA/YR | DELTA/YR/YR | UNITS | DESCRIPTION | |
| tfssbkt1 | -0.016 | 0.012 | (3.50+/-0.29)e2 | 5.09 +/- 4.46 | K | FSS BRAC | |
| tfssbkt2 | -0.010 | 0.013 | (3.44+/-0.30)e2 | 4.34 +/- 4.49 | K | FSS BRAC | |
| tsctsf1 | -0.040 | 0.002 | (3.24+/-0.05)e2 | 2.90 +/- 1.39 | K | SC-TS FITTING -1 TEMP | |
| tsctsf6 | -0.041 | 0.002 | (3.24+/-0.05)e2 | 1.22 +/- 1.45 | K | SC-TS FITTING -6 TEMP | |
| MUPS - Daily Maximums | |||||||
|---|---|---|---|---|---|---|---|
| MSID | MEAN | RMS | DELTA/YR | DELTA/YR/YR | UNITS | DESCRIPTION | |
| pm1thv1t | -0.038 | 0.007 | (3.52+/-0.16)e2 | -2.64 +/- 2.99 | K | MUPS 1 THRUSTER VALVE 01 TEMP | |
| pm2thv1t | -0.074 | 0.021 | (3.19+/-0.50)e2 | -5.43 +/- 8.54 | K | MUPS 2 THRUSTER VALVE 01 TEMP | |
| pm1thv2t | -0.046 | 0.007 | (3.54+/-0.16)e2 | -3.56 +/- 3.17 | K | MUPS 1 THRUSTER VALVE 02 TEMP | |
| pm2thv2t | -0.116 | 0.023 | (3.18+/-0.54)e2 | -7.43 +/- 8.98 | K | MUPS 2 THRUSTER VALVE 02 TEMP | |
| pline02t | -0.029 | 0.006 | (3.36+/-0.13)e2 | -1.57 +/- 2.72 | K | PROP LINE TEMP 02 | |
| pline03t | -0.017 | 0.006 | (3.29+/-0.14)e2 | -0.90 +/- 2.44 | K | PROP LINE TEMP 03 | |
| pline04t | -0.023 | 0.005 | (3.18+/-0.12)e2 | -1.84 +/- 2.50 | K | PROP LINE TEMP 04 | |
Quarterly Trends
- HRMA Struts
| Previous Quarter | |||||||
| MSID | MEAN | RMS | DELTA/YR | DELTA/YR/YR | UNITS | DESCRIPTION | |
| 4rt584t | -0.019 | 8.719e-04 | (3.03+/-0.02)e2 | -0.61 +/- 0.45 | K | RT 584 - STRUT TEMP | |
|---|---|---|---|---|---|---|---|
| 4rt585t | -0.019 | 8.737e-04 | (3.03+/-0.02)e2 | -0.63 +/- 0.45 | K | RT 585 - STRUT TEMP | |
| 4rt586t | -0.017 | 7.844e-04 | (2.98+/-0.02)e2 | -0.66 +/- 0.37 | K | RT 586 - STRUT TEMP | |
| 4rt587t | -0.015 | 6.785e-04 | (2.92+/-0.02)e2 | -0.41 +/- 0.28 | K | RT 587 - STRUT TEMP | |
| 4rt597t | -0.025 | 0.002 | (3.11+/-0.04)e2 | -0.18 +/- 0.91 | K | RT 597 - TFTE TEMP | |
| 4rt598t | -0.024 | 0.002 | (3.10+/-0.04)e2 | -0.32 +/- 0.90 | K | RT 598 - TFTE TEMP | |
- OB Forward Bulkhead
| Previous Quarter | |||||||
| MSID | MEAN | RMS | DELTA/YR | DELTA/YR/YR | UNITS | DESCRIPTION | |
| 4rt705t | -0.022 | 0.001 | (2.93+/-0.03)e2 | -0.65 +/- 0.56 | K | RT 705 - OB BUL | |
|---|---|---|---|---|---|---|---|
| 4rt706t | -0.022 | 0.001 | (2.92+/-0.03)e2 | -0.56 +/- 0.57 | K | RT 706 - OB BUL | |
| 4rt707t | -0.023 | 0.001 | (2.95+/-0.03)e2 | -0.46 +/- 0.56 | K | RT 707 - OB BULKHEAD TEMP | |
| 4rt708t | -0.023 | 0.001 | (3.00+/-0.03)e2 | -0.53 +/- 0.61 | K | RT 708 - OB BULKHEAD TEMP | |
| 4rt709t | -0.025 | 0.001 | (3.02+/-0.03)e2 | -0.48 +/- 0.66 | K | RT 709 - OB BULKHEAD TEMP | |
| 4rt710t | -0.026 | 0.001 | (3.03+/-0.03)e2 | -0.55 +/- 0.70 | K | RT 710 - OB BULKHEAD TEMP | |
- HRMA Thermal
- HRMA Thermal
| Previous Quarter | |||||||
| MSID | MEAN | RMS | DELTA/YR | DELTA/YR/YR | UNITS | DESCRIPTION | |
| 4rt568t | -0.021 | 0.001 | (3.01+/-0.03)e2 | -0.66 +/- 0.60 | K | RT 568 - HRMA TEMP | |
|---|---|---|---|---|---|---|---|
| 4rt569t | -0.010 | 3.715e-04 | (2.97+/-0.01)e2 | -0.35 +/- 0.14 | K | RT 569 - HRMA TEMP | |
| 4rt570t | -0.006 | 2.189e-04 | (2.96+/-0.01)e2 | -0.25 +/- 0.07 | K | RT 570 - HRMA TEMP | |
| 4rt575t | -0.024 | 0.001 | (3.06+/-0.03)e2 | -0.83 +/- 0.75 | K | RT 575 - OB CONE TEMP | |
| 4rt576t | -0.022 | 0.001 | (2.96+/-0.03)e2 | -1.09 +/- 0.60 | K | RT 576 - OB CONE TEMP | |
| 4rt578t | -0.026 | 0.002 | (3.04+/-0.04)e2 | -1.23 +/- 0.96 | K | RT 578 - OB CONE TEMP | |
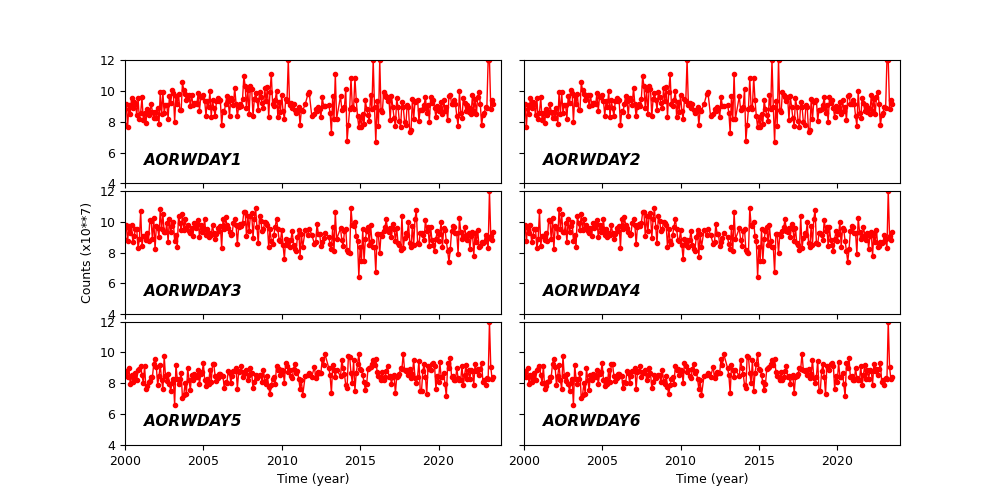
Spacecraft Motions
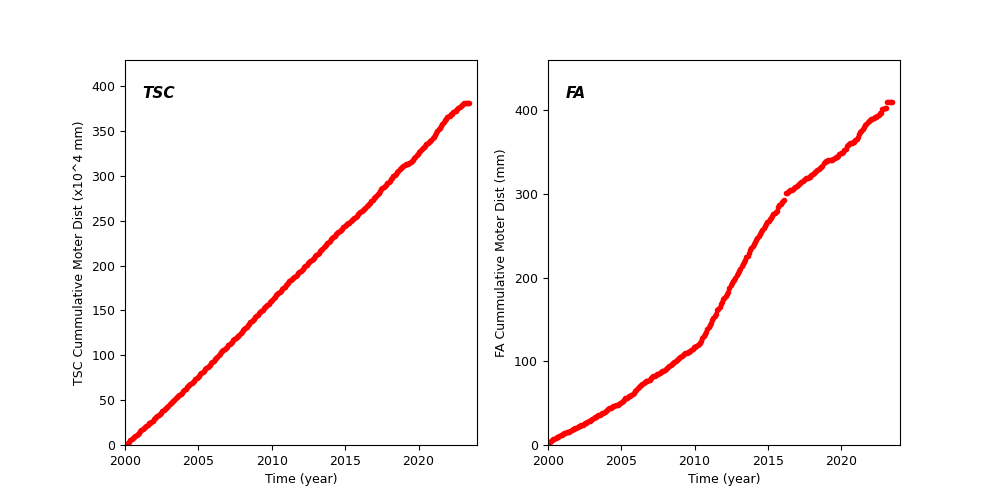
TSC and FA Cummulative Moter Distance
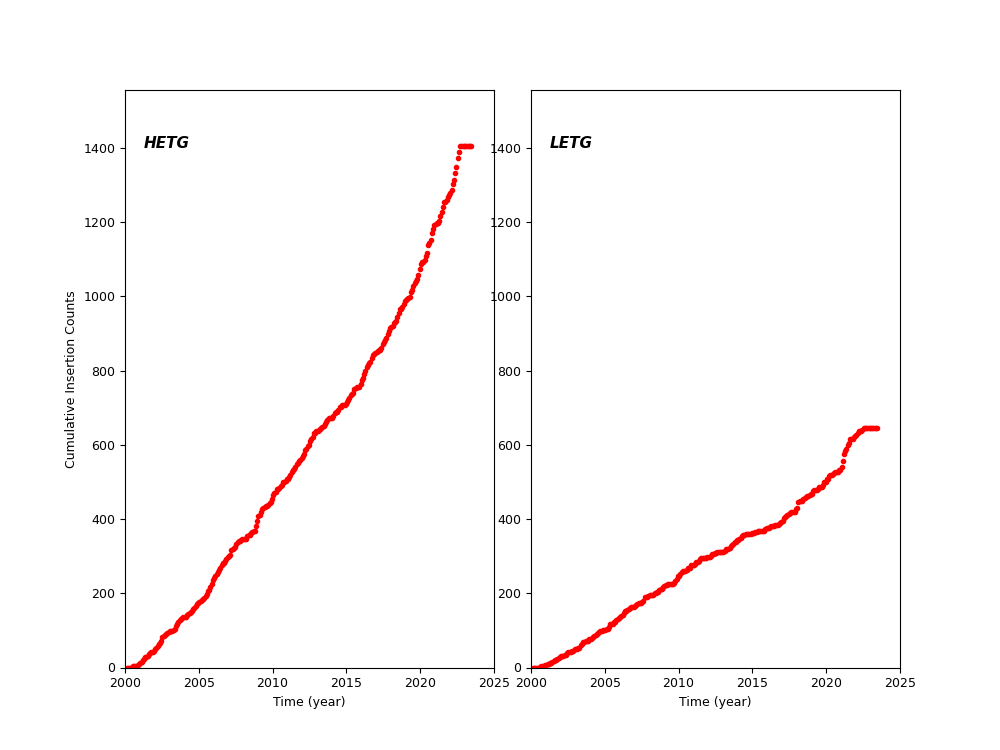
HETG and LETG Cummulative Insertion Counts
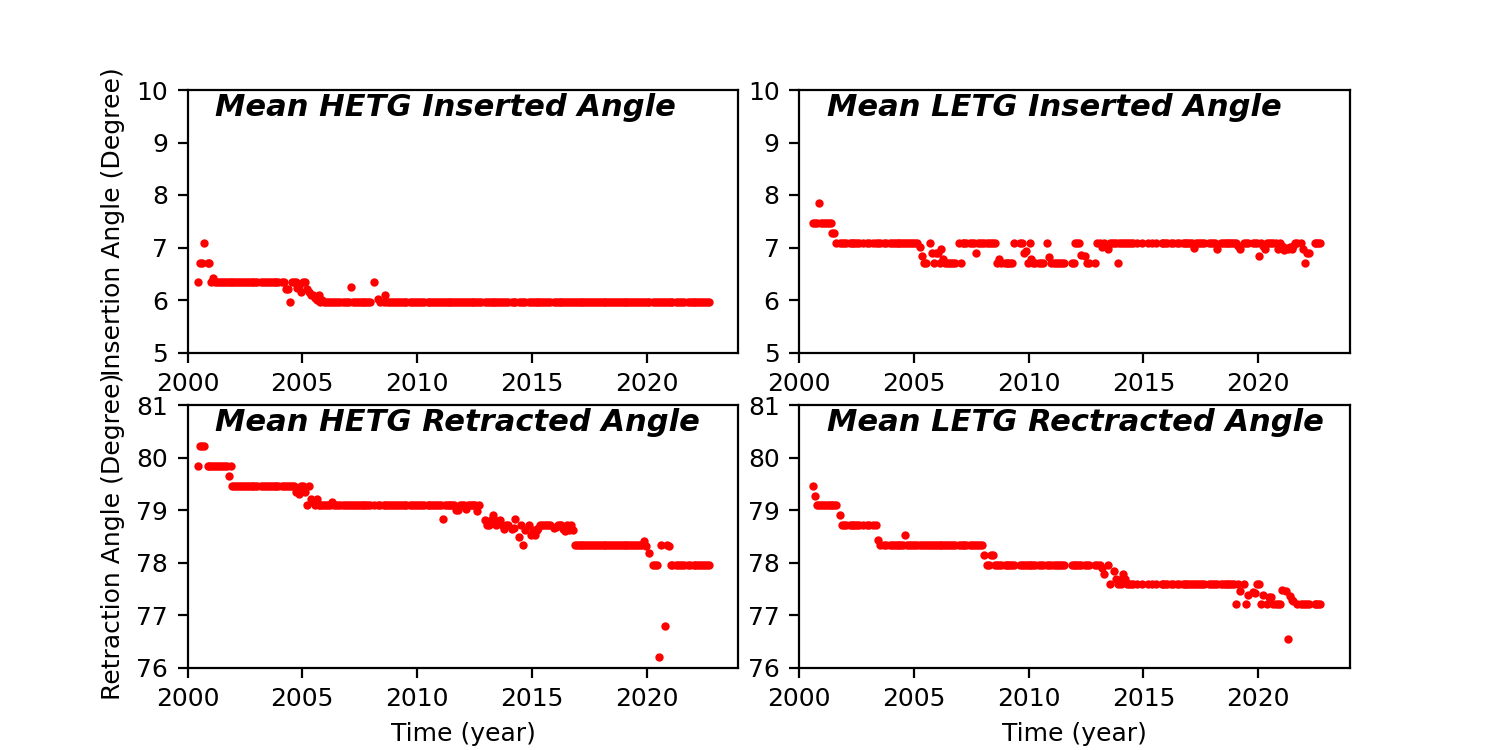
HETG/LETG Insertion/Retraction Angle
Reaction Wheel Rotations