ACIS
ACIS DOSE Registered-Photon-Map
The steps we took to compute the dose map are;
- Level 1 Event files for a specified month are obtained from archive.
- Image data including I2, I3, S2, S3 CCDs are extracted from all event files.
- All the extracted image data were merged to create a month long exposure map for the month.
- The exposure map is opened with ds9, and check a distribution of count rates against energy. From this, estimate the upper threshold value. Any events beyond this upper threshold are assumed erroneous events such as bad pixels.
- Using this upper threshold, the data is filtered, and create a cleaned exposure map for the month.
- The exposure map from each month from the Sep 1999 is added up to create a cumulative exposure map for each month.
- Using fimgstatistic, we compute count rate statistics for each CCDs.
- For observations with high data drop rates (e.g., Crab nebula, Cas A), we corrected the observations by adding events.
Please check more detail plots at Telemetered Photon Dose Trend page.
)
)
)
Statistics:
# IMAGE     NPIX     MEAN        RMS        MIN     MAX
ACIS_aug23 6004901       4.434         6.538           0.0     2830


I2 node 0  262654	3.749522	2.223430	0.0	 62.0
I2 node 1  262654	4.702715	4.298190	0.0	1710.0
I2 node 2  262654	4.850676	2.675494	0.0	 84.0
I2 node 3  262654	4.133181	2.479744	0.0	224.0

I3 node 0  262654	4.823937	2.604923	0.0	 72.0
I3 node 1  262654	5.584221	3.841546	0.0	1322.0
I3 node 2  262654	5.190872	2.691581	0.0	 50.0
I3 node 3  262654	4.449291	2.409588	0.0	 88.0

S2 node 0  262654	5.148886	6.759298	0.0	2392.0
S2 node 1  262654	6.147078	4.724283	0.0	417.0
S2 node 2  262654	6.852535	9.364177	0.0	2235.0
S2 node 3  262654	6.278502	8.632418	0.0	2830.0

S3 node 0  262654	8.757774	11.530947	0.0	399.0
S3 node 1  262654	9.758765	7.706448	0.0	911.0
S3 node 2  262654	8.980947	5.568075	0.0	143.0
S3 node 3  262654	6.807975	3.280773	0.0	148.0
)
)
)
Statistics:
 IMAGE     NPIX      MEAN        RMS           MIN      MAX
ACIS_total   6004901       2652.534         3378.609           0.0   152478


I2 node 0  262654	2304.364363	466.328684	492.0	14543.0
I2 node 1  262654	2427.791989	674.214203	504.0	150472.0
I2 node 2  262654	2456.302589	520.381649	529.0	15563.0
I2 node 3  262654	2460.794090	636.750603	492.0	32203.0

I3 node 0  262654	2647.909747	651.940801	494.0	14387.0
I3 node 1  262654	2730.399534	1747.709610	516.0	55953.0
I3 node 2  262654	2441.423501	456.427225	489.0	14729.0
I3 node 3  262654	2421.355408	491.238848	458.0	35484.0

S2 node 0  262654	3091.816008	501.921703	1676.0	22508.0
S2 node 1  262654	3280.034376	746.393956	1857.0	17681.0
S2 node 2  262654	3630.903477	747.957458	2269.0	31916.0
S2 node 3  262654	3593.598262	604.723870	2001.0	78608.0

S3 node 0  262654	5487.764890	2980.828056	2410.0	54763.0
S3 node 1  262654	6704.039959	2383.838034	0.0	64981.0
S3 node 2  262654	5432.200421	1363.908904	2520.0	27444.0
S3 node 3  262654	4251.858956	765.412482	2574.0	26595.0
)
|
)
|
)
|
)
|
| May 2023 | Feb 2023 | Nov 2022 | Aug 2022 |
|---|
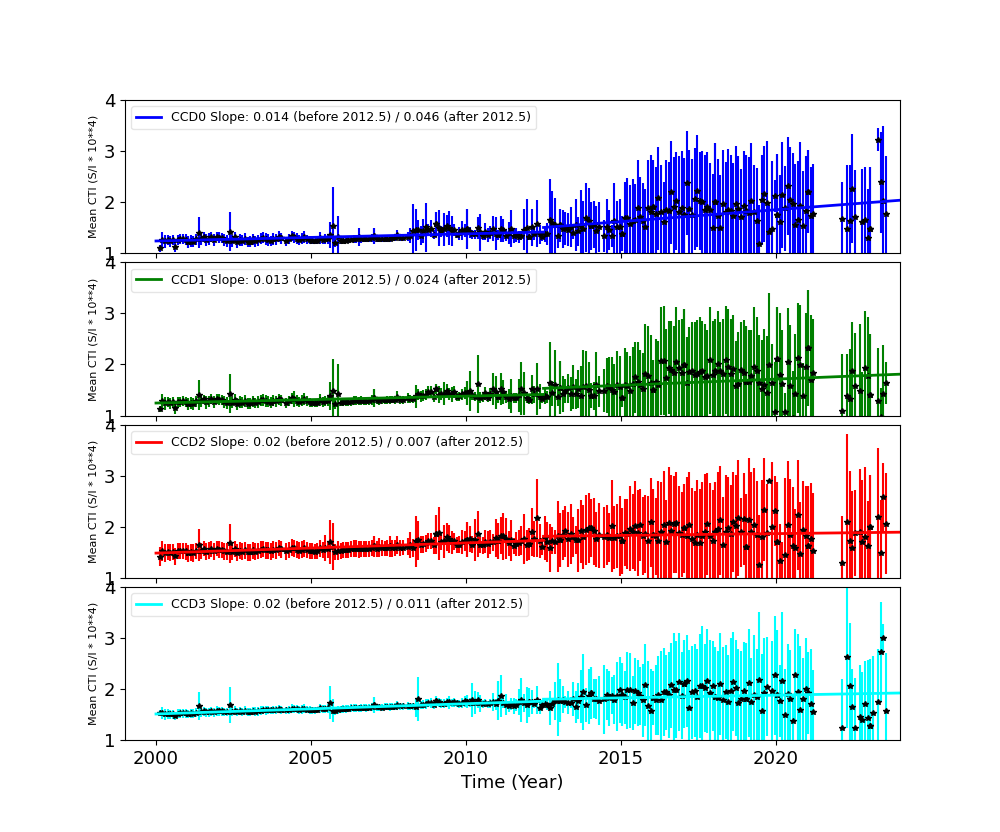
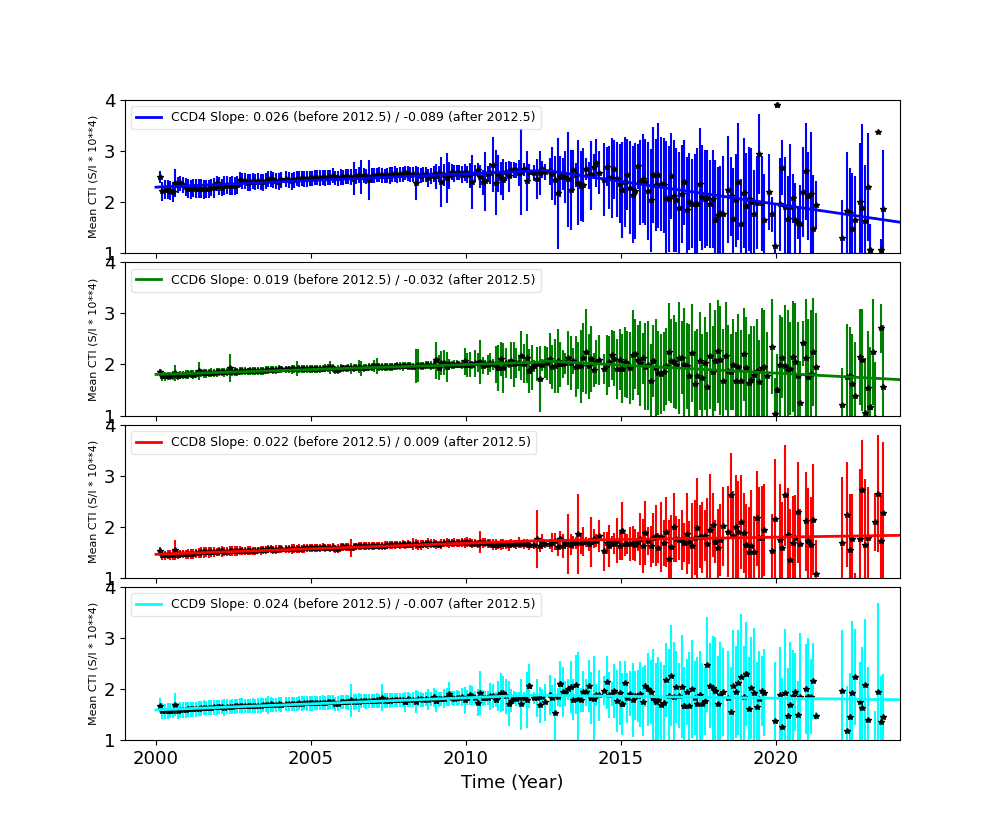
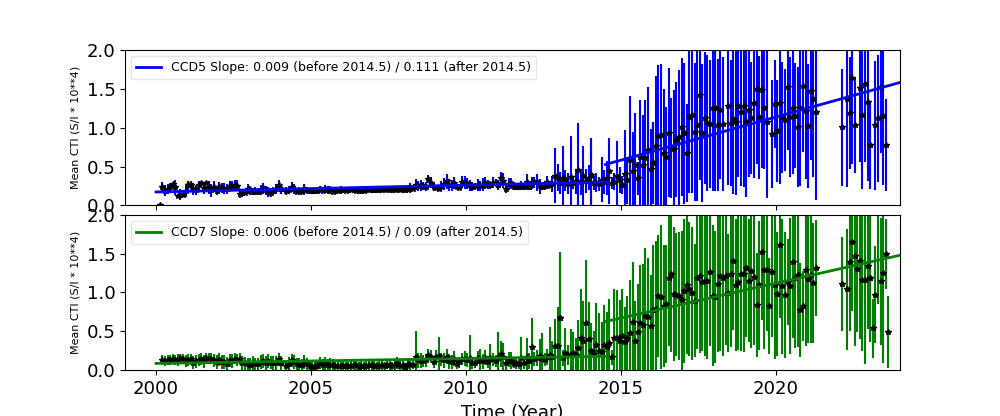
The Mean Detrended CTI
We report CTIs with a refined data definition. CTIs were computed for the temperature dependency corrected data. Please see CTI page for detailed explanation. CTI's are computed for Mn K alpha, and defined as slope/intercept x10^4 of row # vs ADU. Data file: here
Imaging CCDs
Spectral CCDs
Backside CCDs
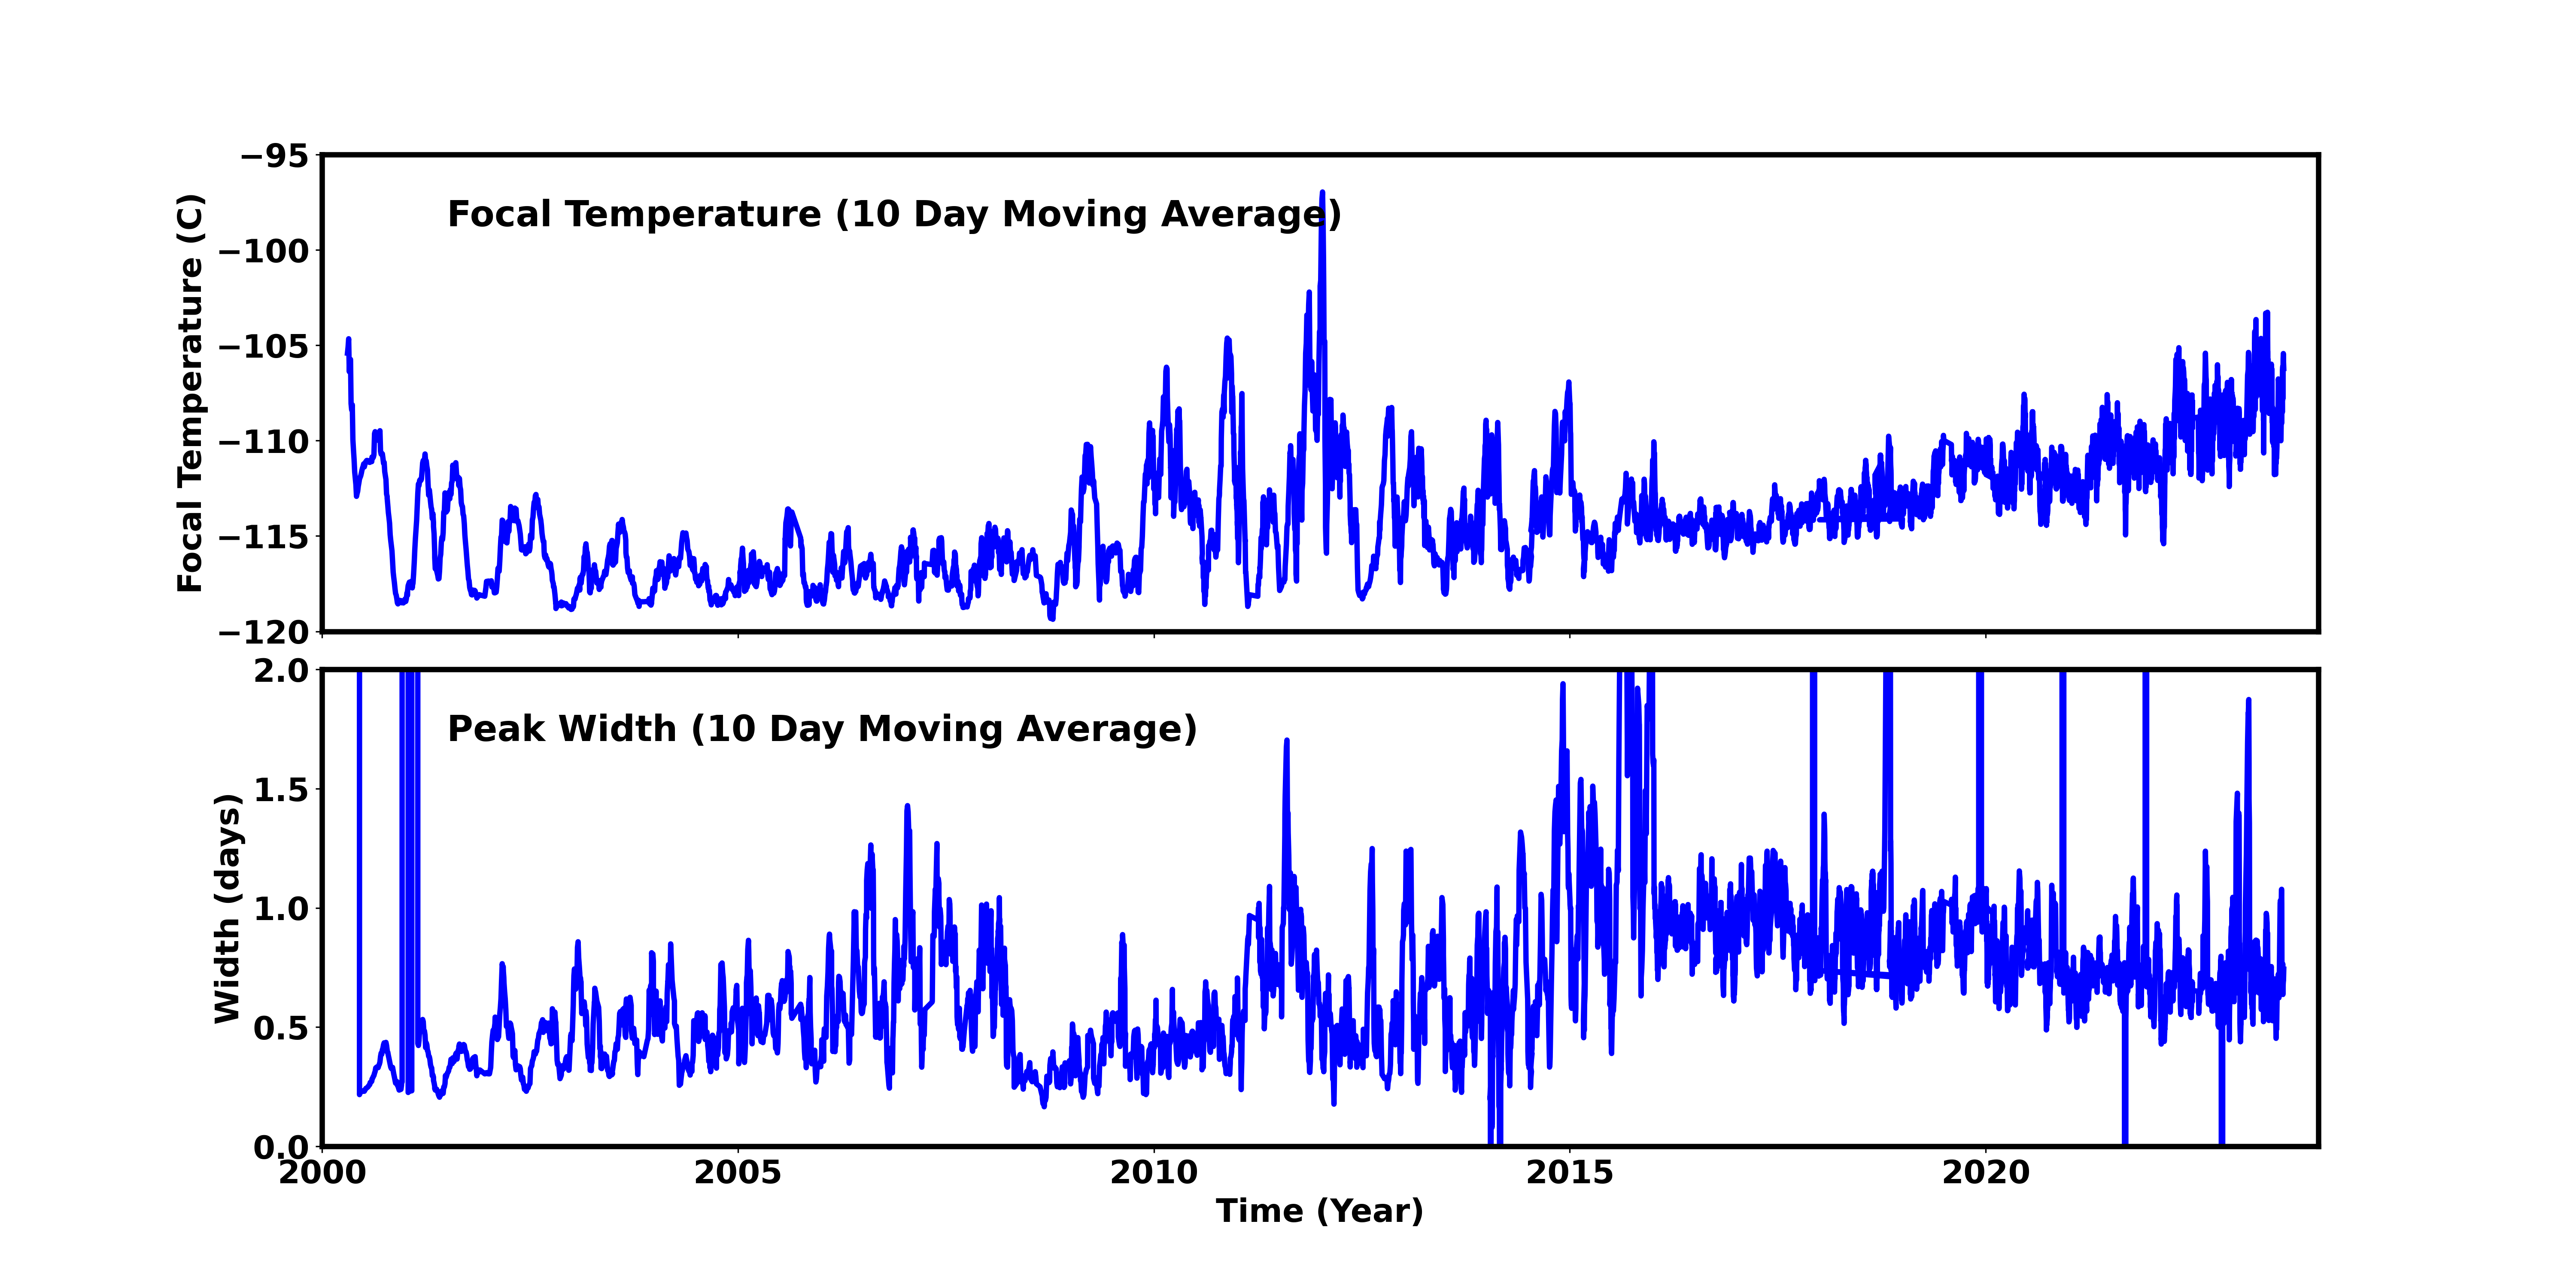
Focal Plane Temperature
Aug 2023 Focal Temperature
| The Mean (max) FPT: | |
|---|---|
| -107.53 | +/- 7.69 C |
| Mean Width: | |
| 0.8 | +/- 0.58 days |
Averaged Focal Plane Temperature
We are using 10 period moving averages to show trends of peak temperatures and peak widths. Note, the gaps in the width plot are due to missing/corrupted data.
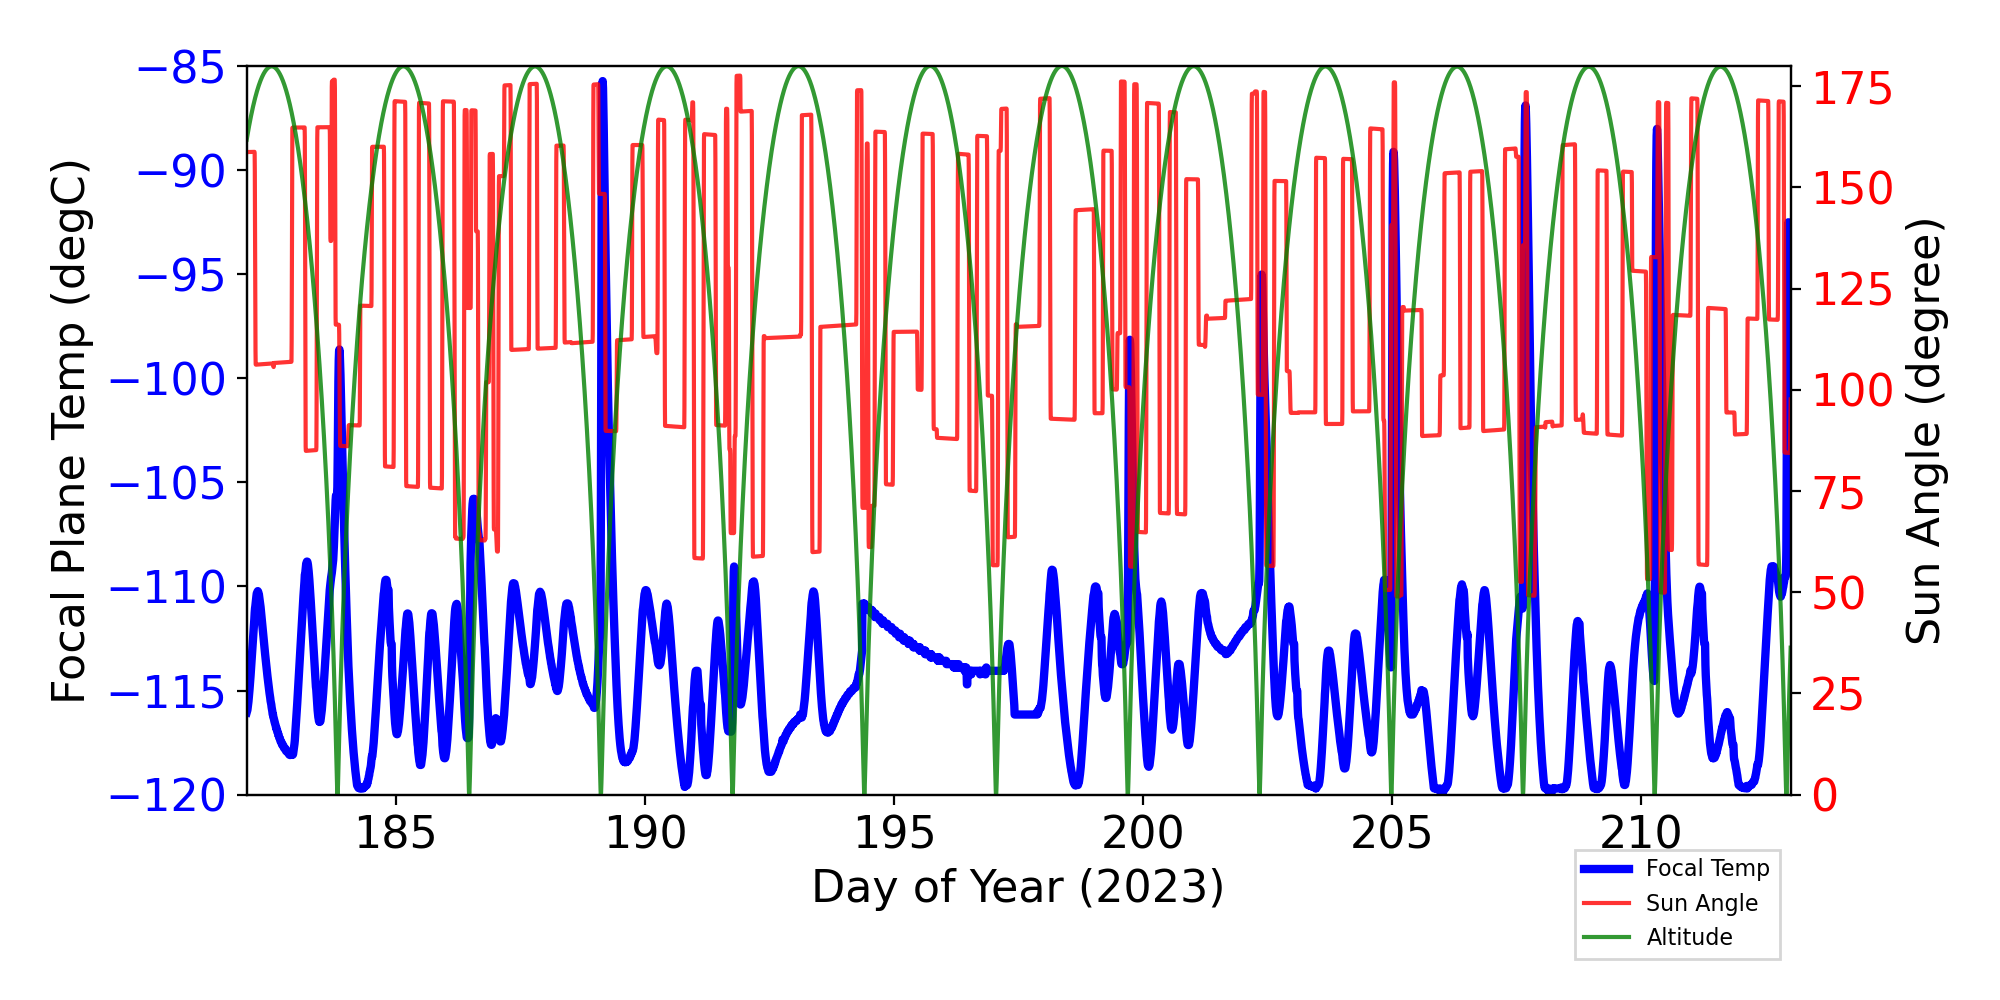
Focal Plane Temperature, Sun Angle and Altitude
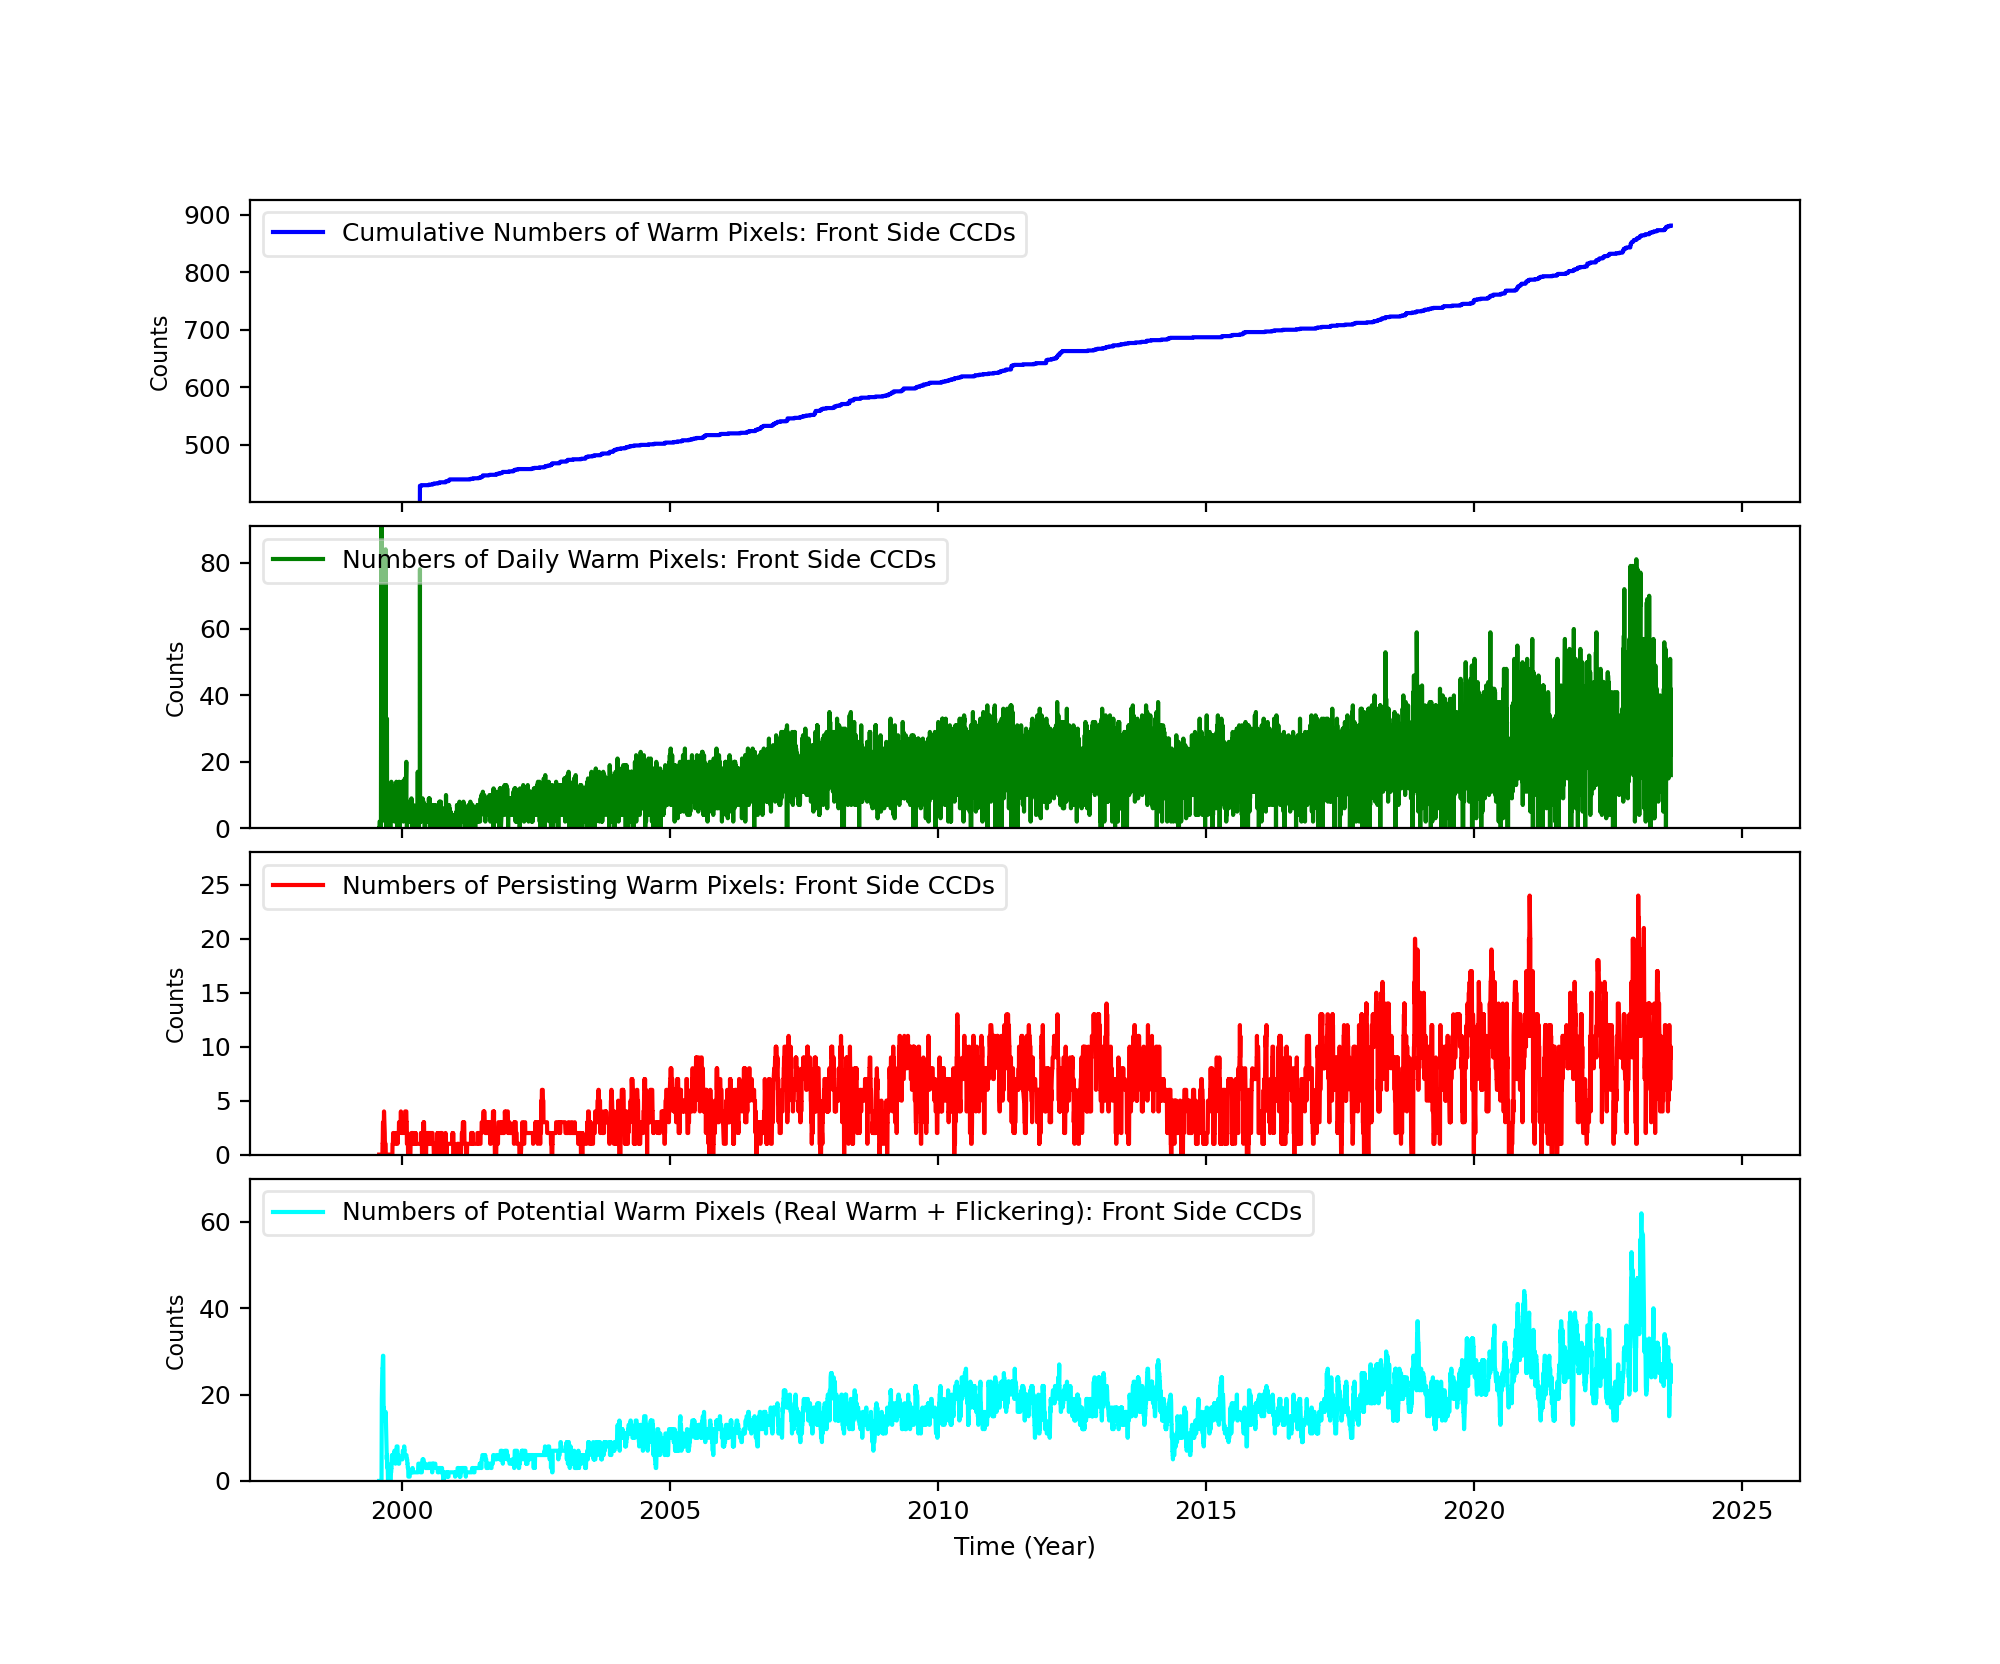
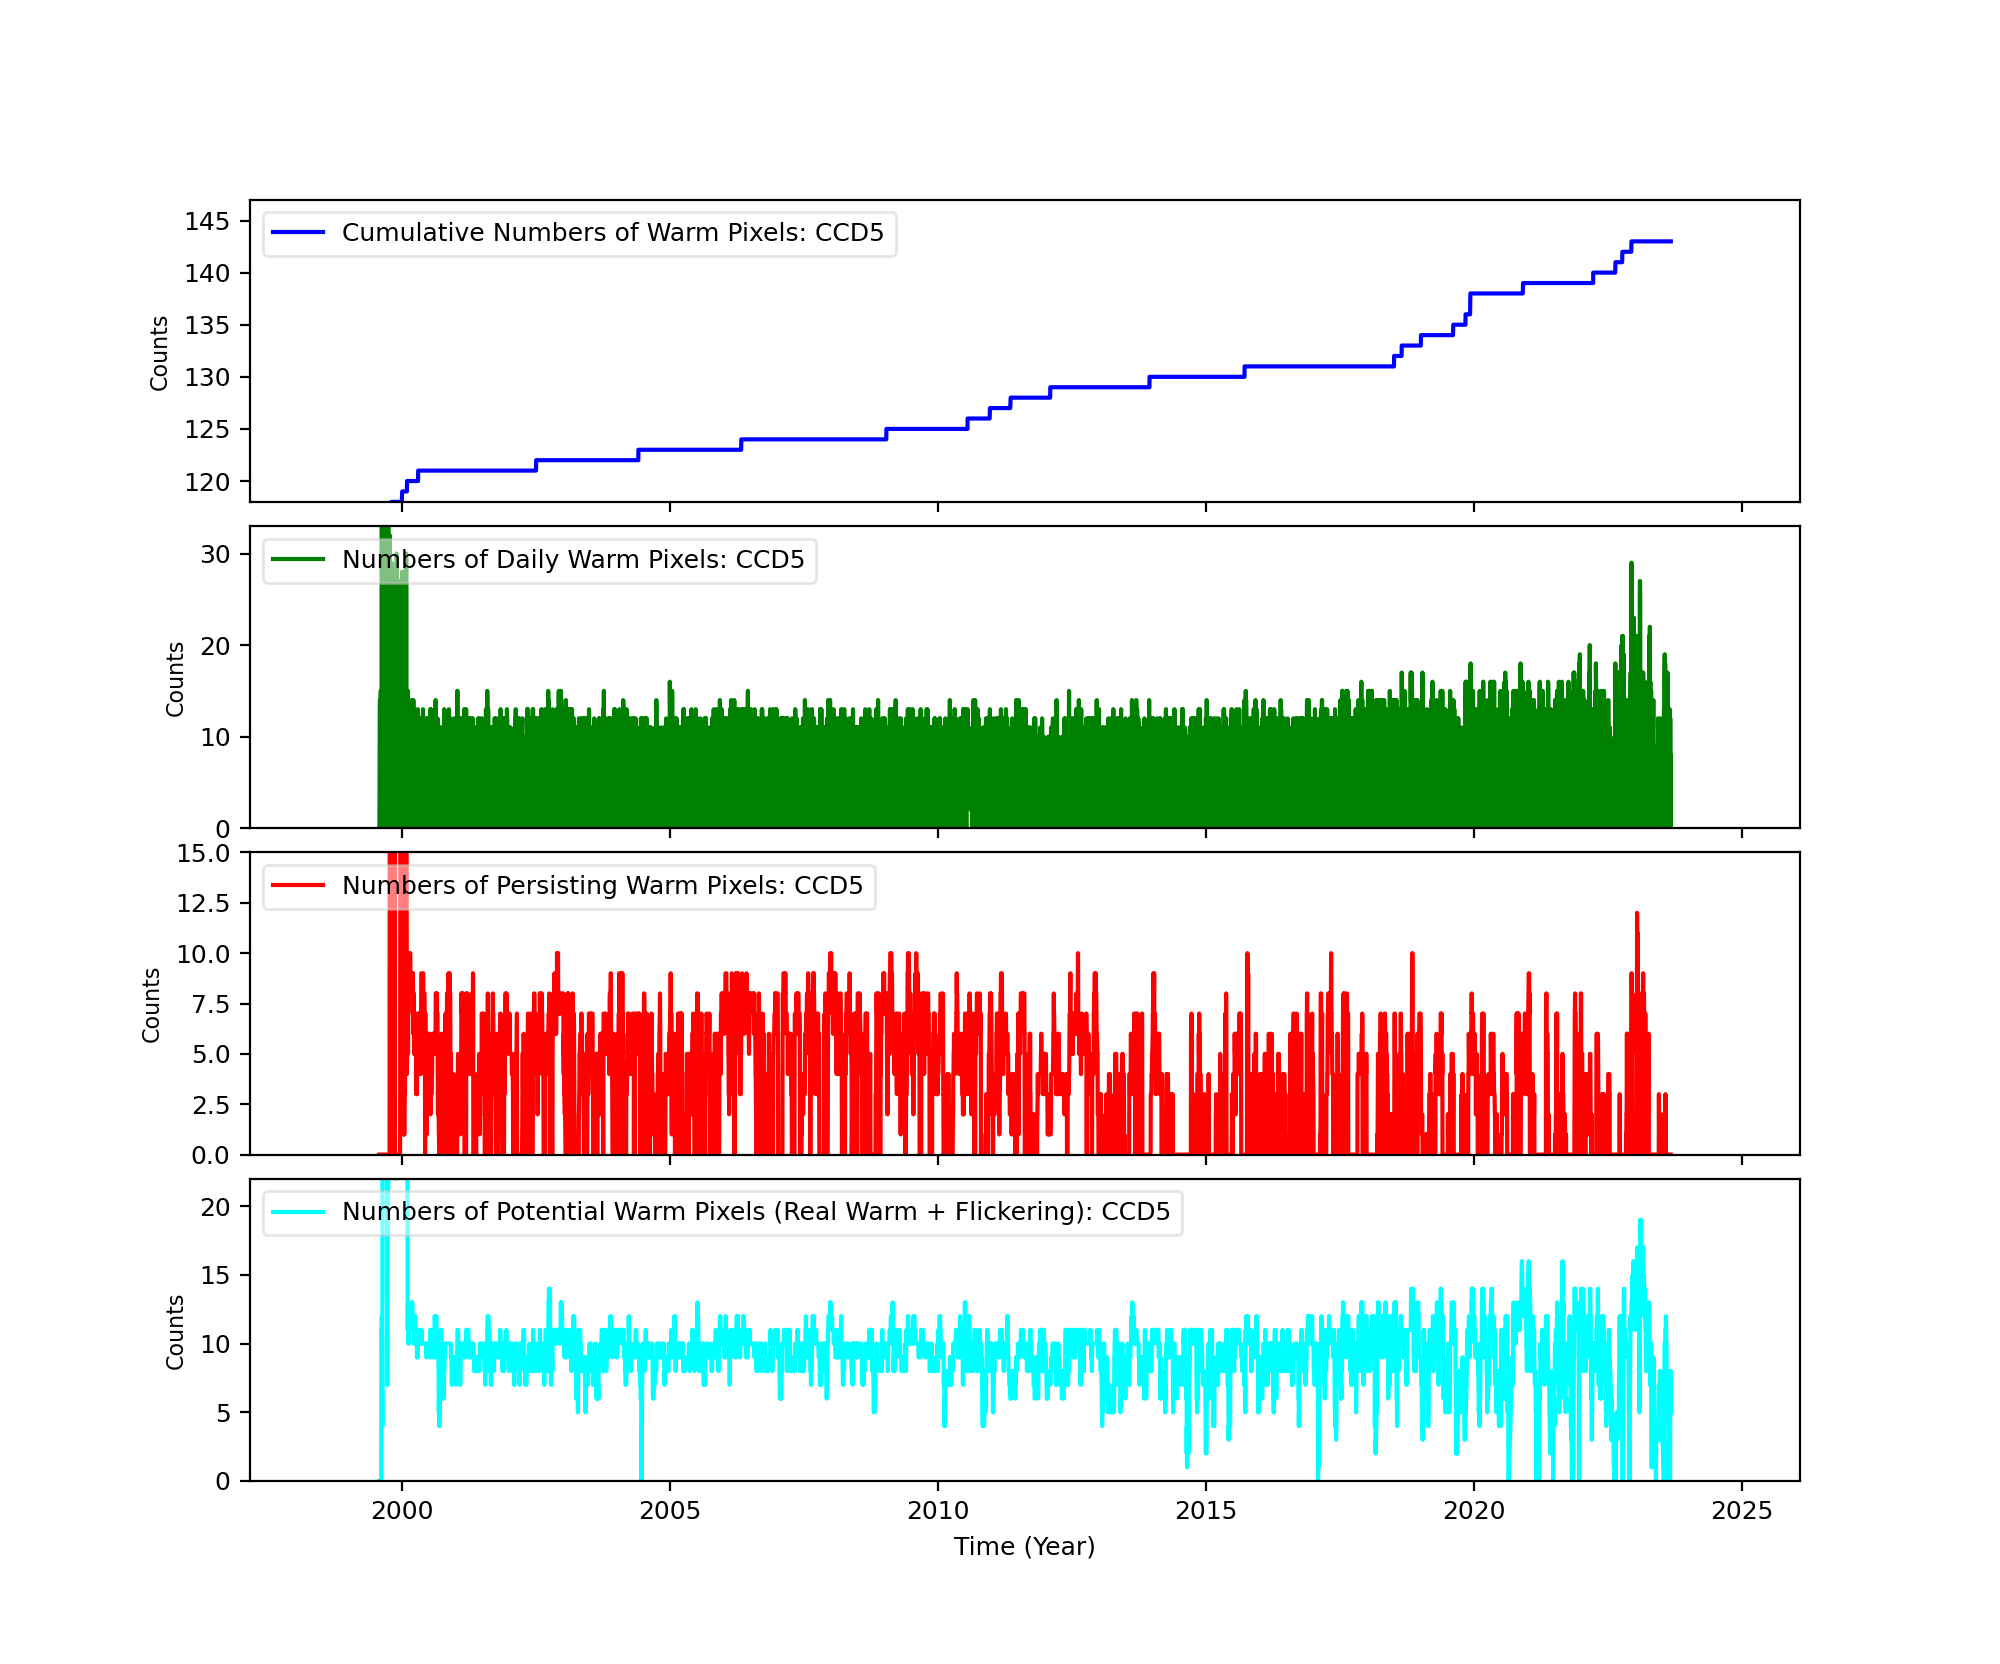
Bad Pixels
The plots below were generated with a new warm pixel finding script. Please see Acis Bad Pixel Page for details.
Front Side CCDs
Back Side CCD (CCD5)
Science Instrument Background Rates
| Name | Low (keV) | High(KeV) | Description |
|---|---|---|---|
| SSoft | 0.00 | 0.50 | Super soft photons |
| Soft | 0.50 | 1.00 | Soft photons |
| Med | 1.00 | 3.00 | Moderate energy photons |
| Hard | 3.00 | 5.00 | Hard Photons |
| Harder | 5.00 | 10.00 | Very Hard photons |
| Hardest | 10.00 | Beyond 10 keV |


HRC
DOSE of Central 4K Pore-Pairs
Please refer to Maximum Dose Trends for more details.
)
|
|---|
IMAGE                NPIX      MEAN    STDDEV      MIN       MAX
HRCI_08_2023.fits  16777216	0.080 	0.307 	0.000 	8.000
)
IMAGE                       NPIX      MEAN    STDDEV      MIN       MAX
HRCI_08_1999_08_2023.fits  16777216	na	na	na	na
)
|
|---|
IMAGE                NPIX      MEAN    STDDEV      MIN       MAX
HRCS_08_2023.fits  16777216	0.013 	0.115 	0.000 	4.000
)
IMAGE                       NPIX      MEAN    STDDEV      MIN       MAX
HRCS_08_1999_08_2023.fits  16777216	na	na	na	na
|
|
Max dose trend plots corrected for events that "pile-up"
in the center of the taps due to bad position information.
|
)
|
)
|
)
|
)
|
| May 2023 | Feb 2023 | Nov 2022 | Aug 2022 |
|---|
)
|
)
|
)
|
)
|
| May 2023 | Feb 2023 | Nov 2022 | Aug 2022 |
|---|
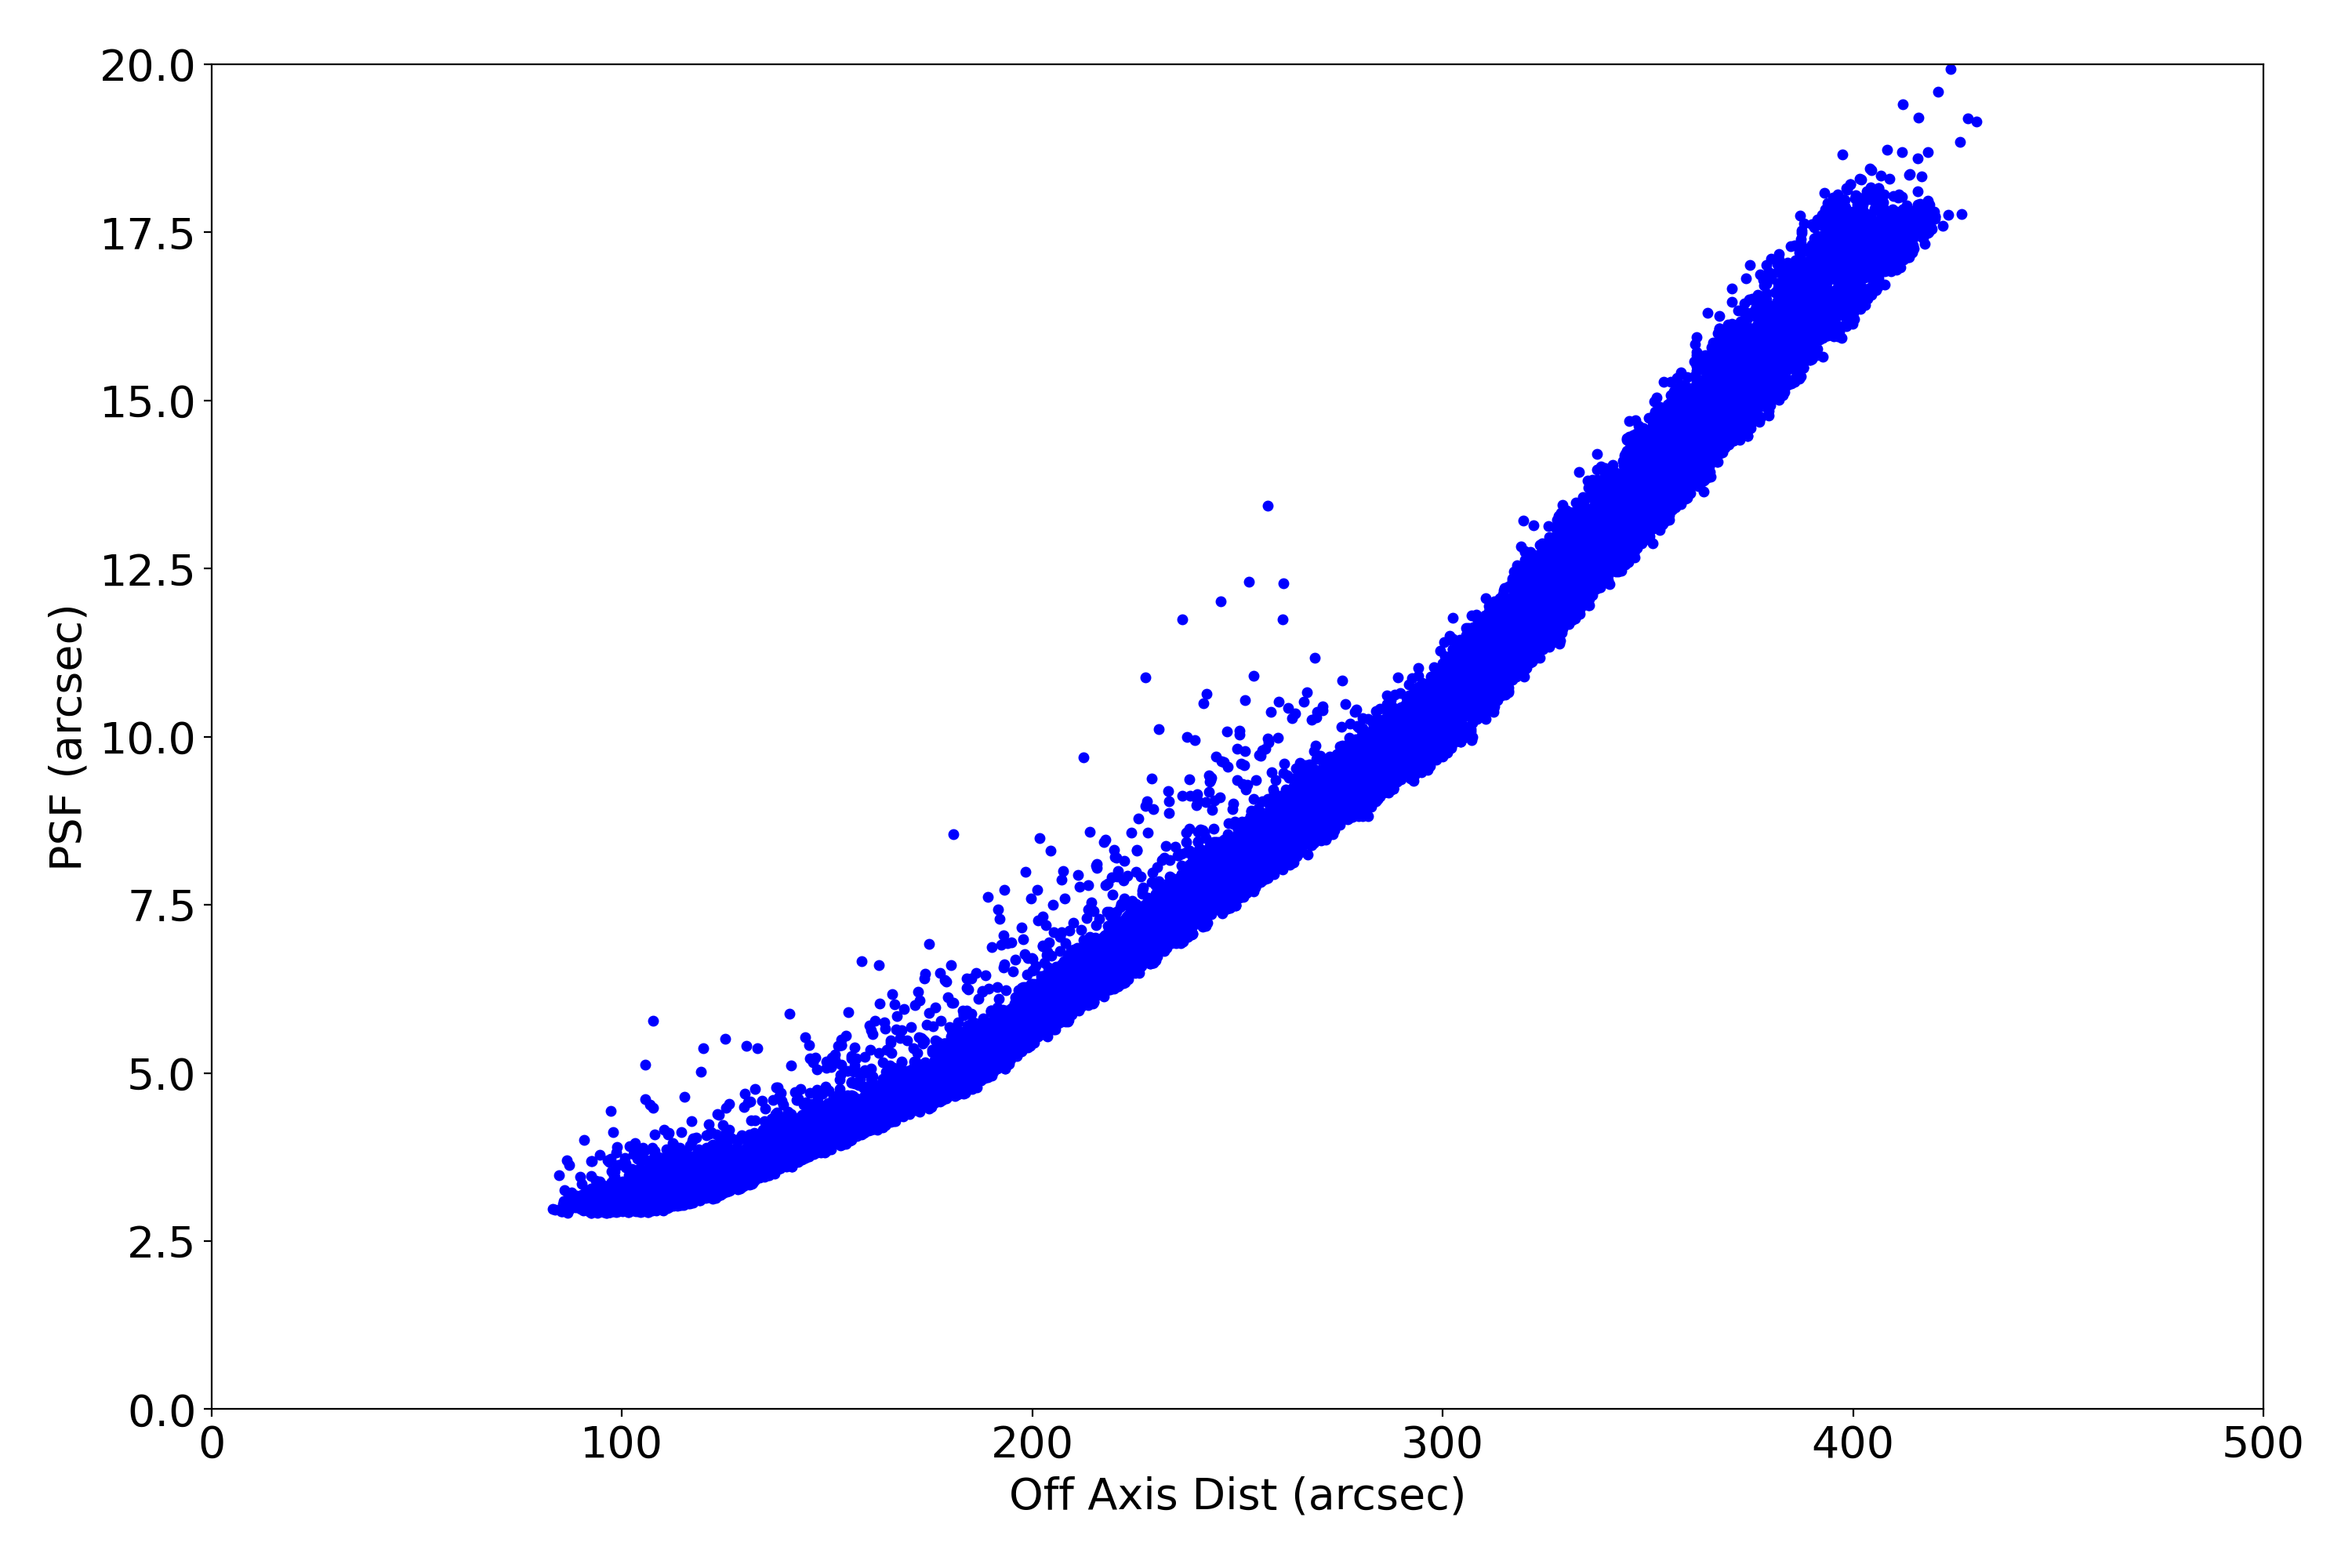
HRMA Focus
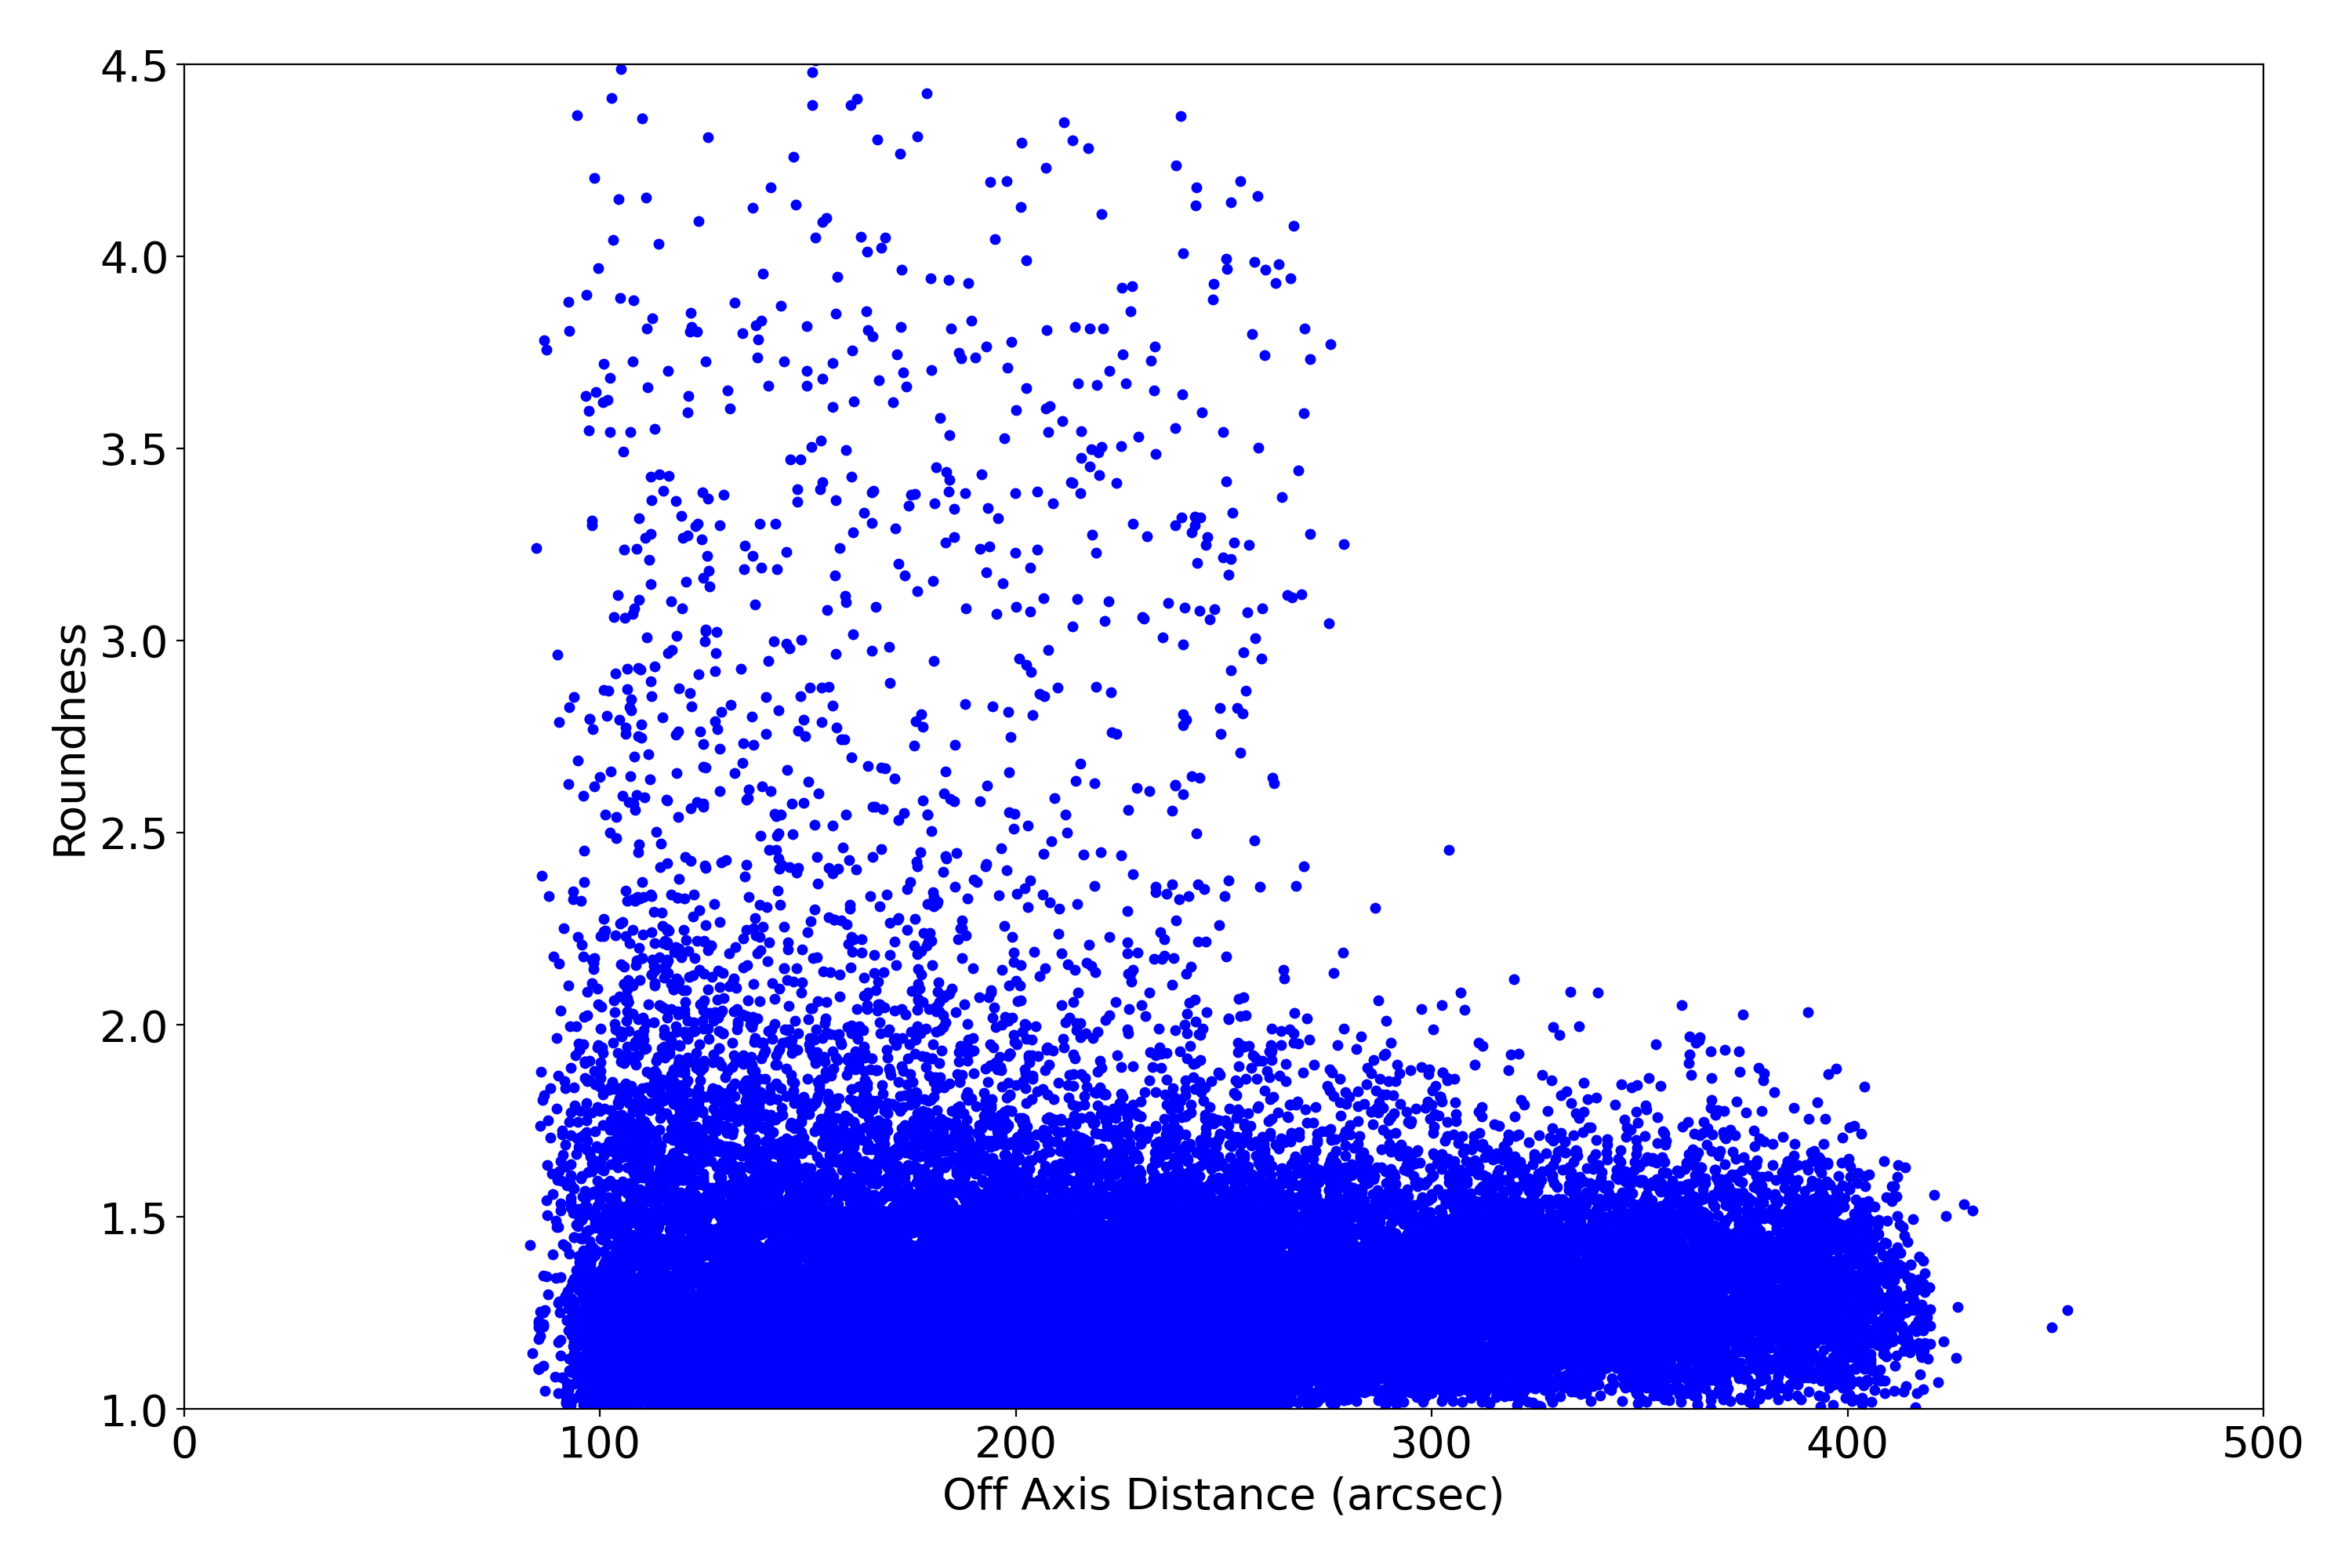
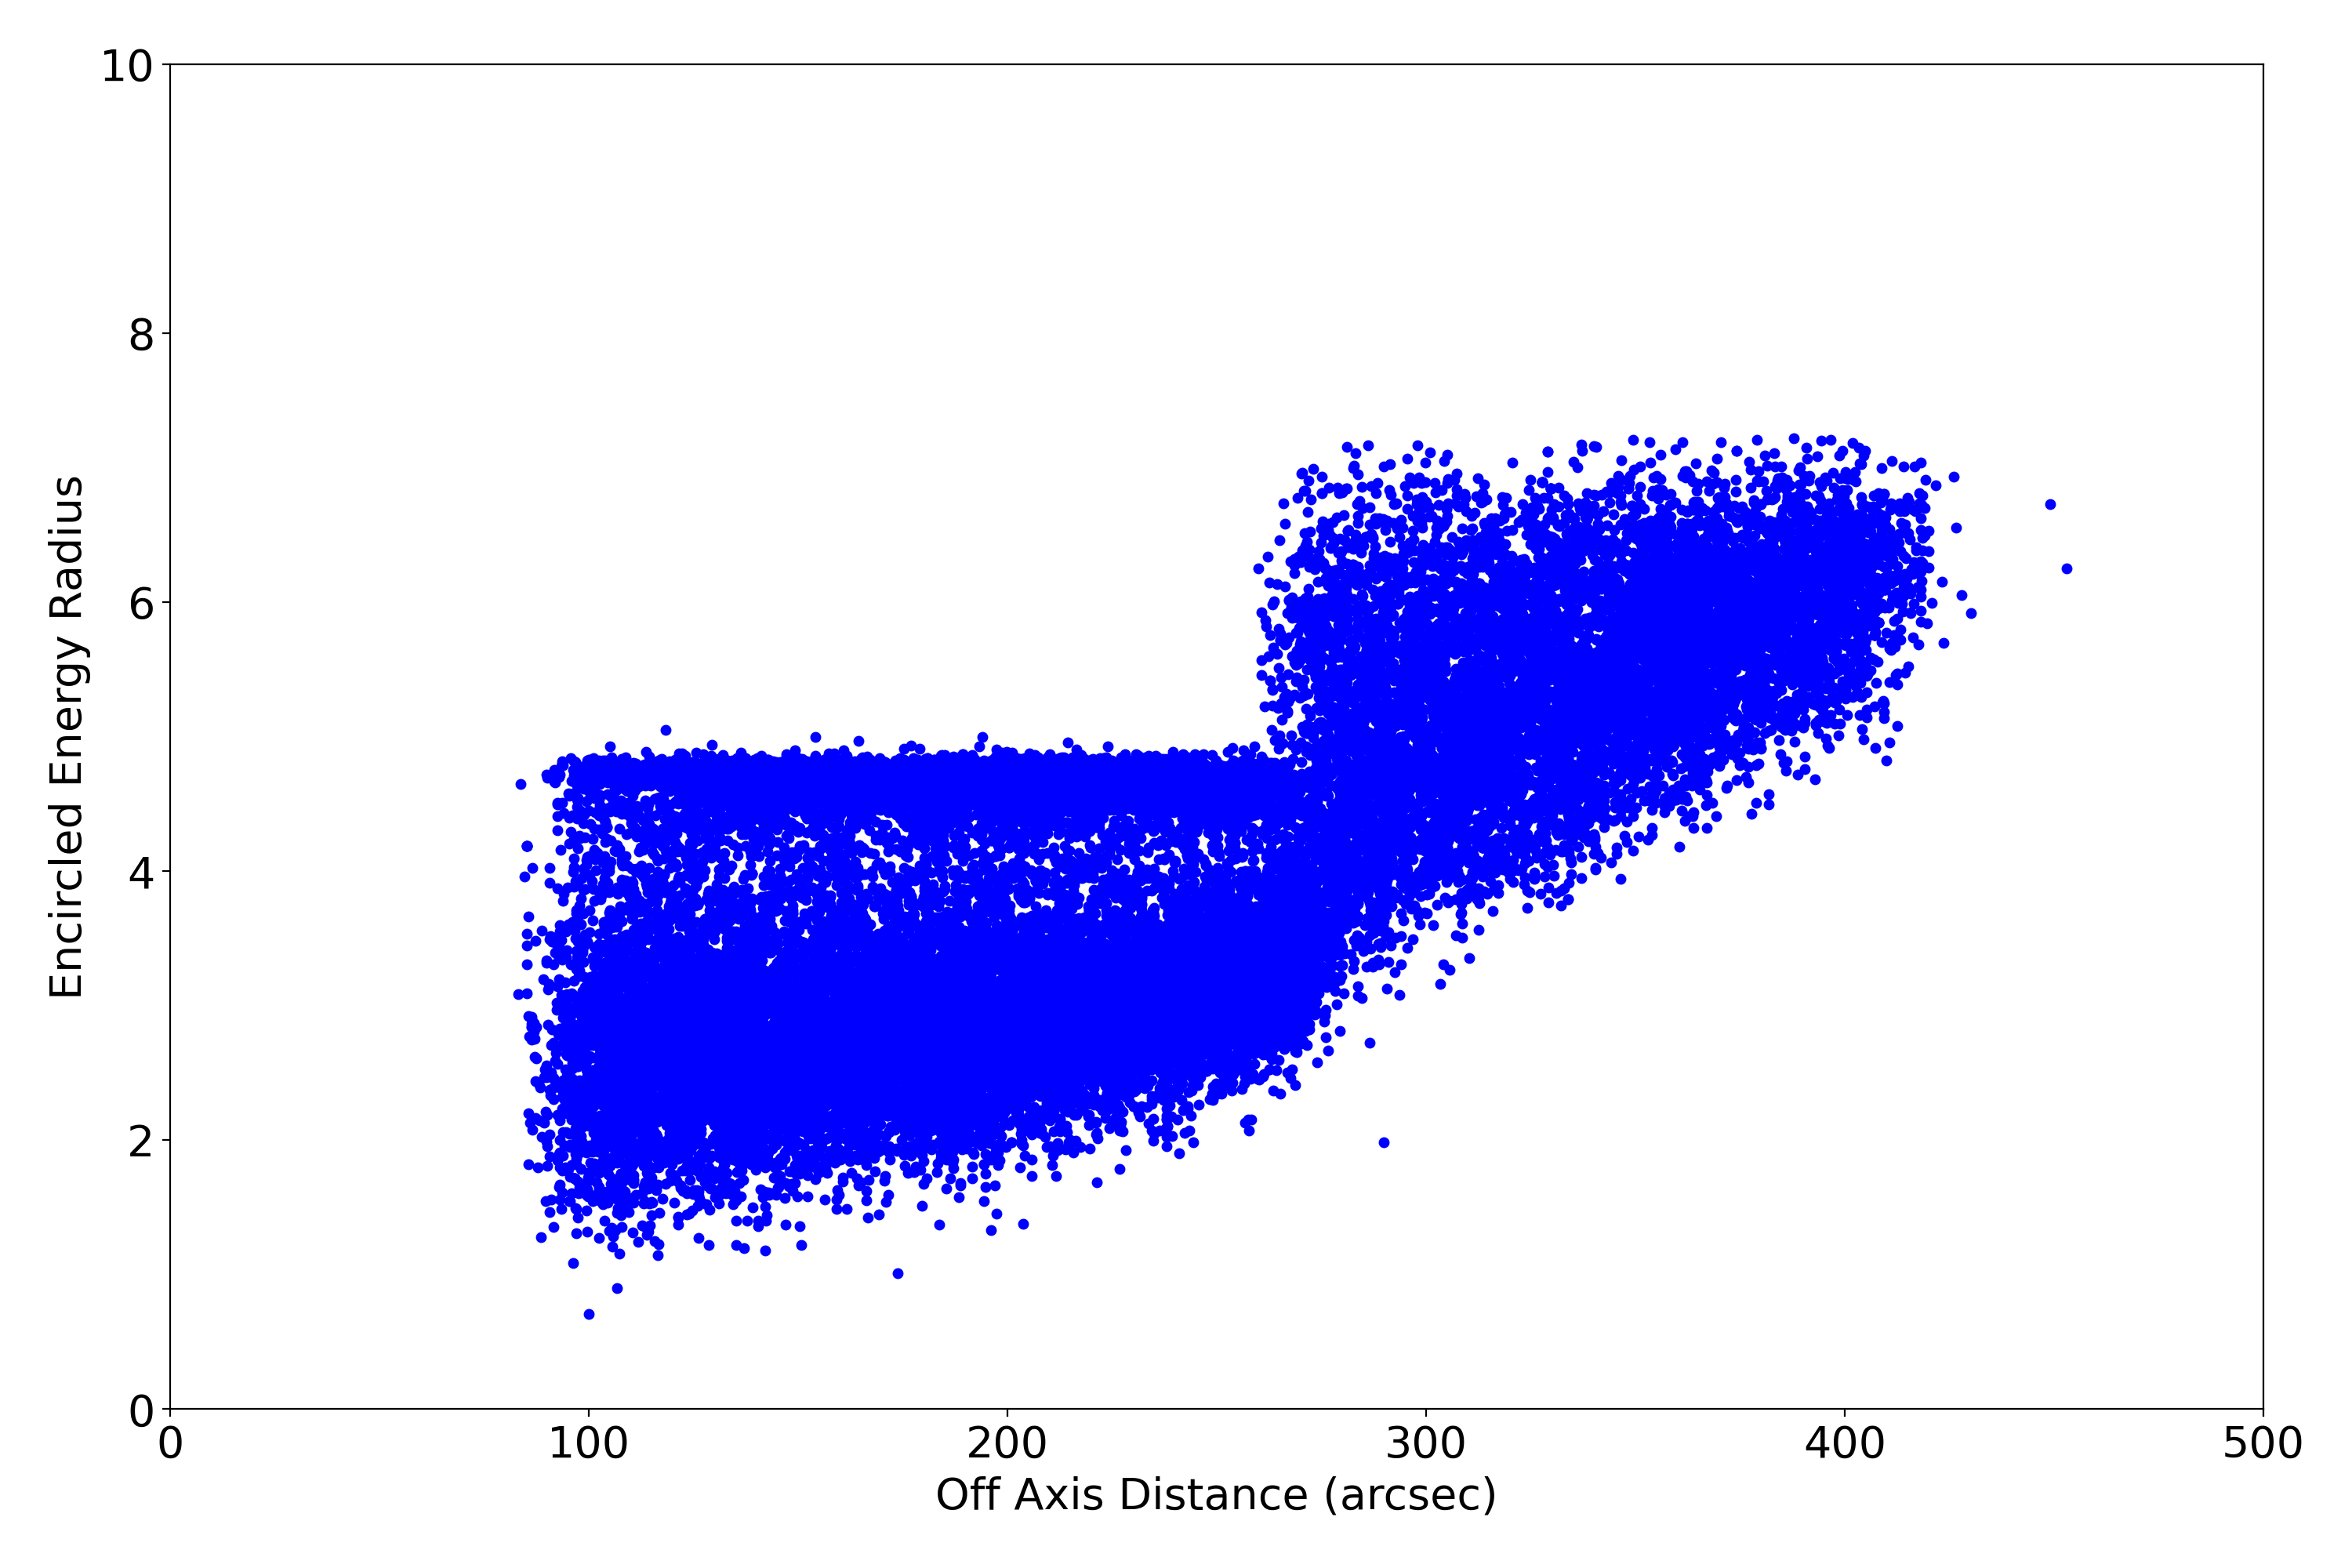
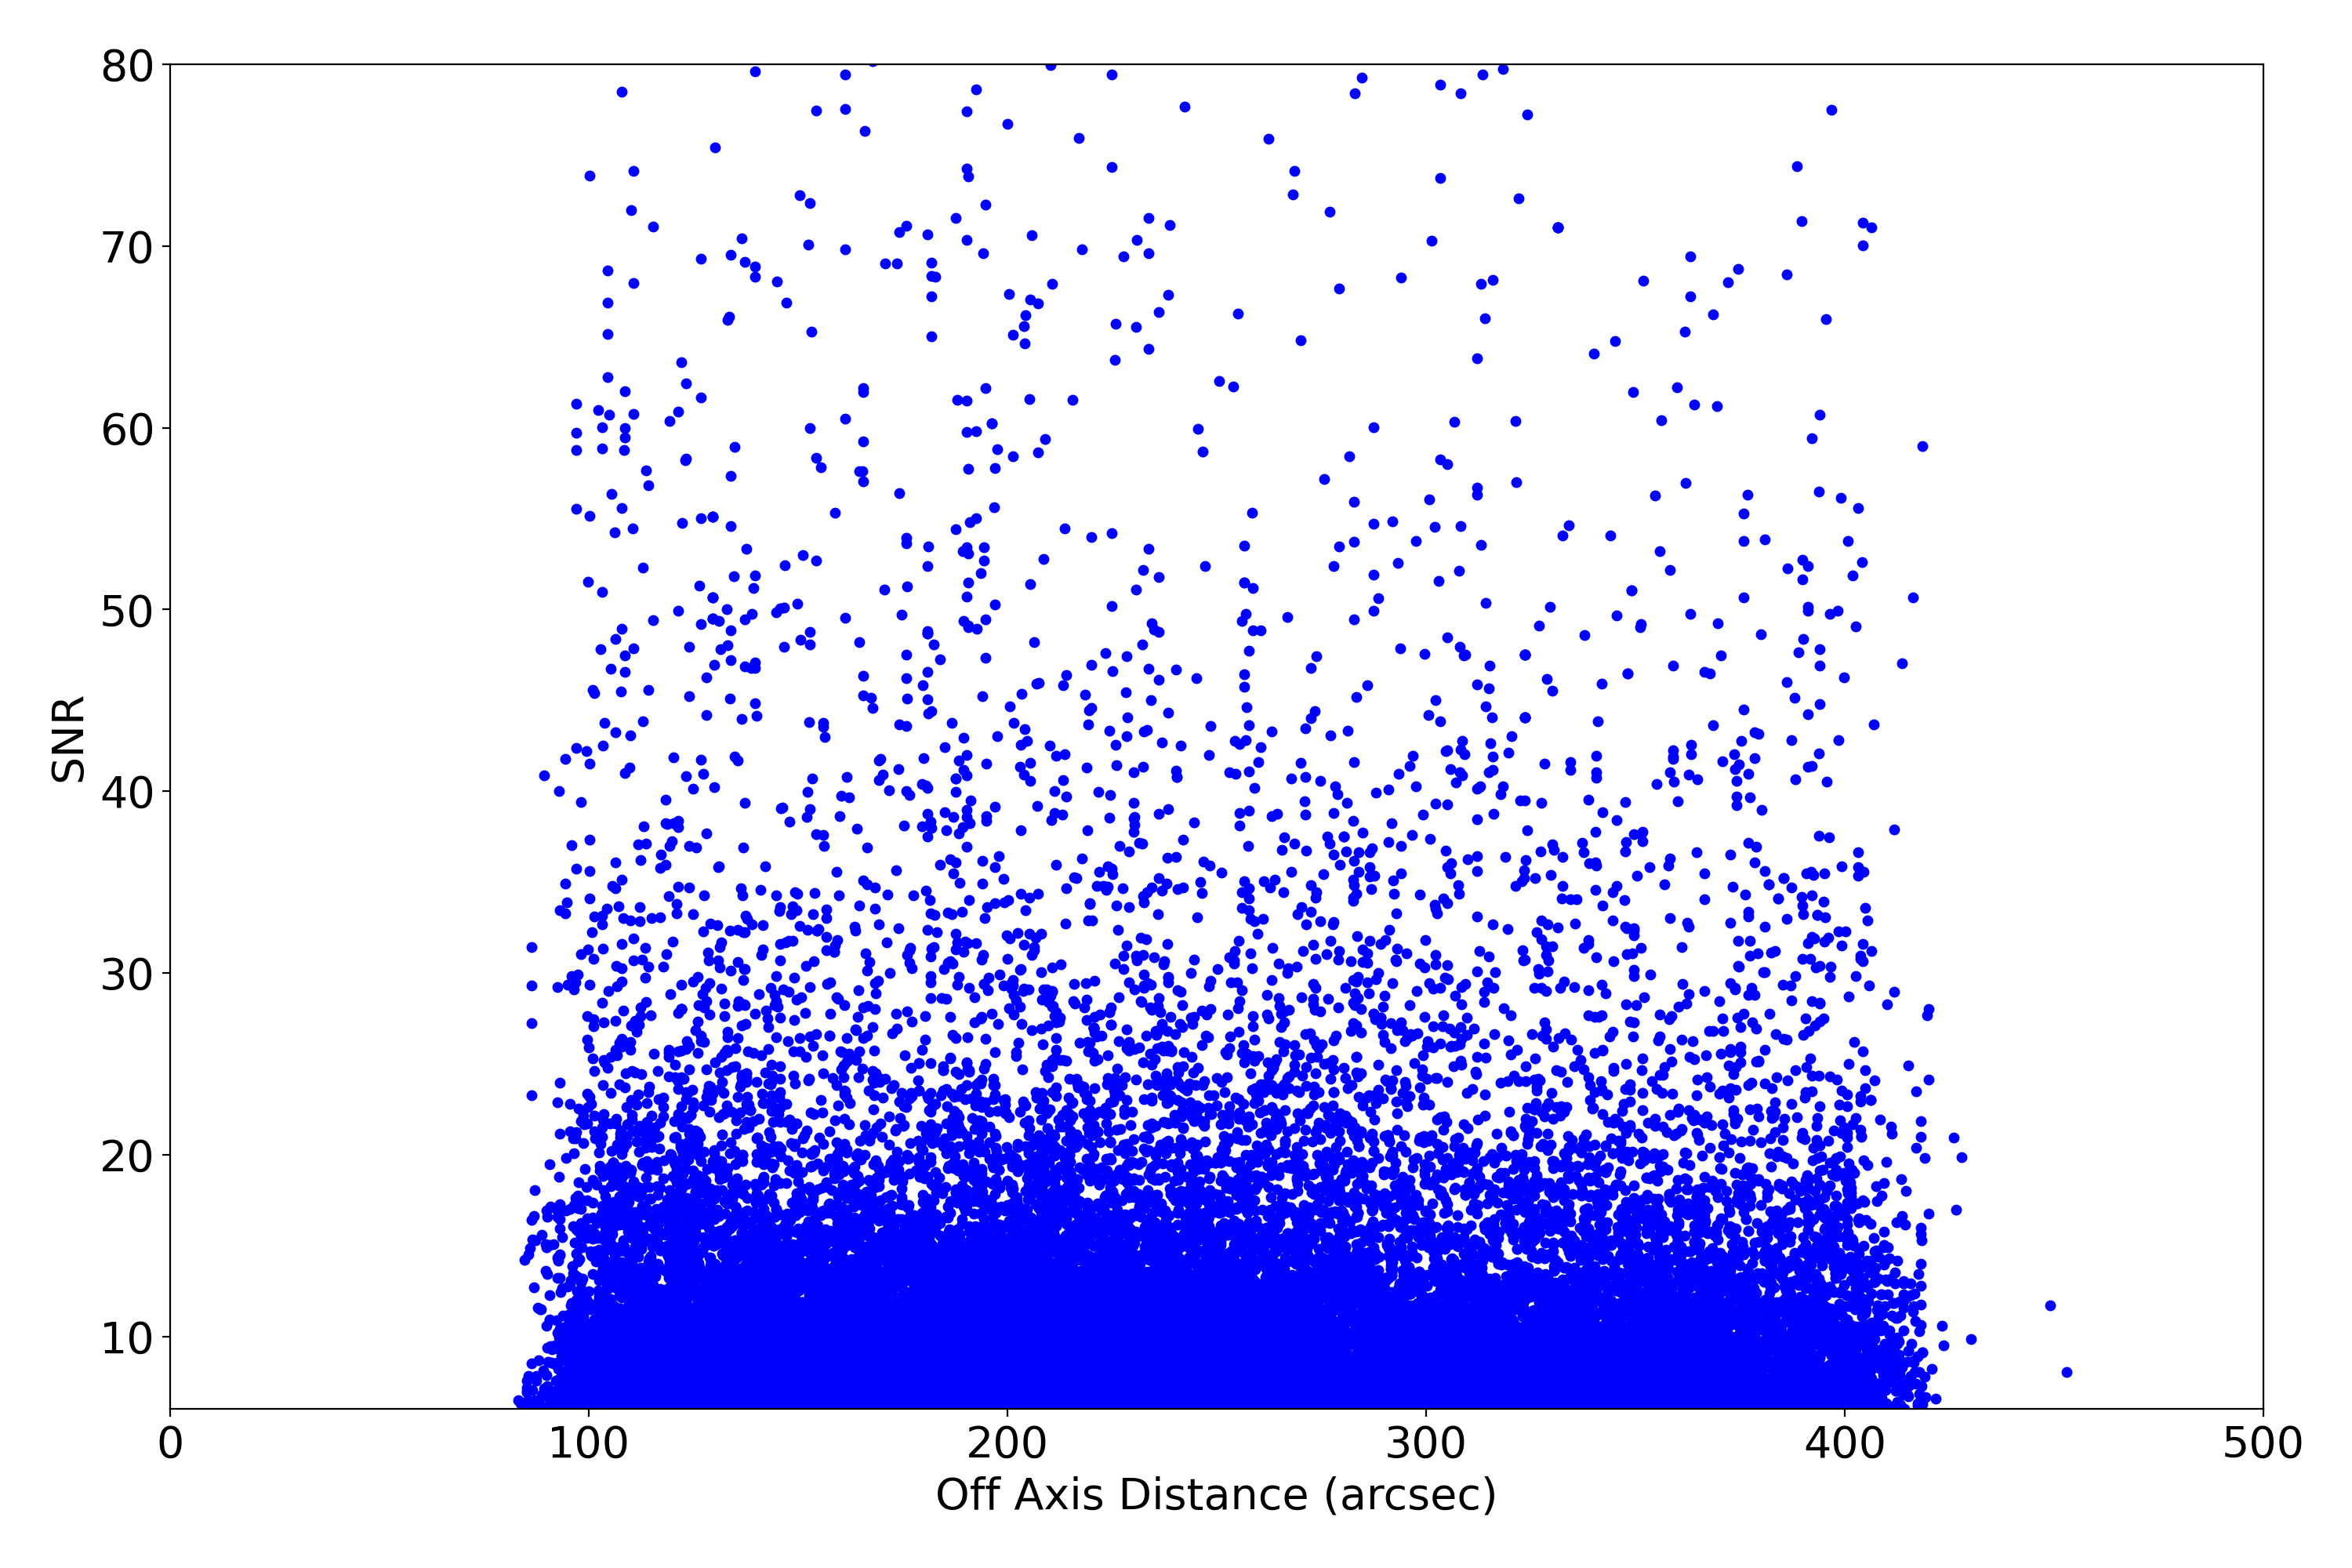
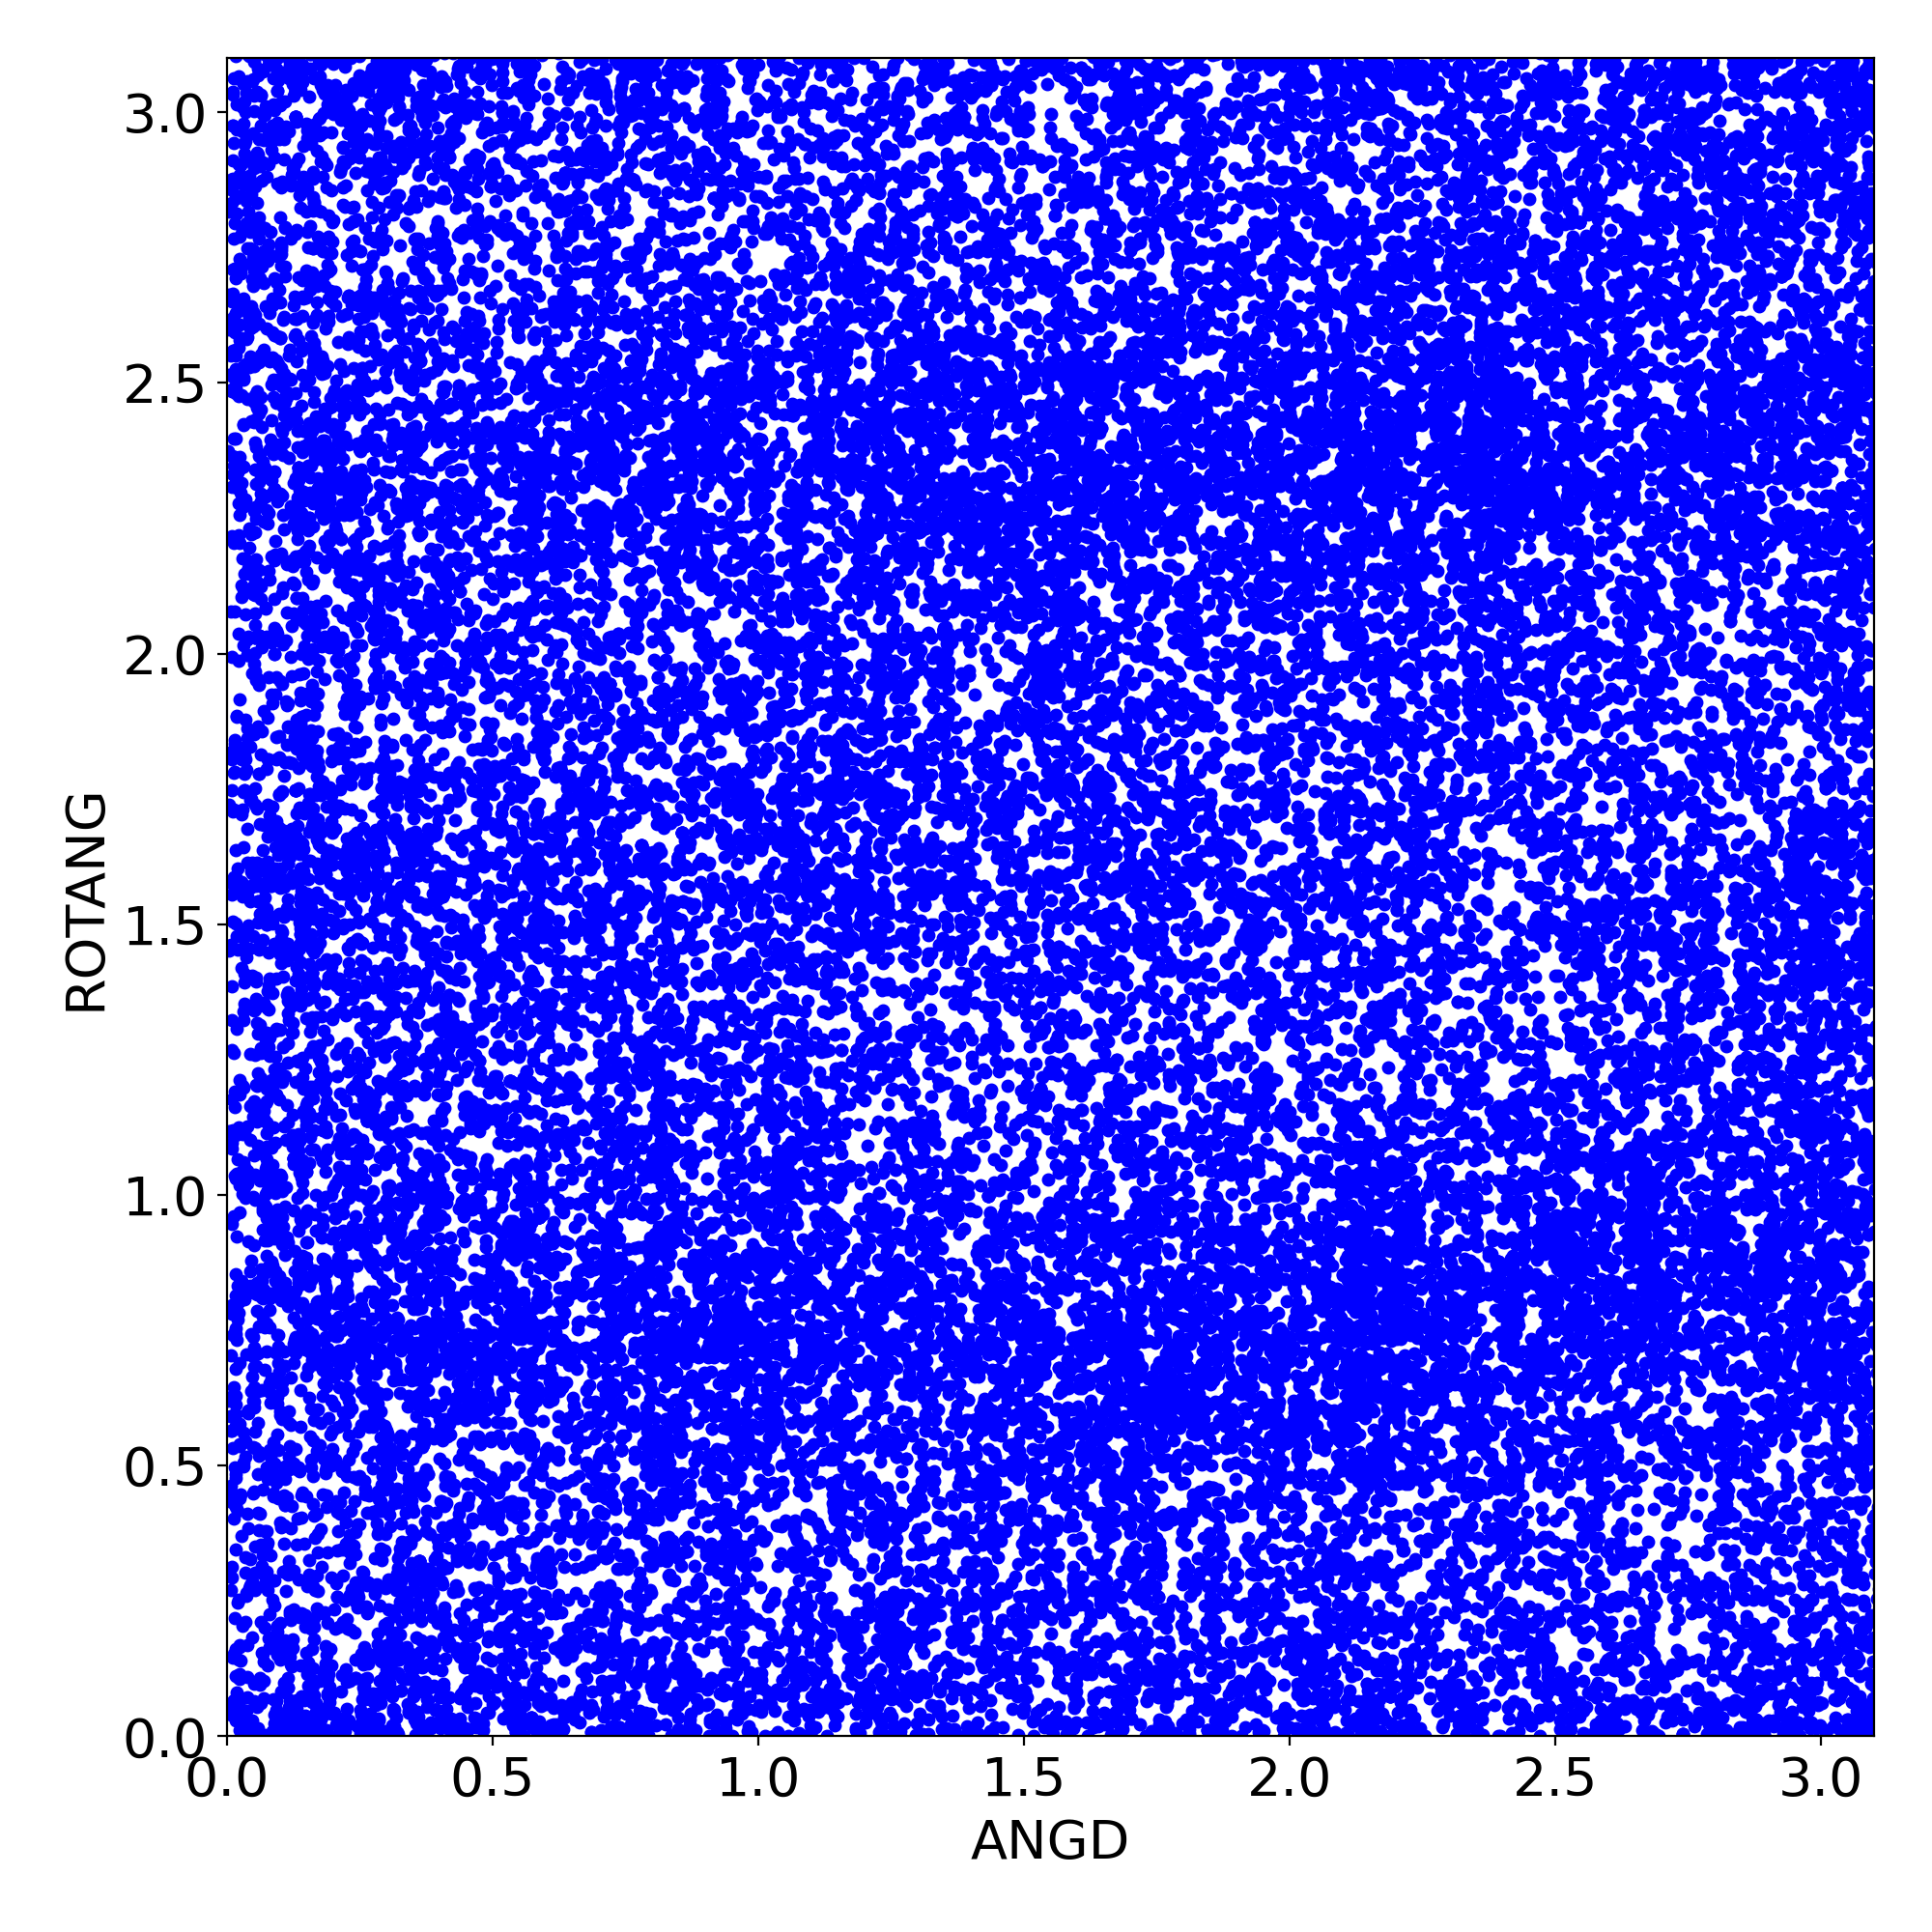
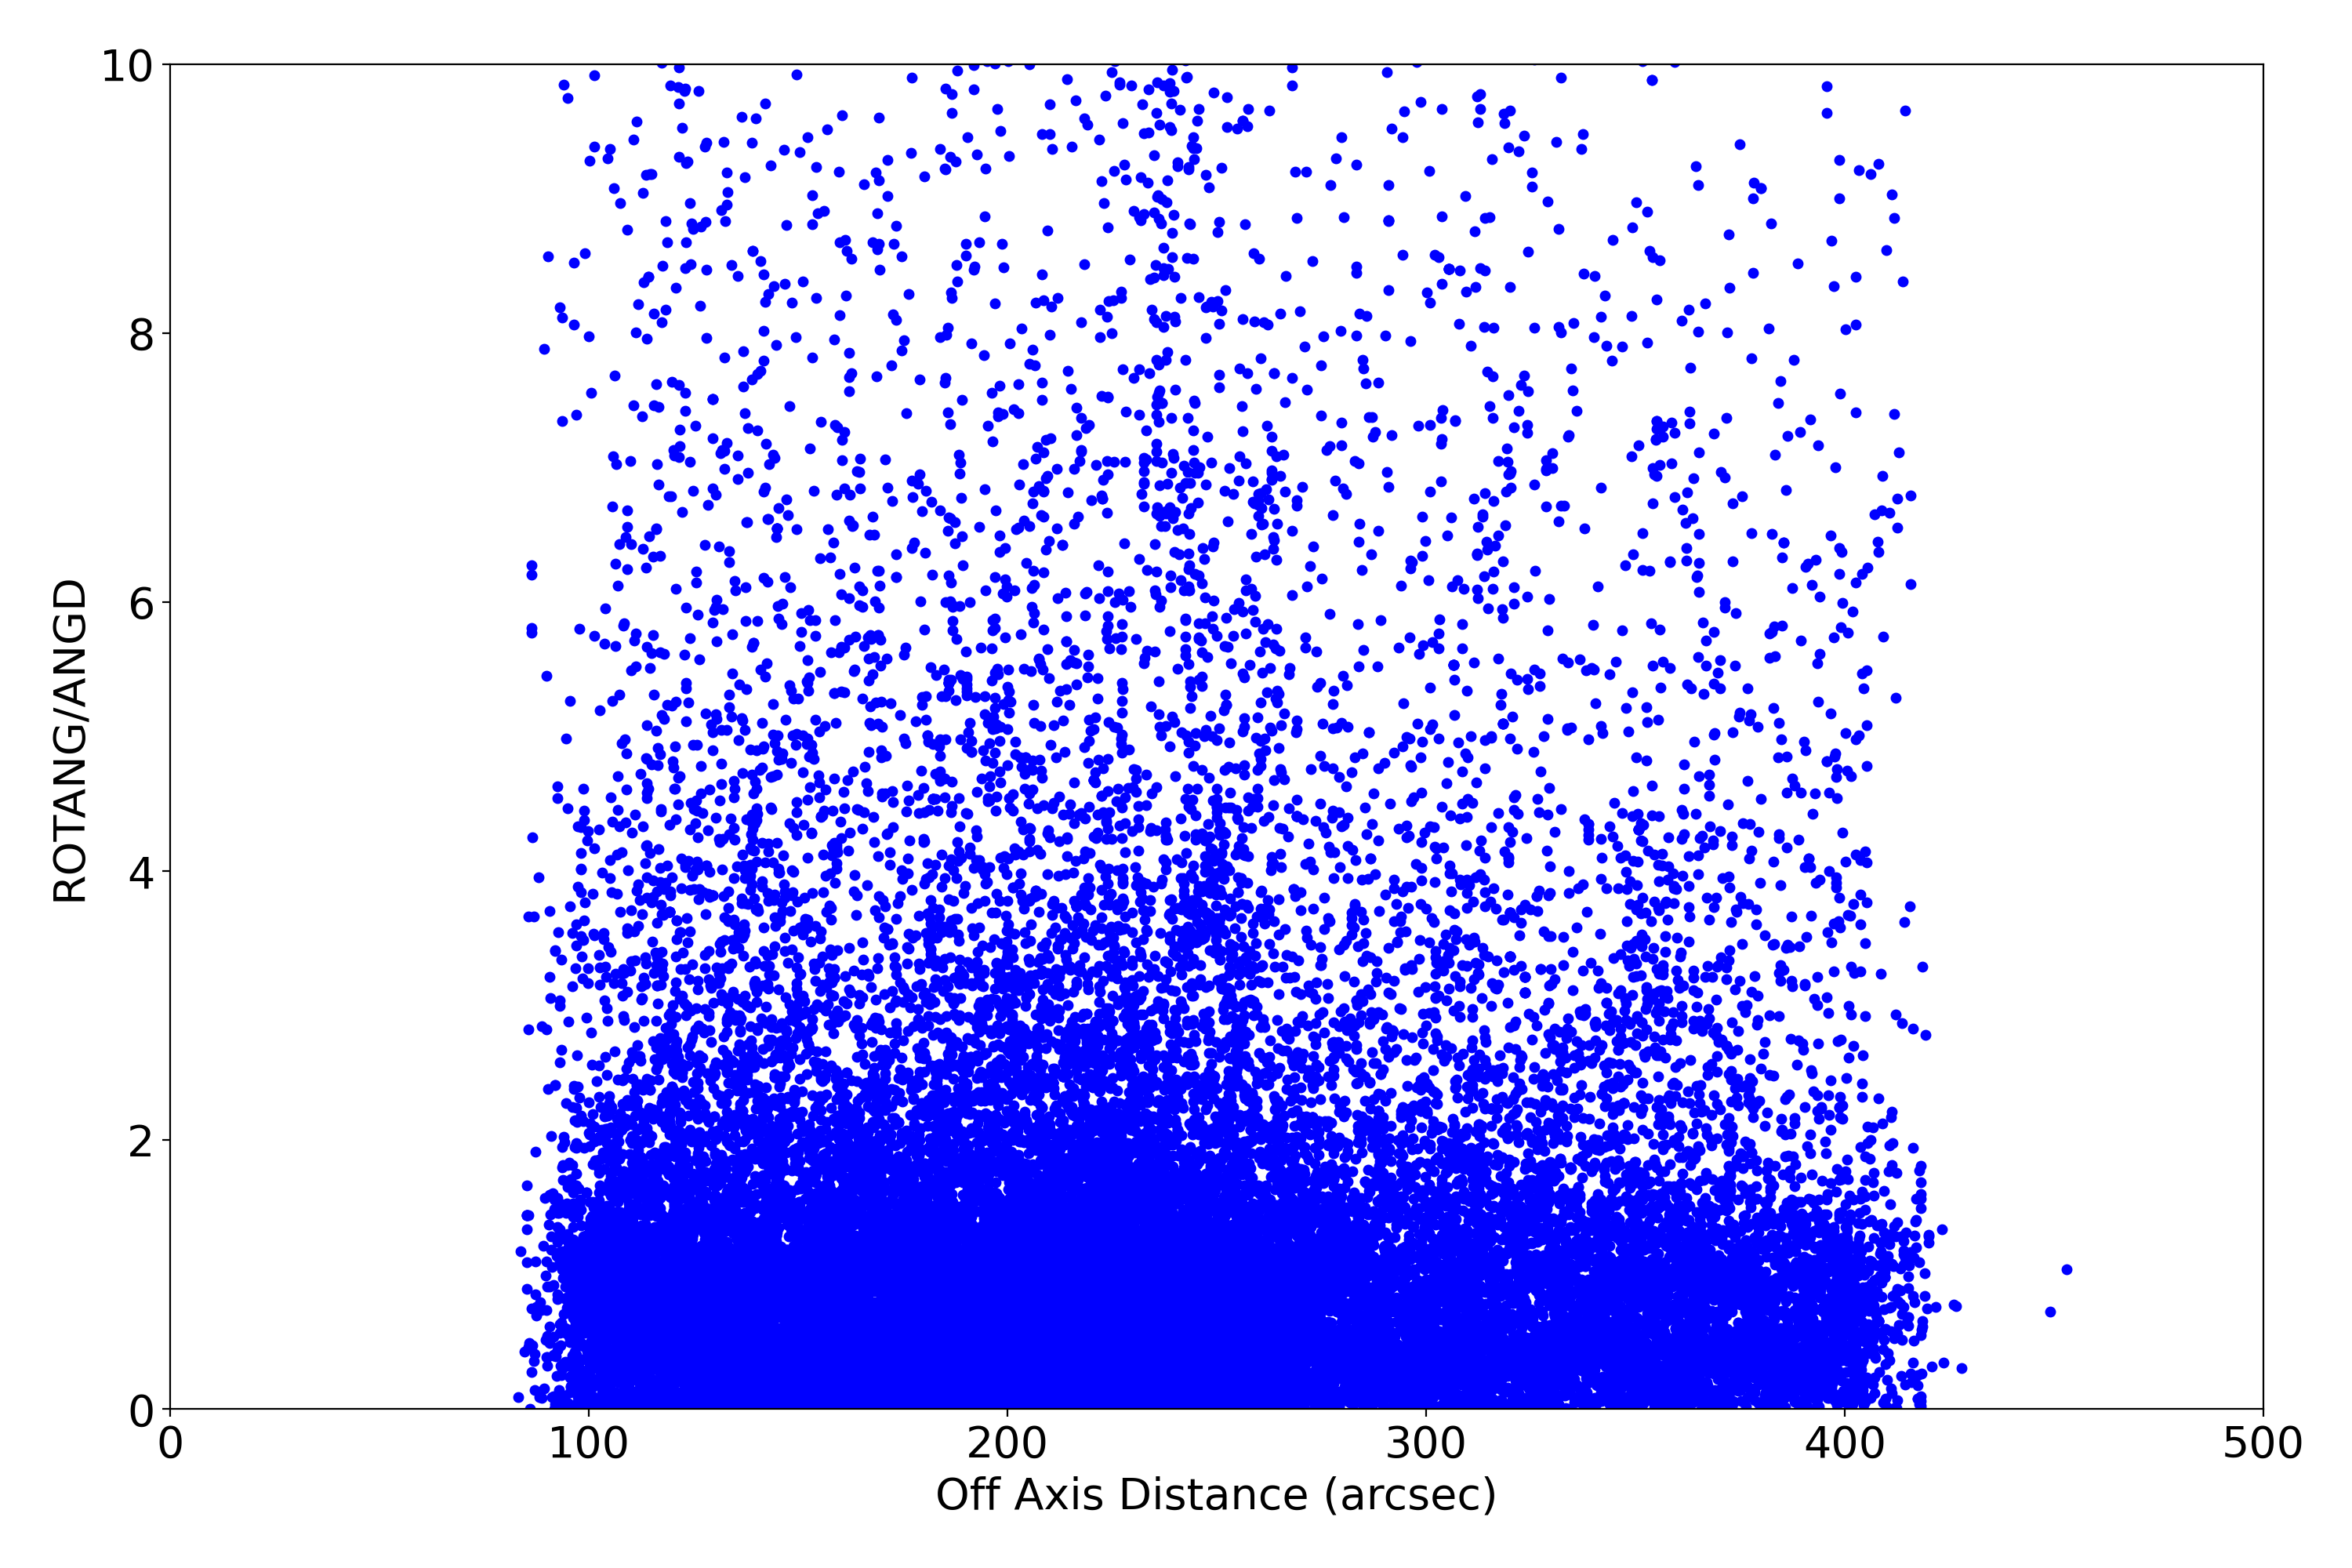
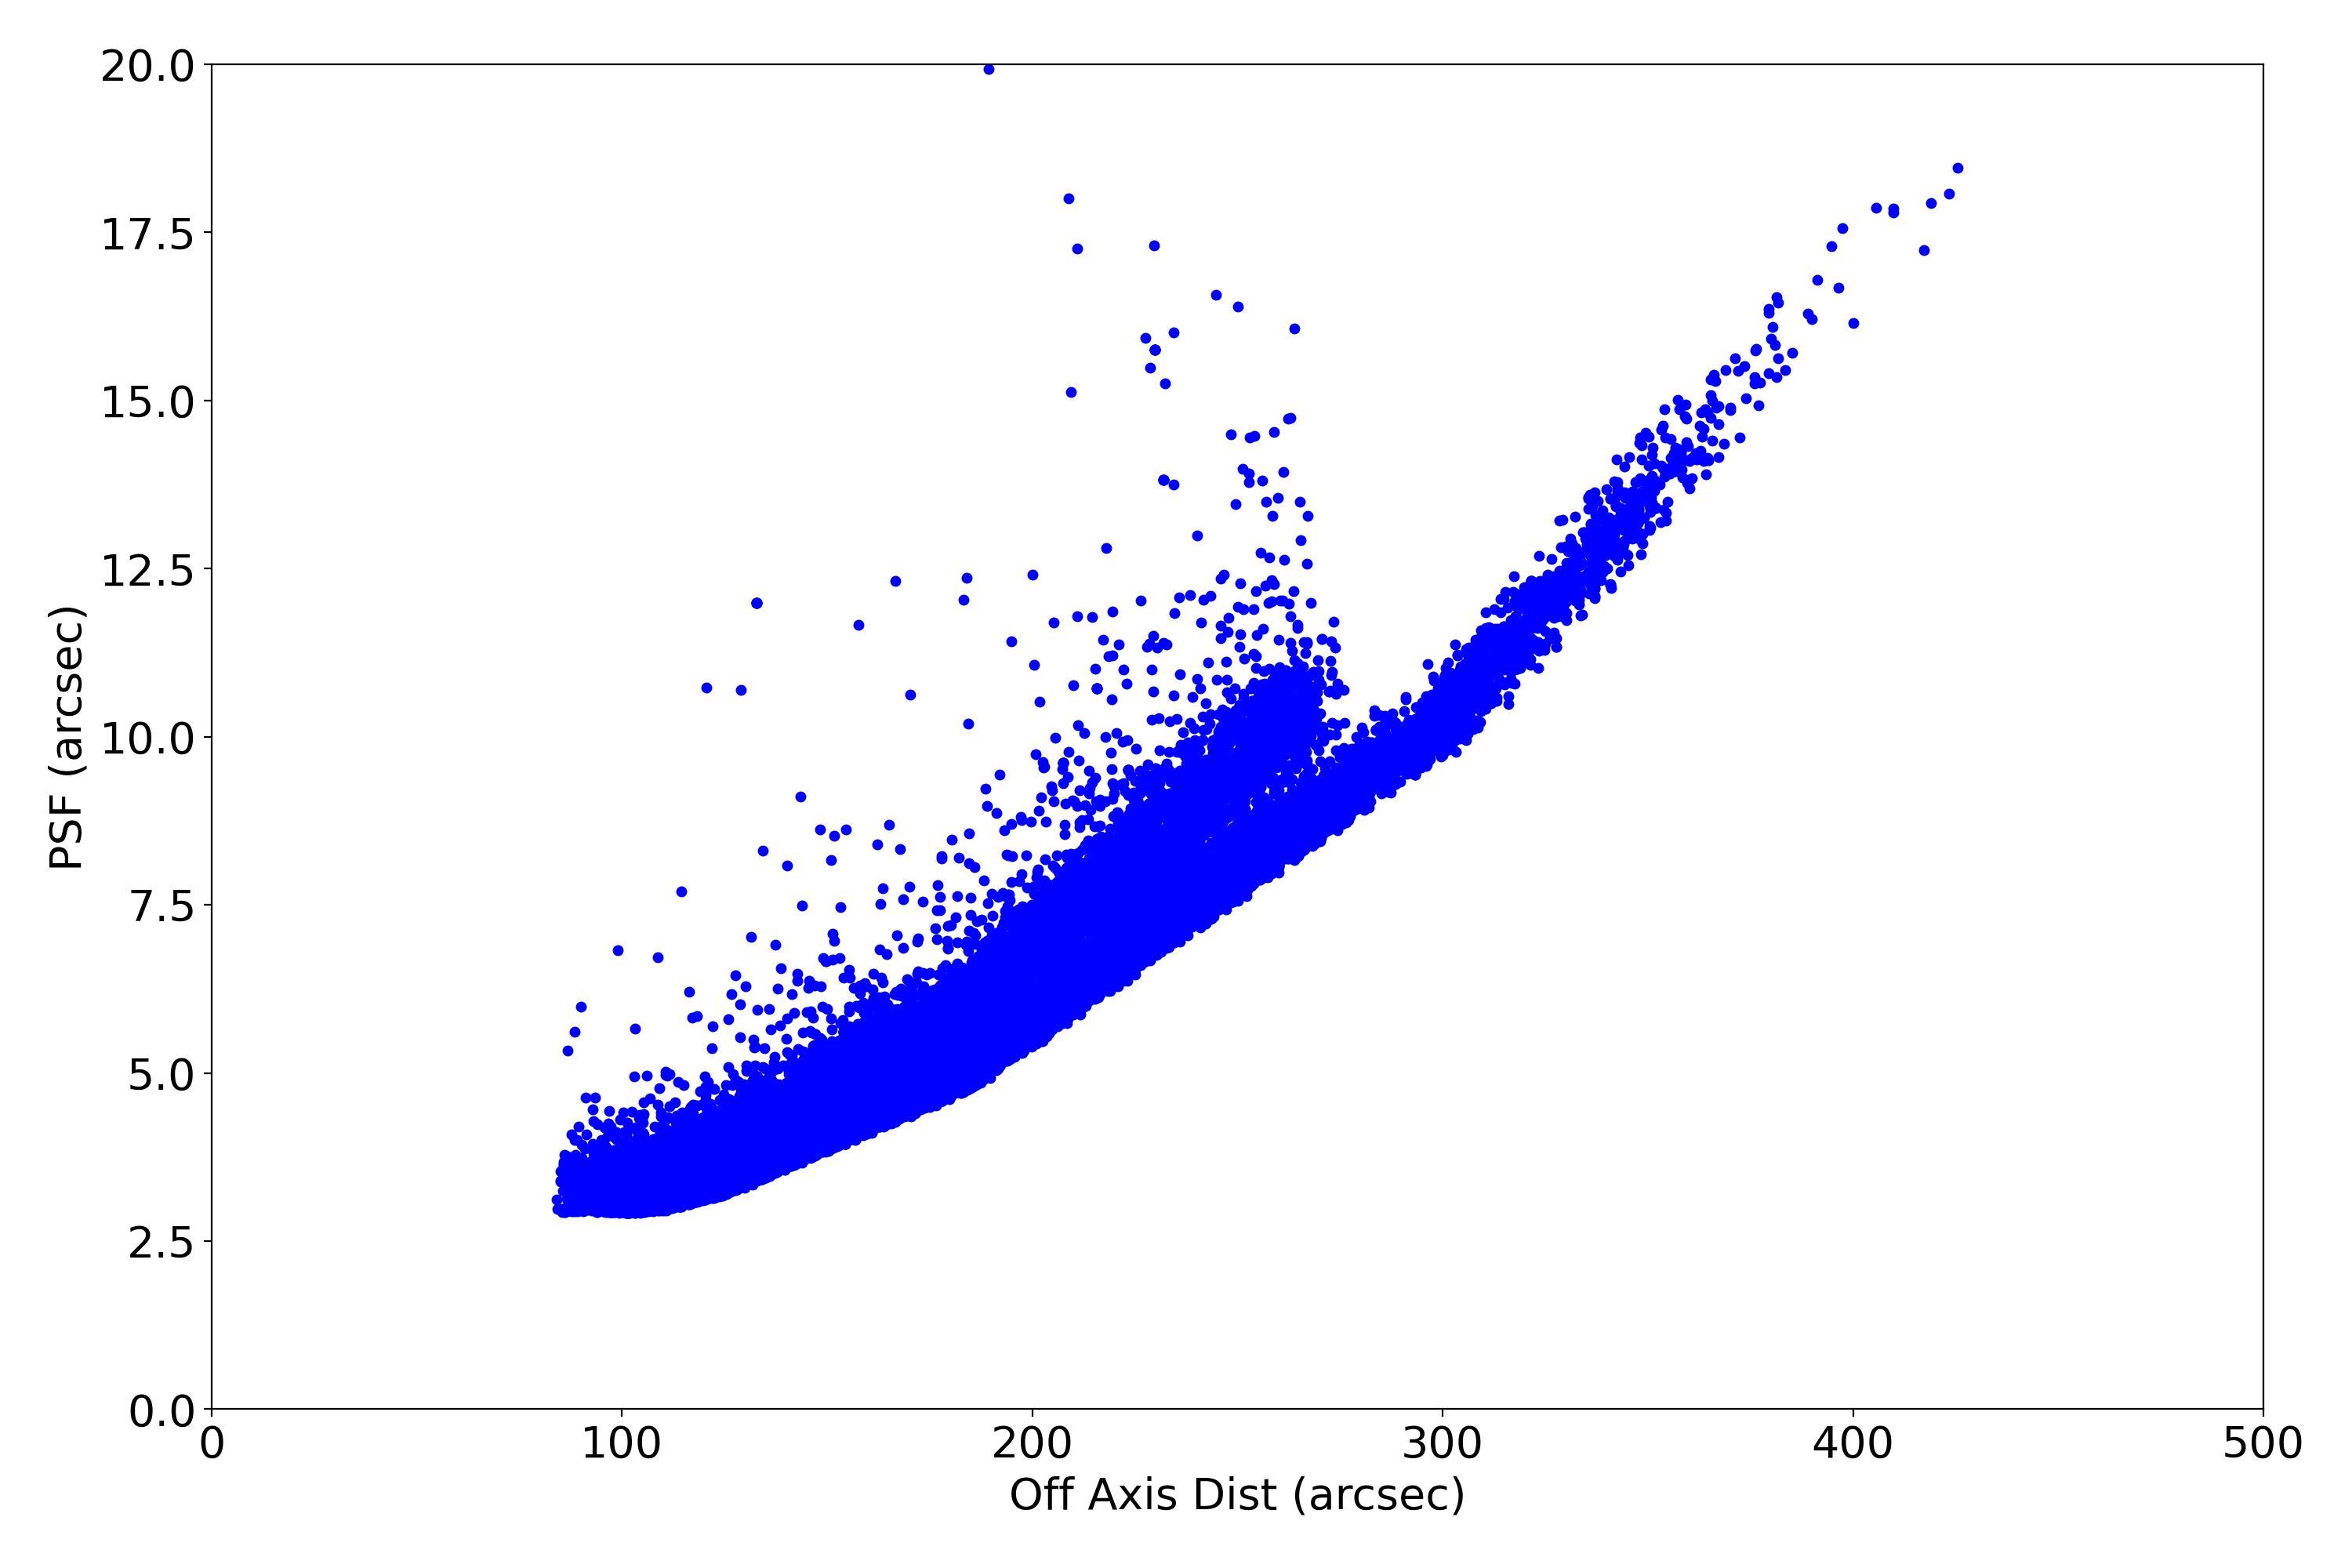
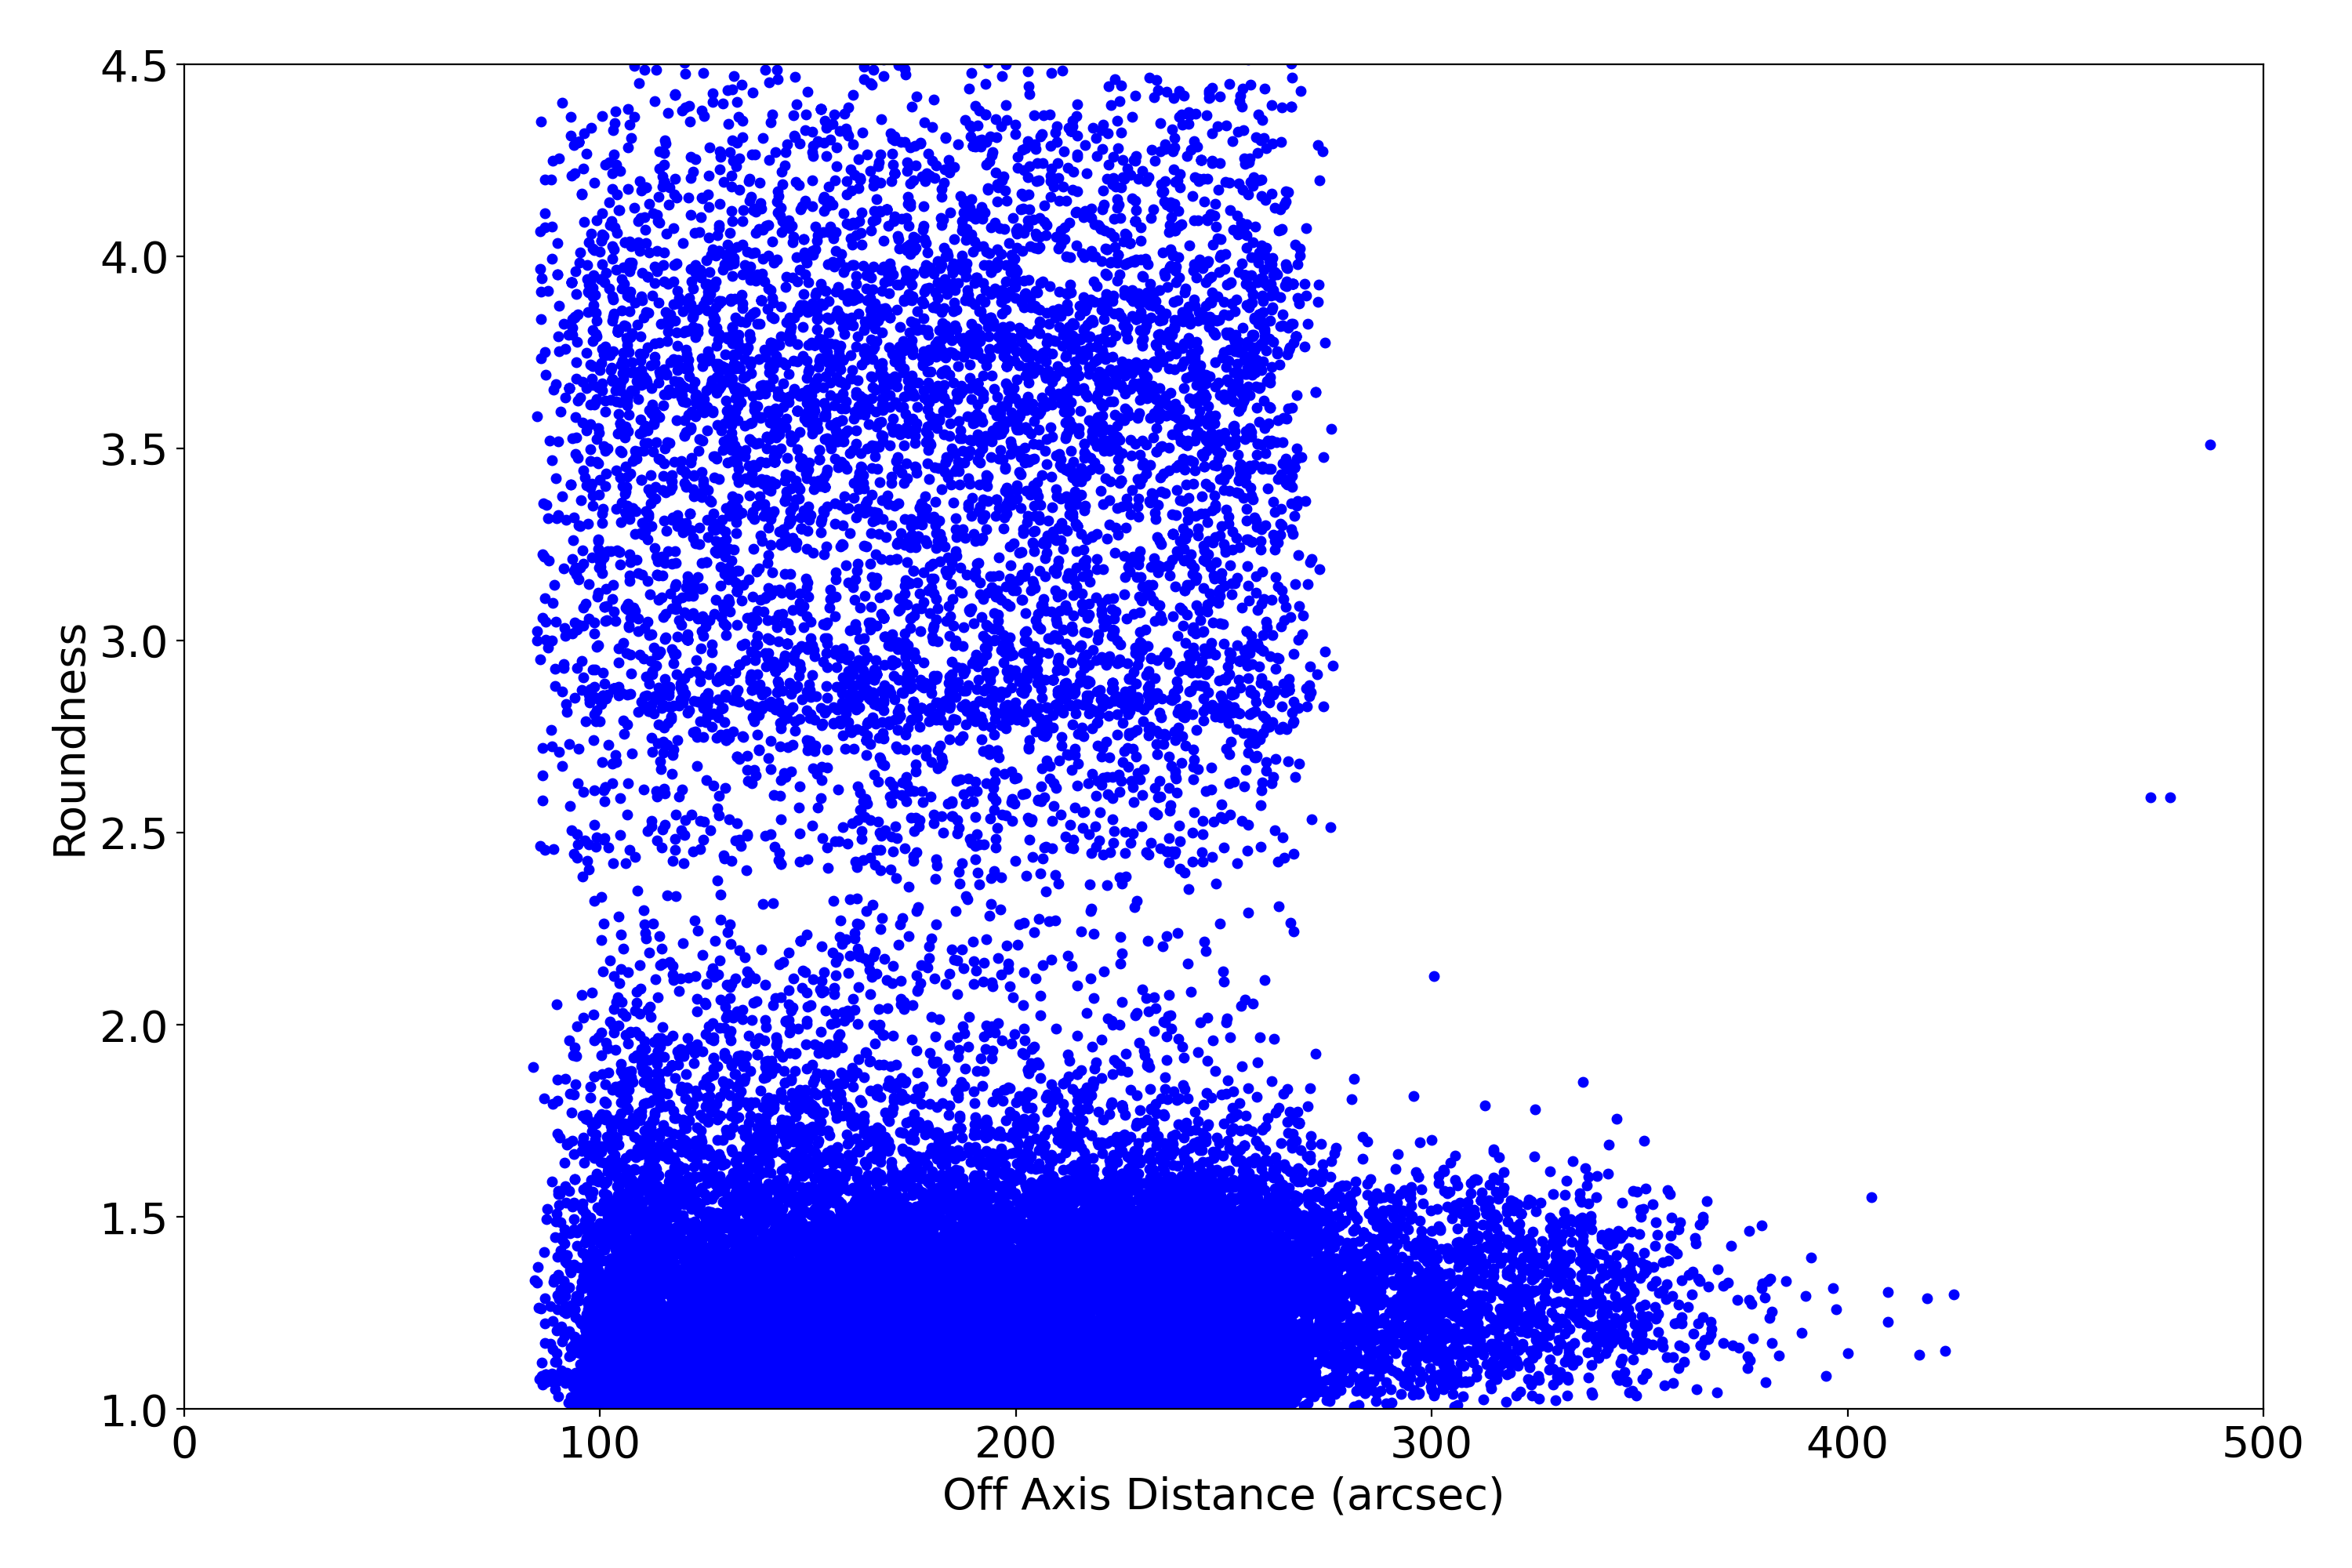
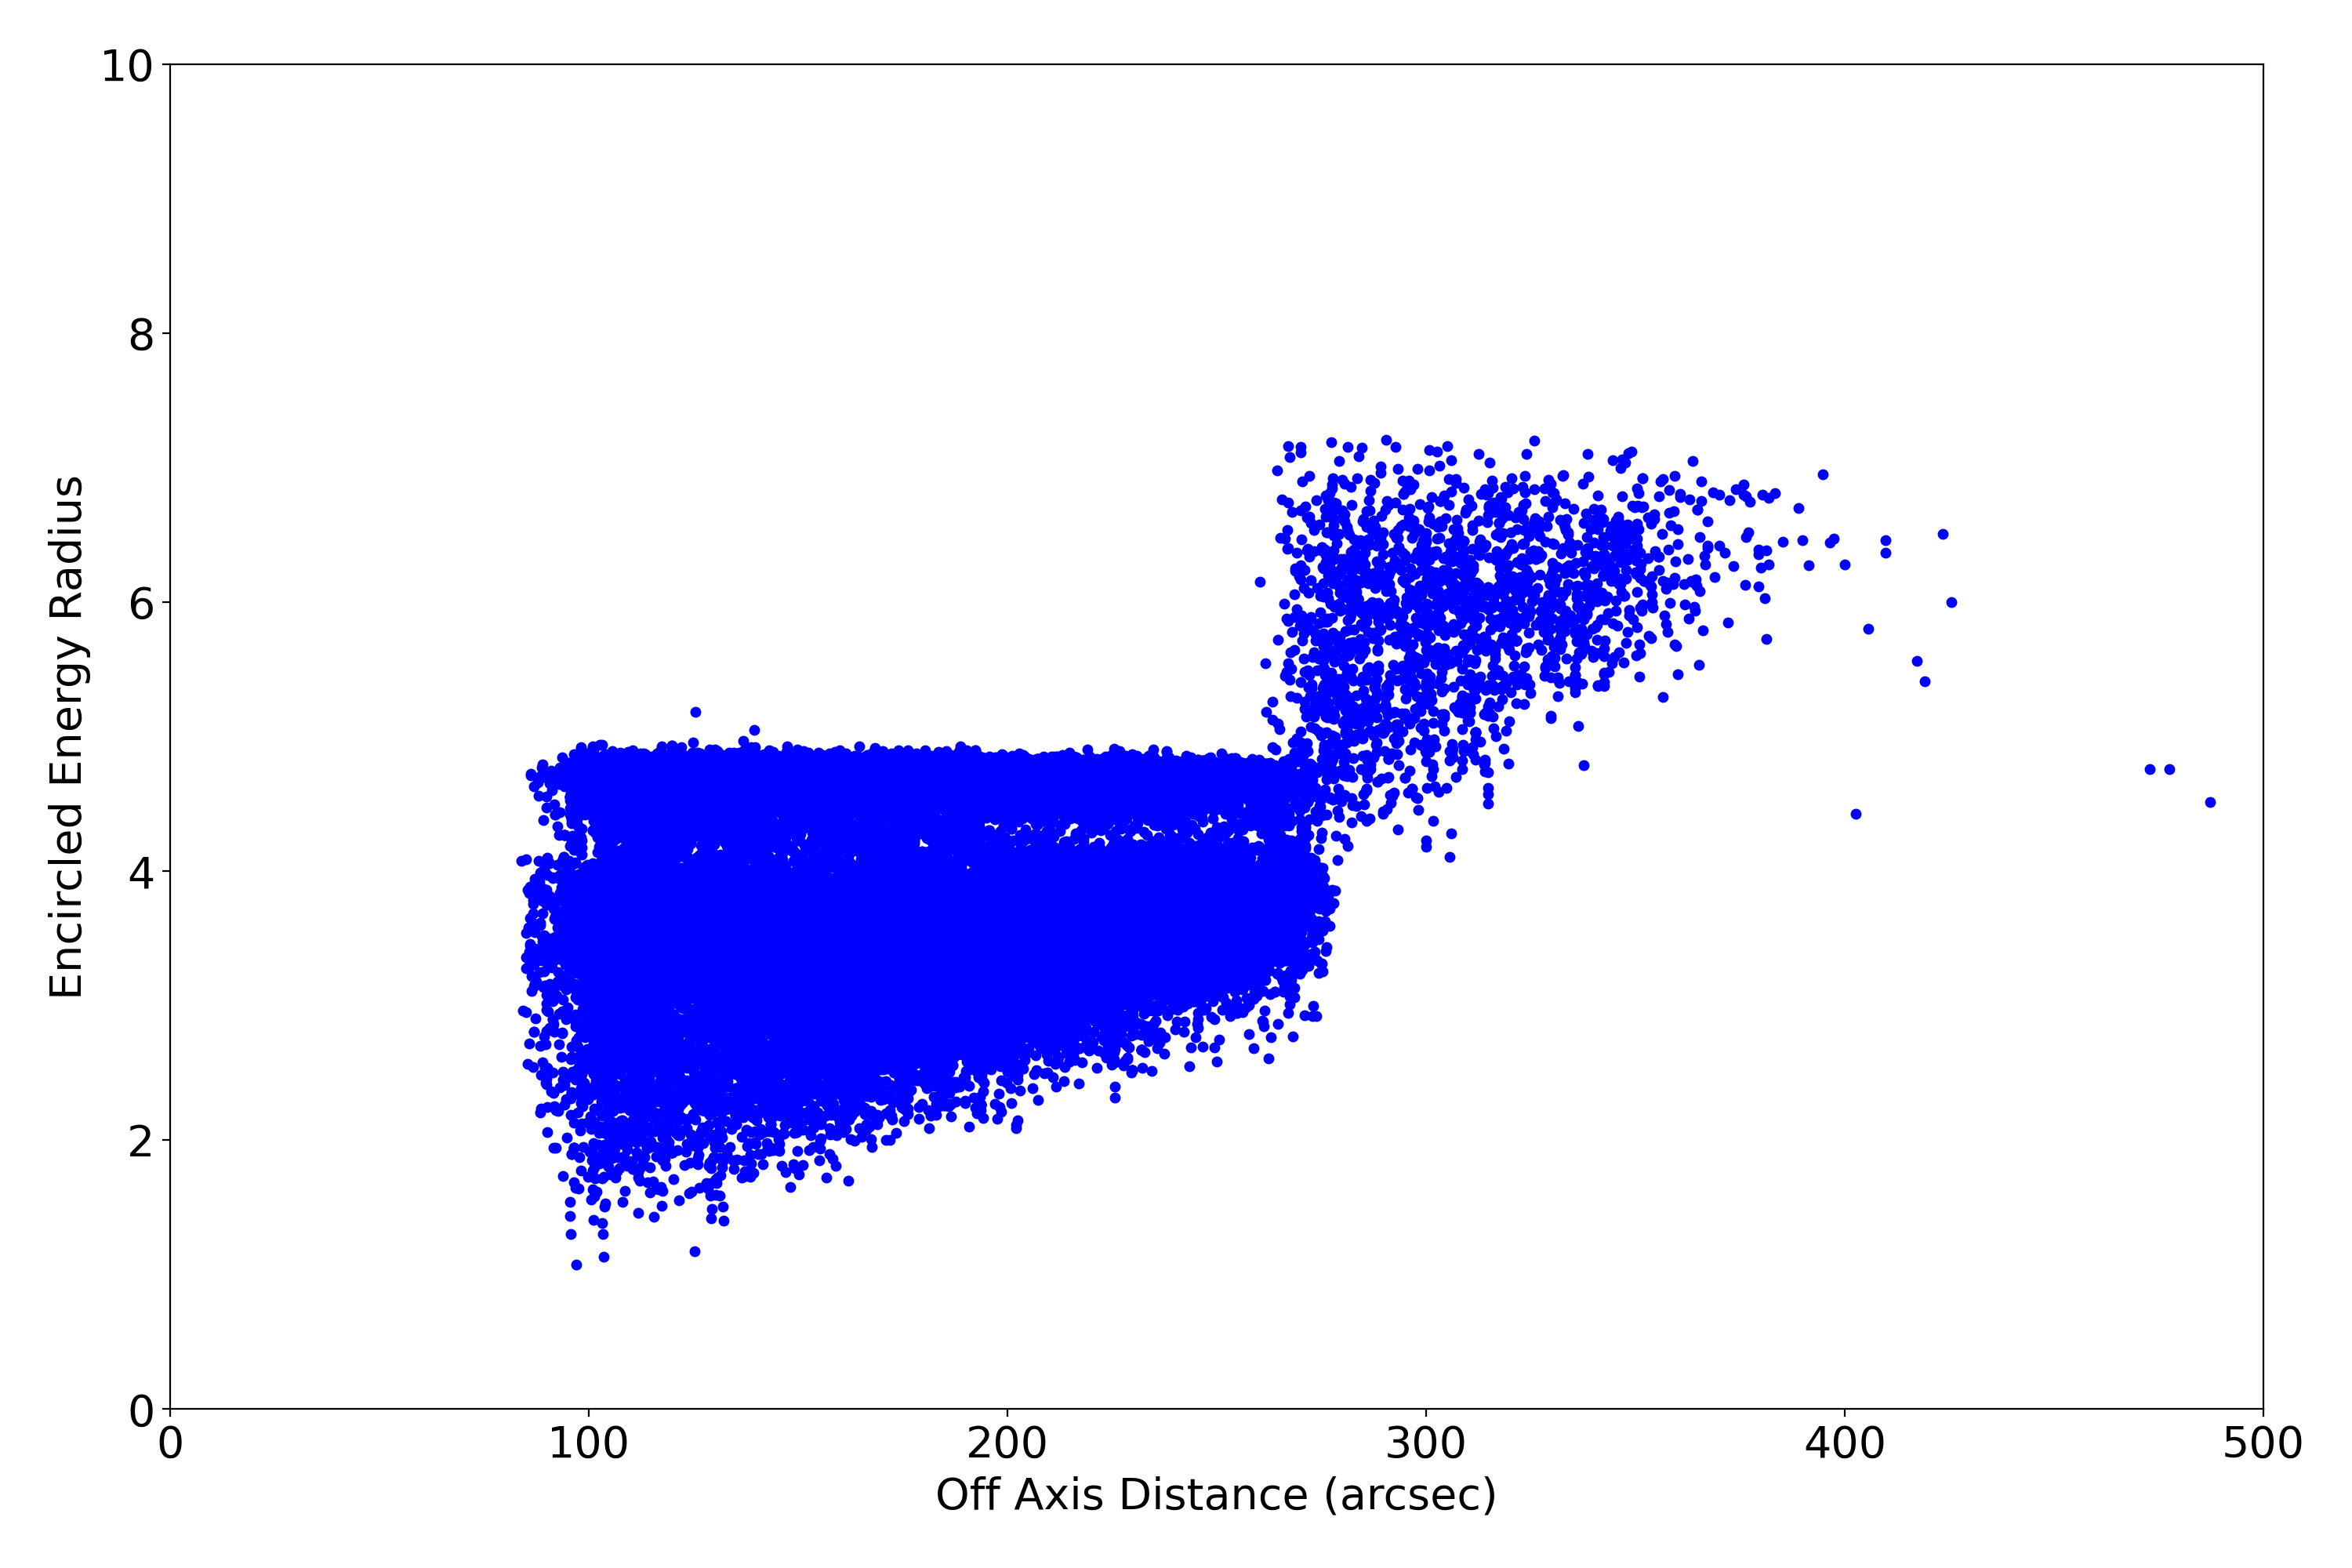
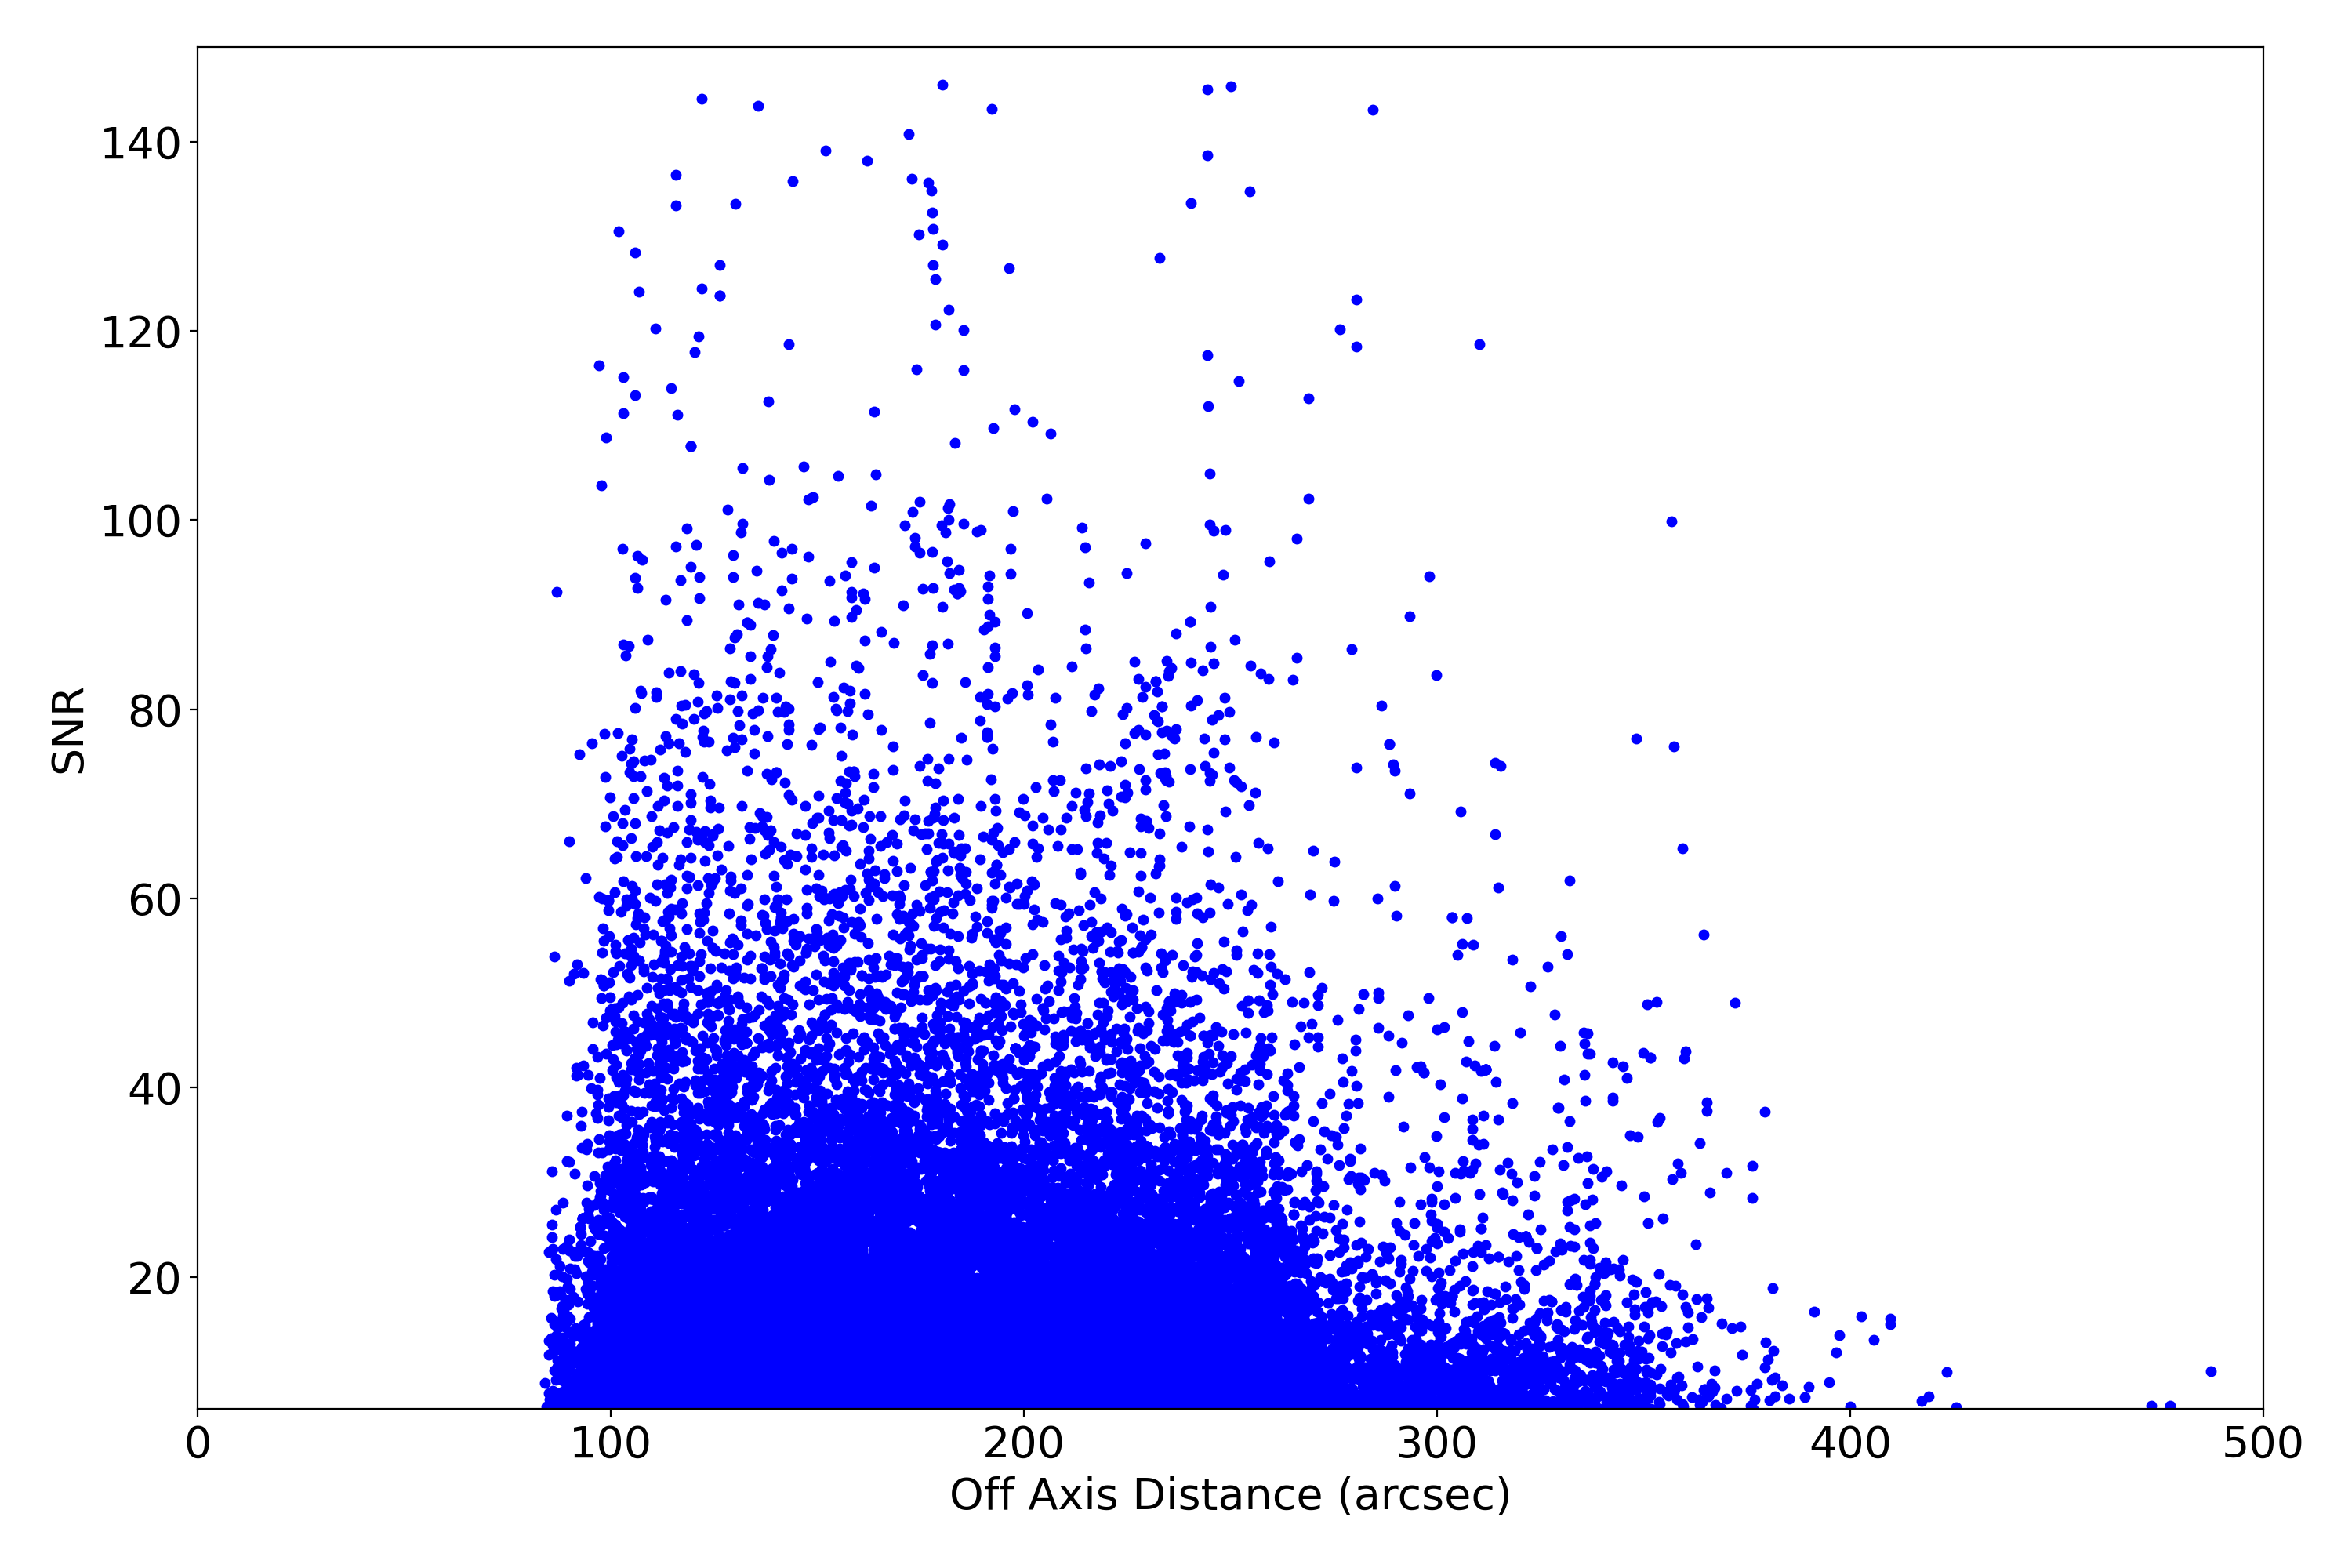
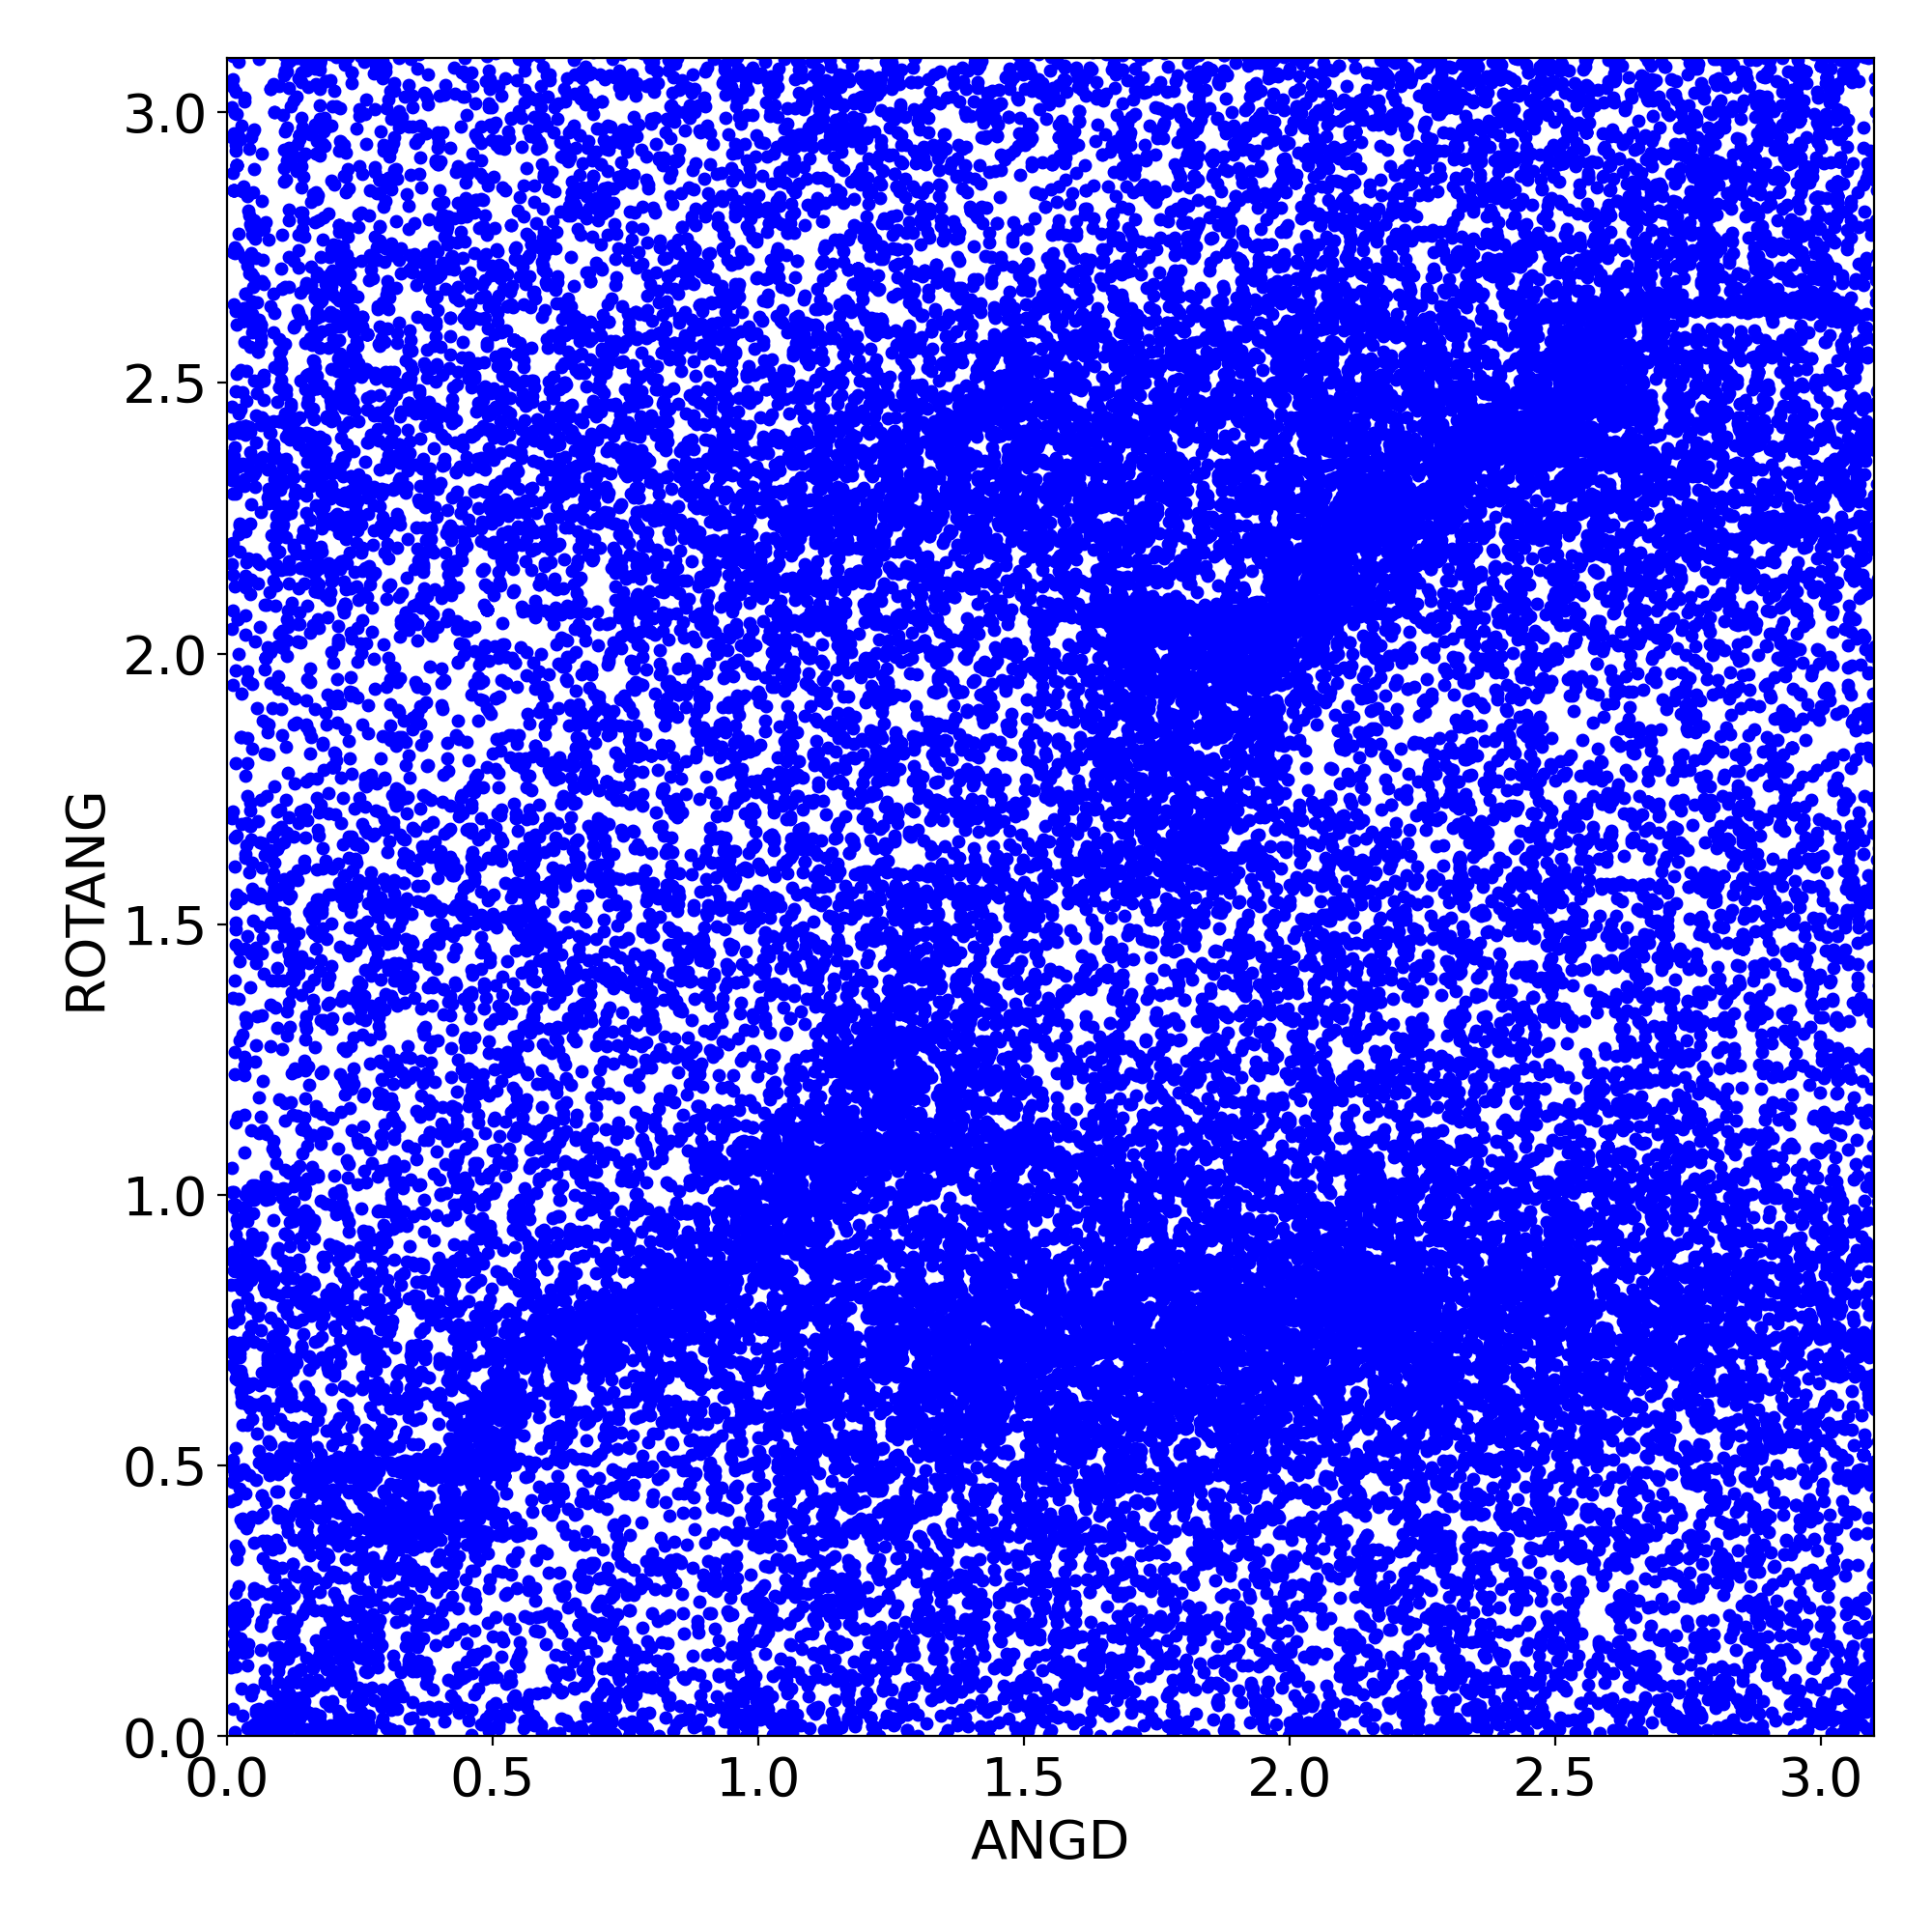
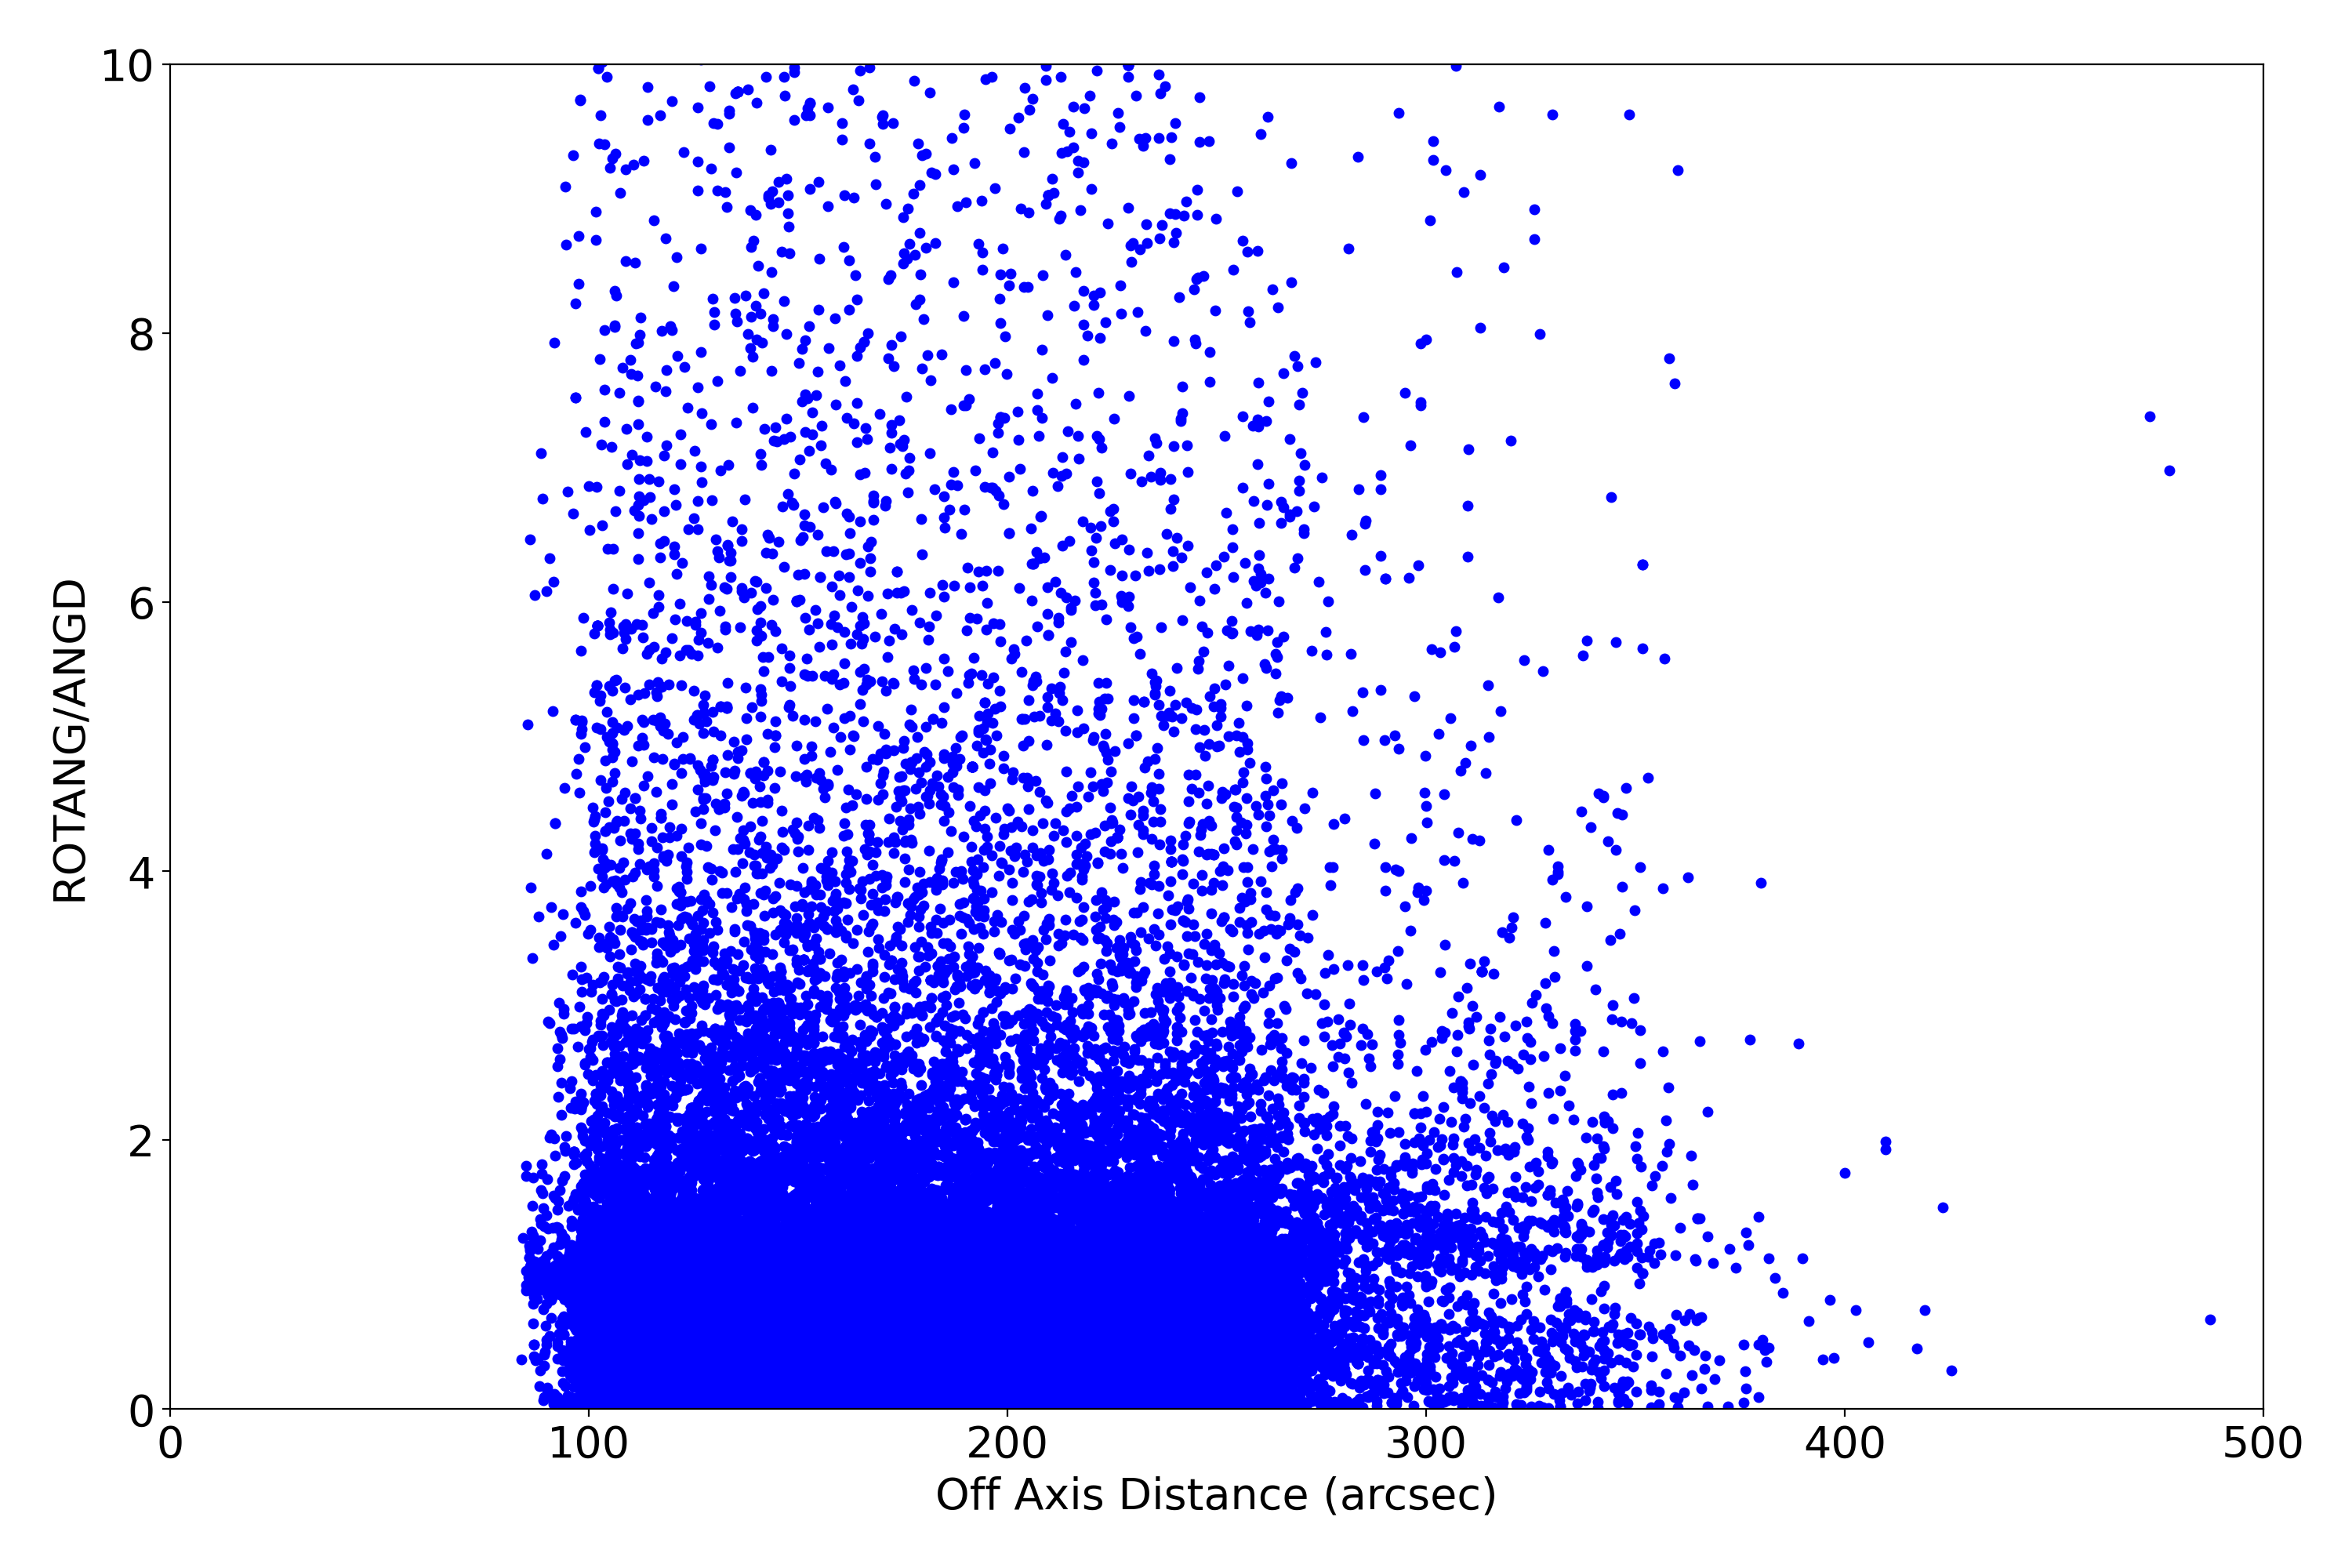
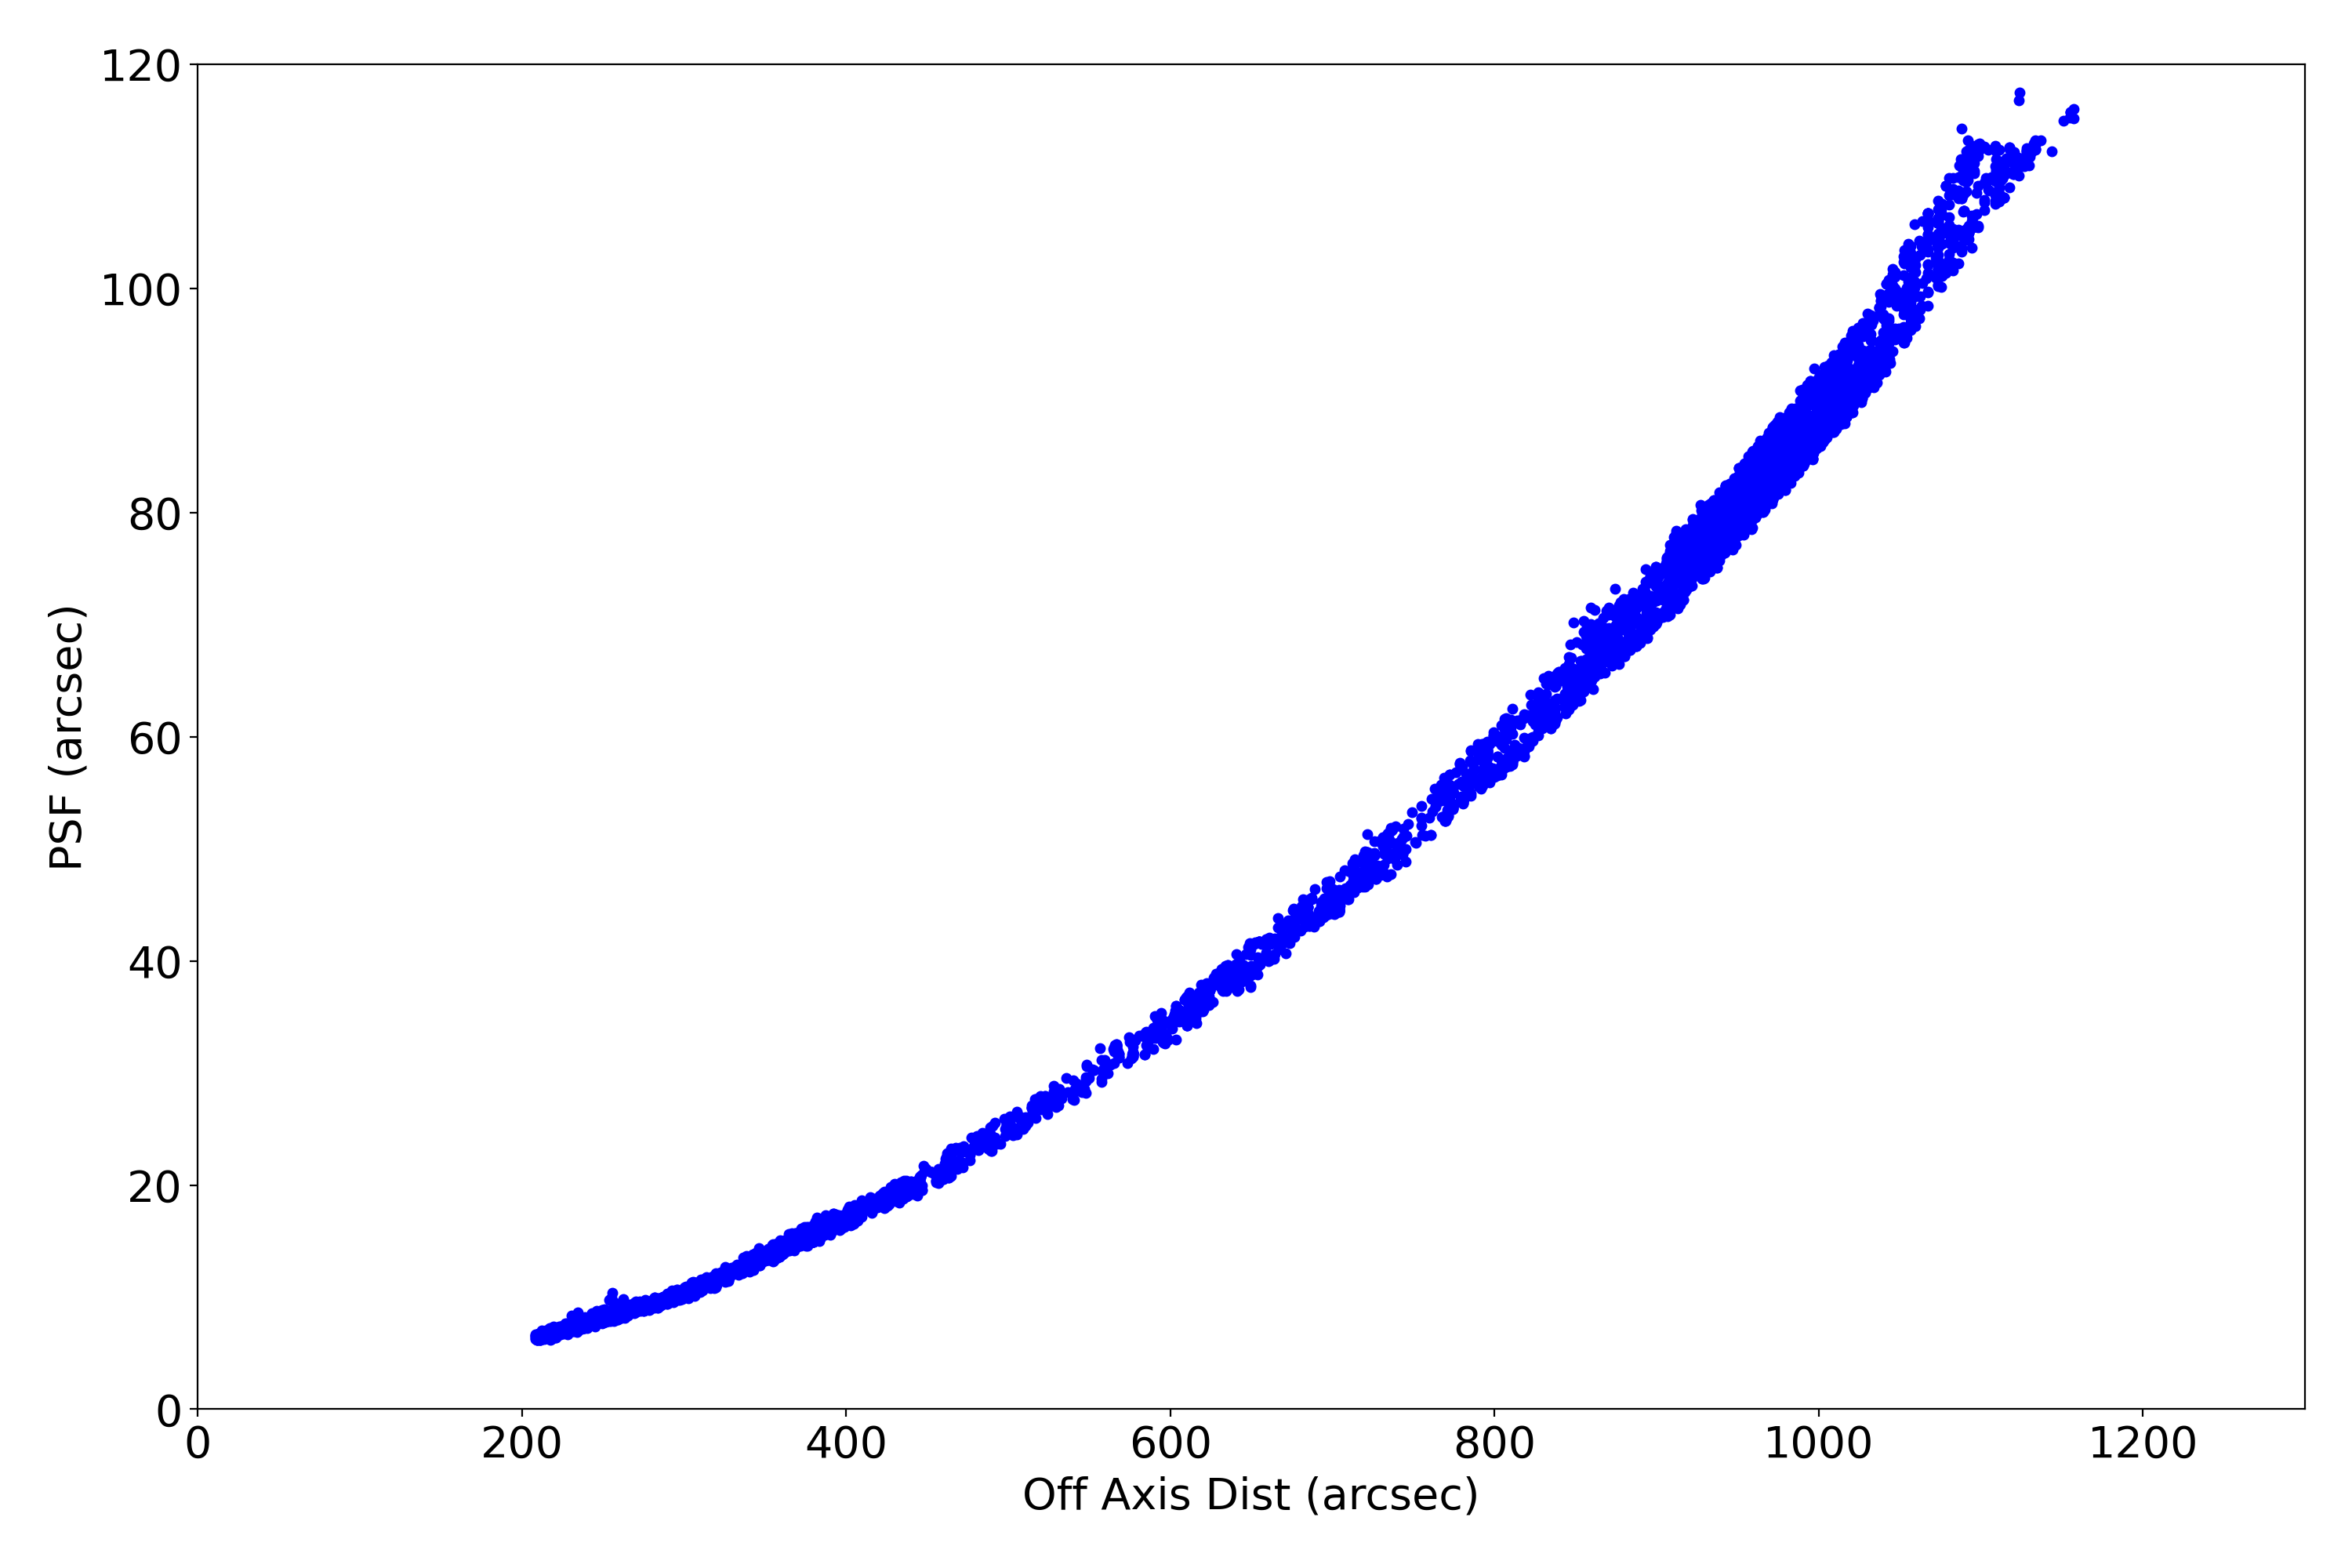
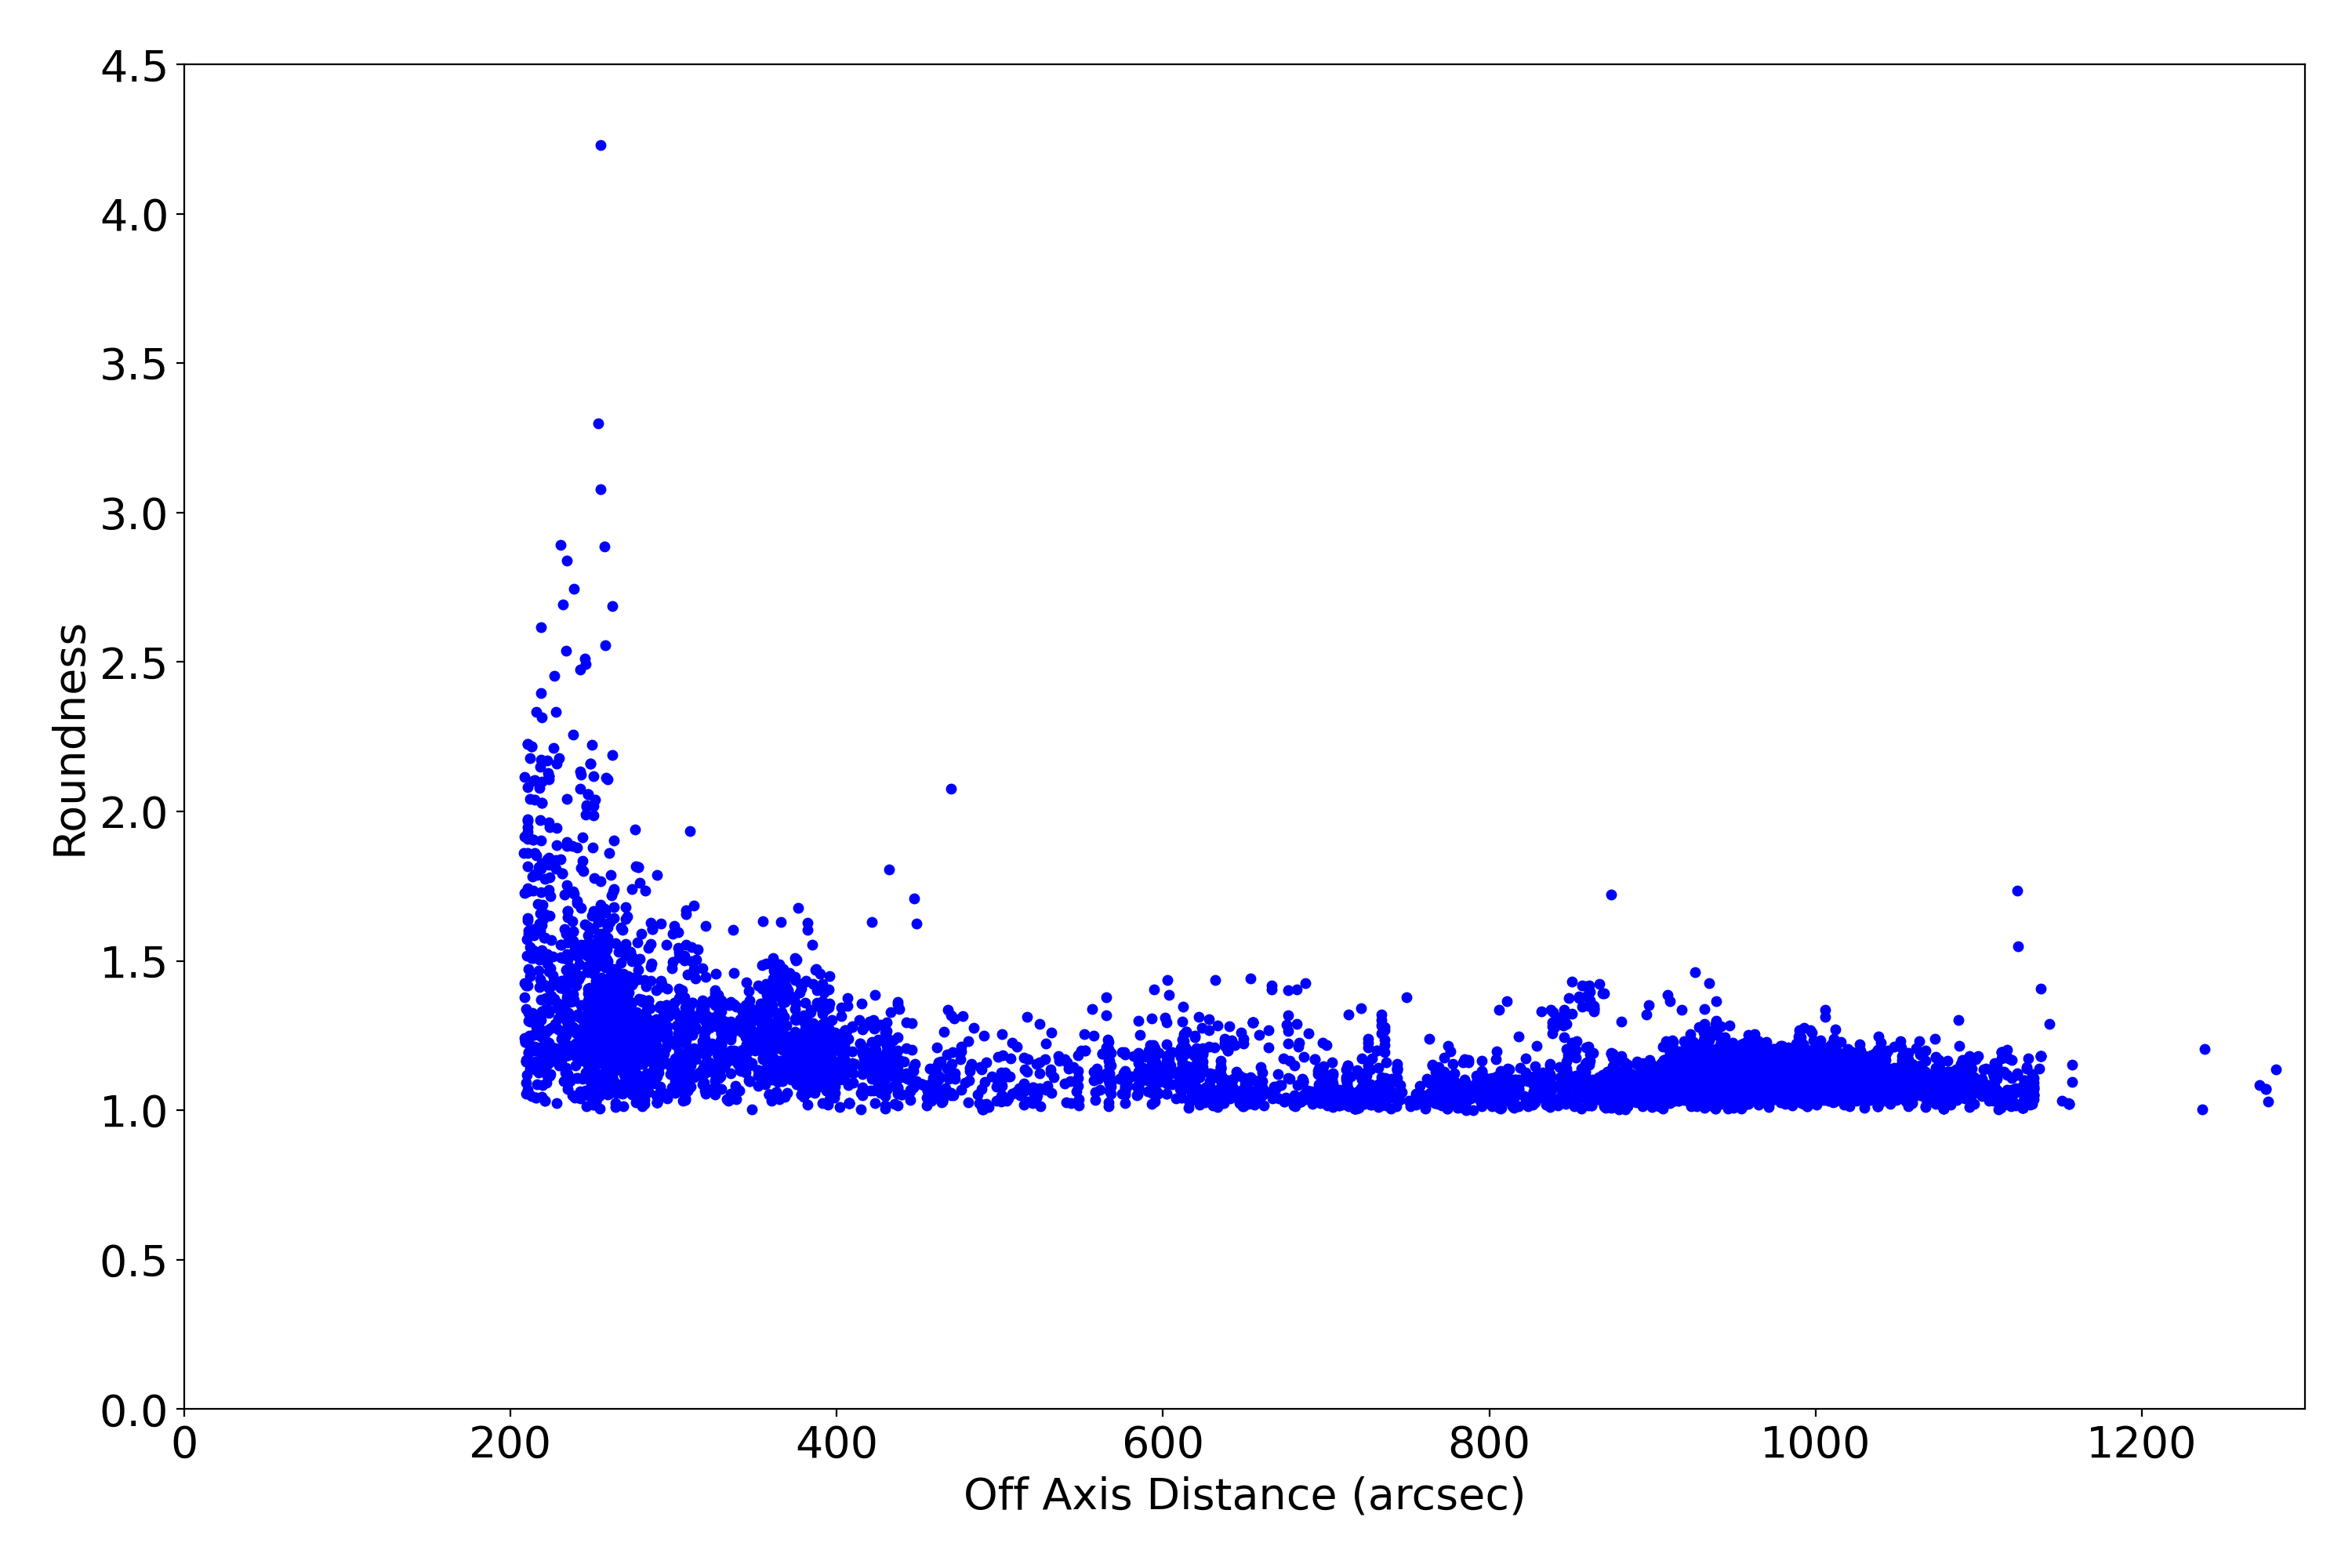
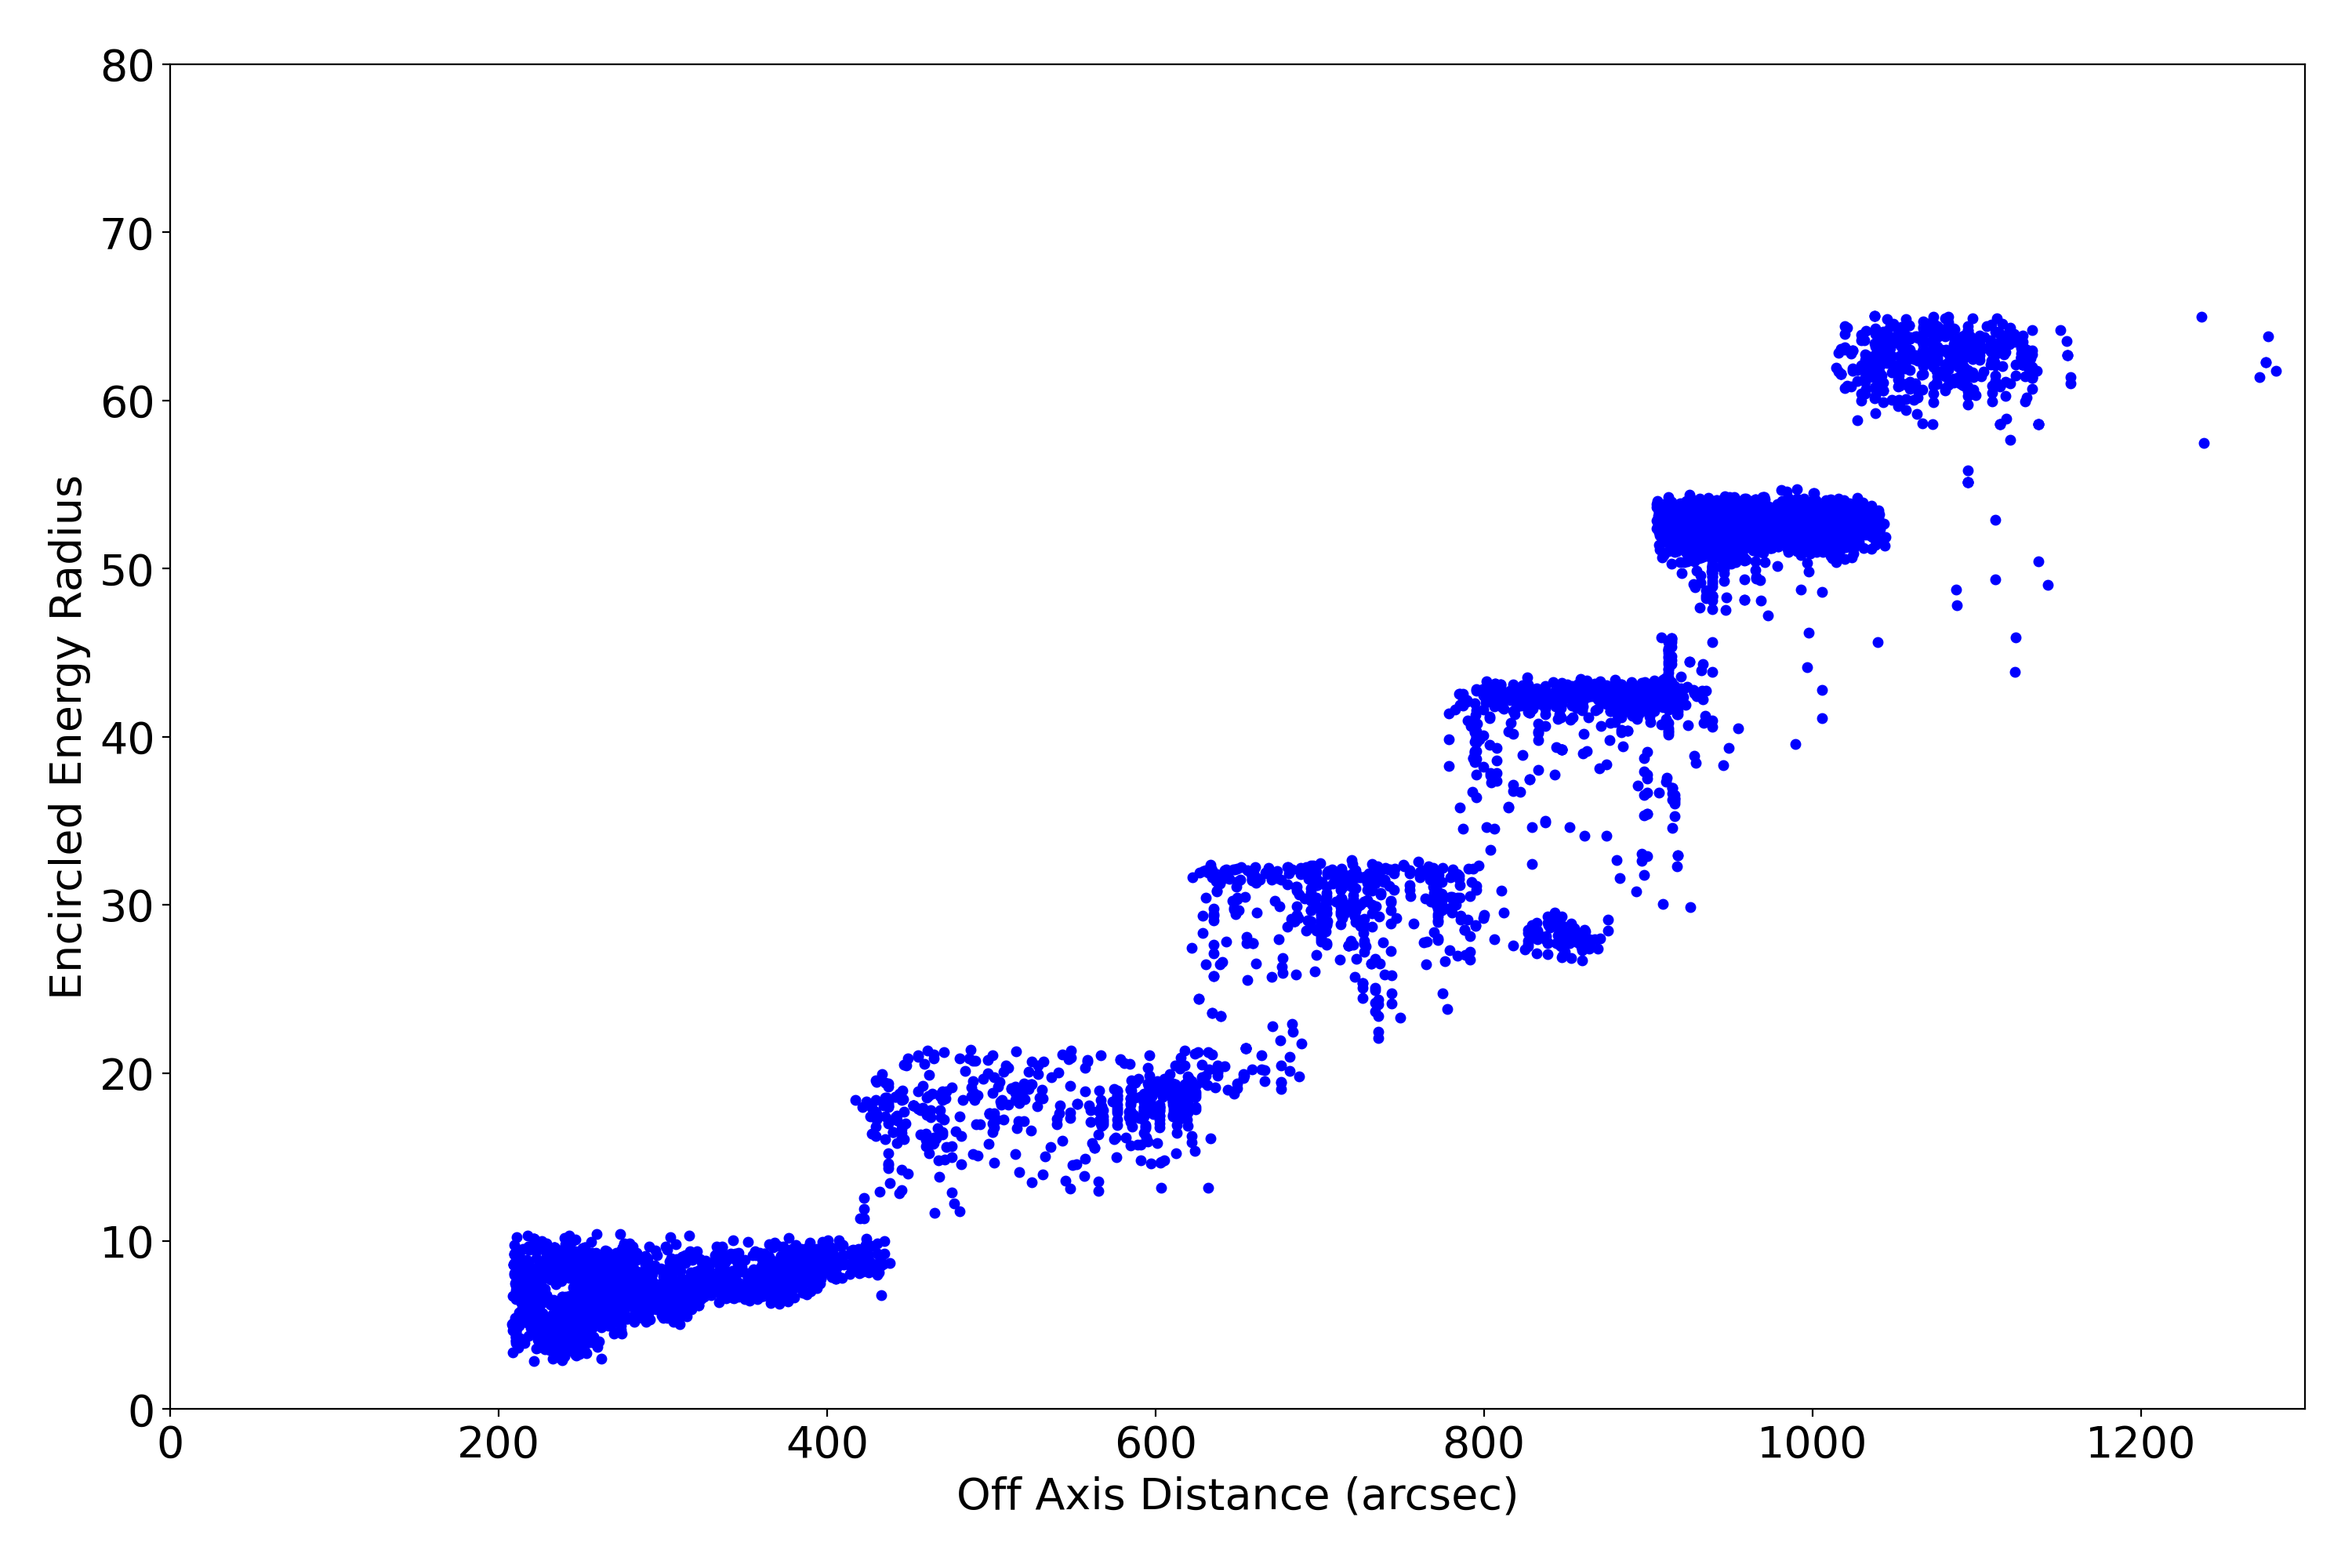
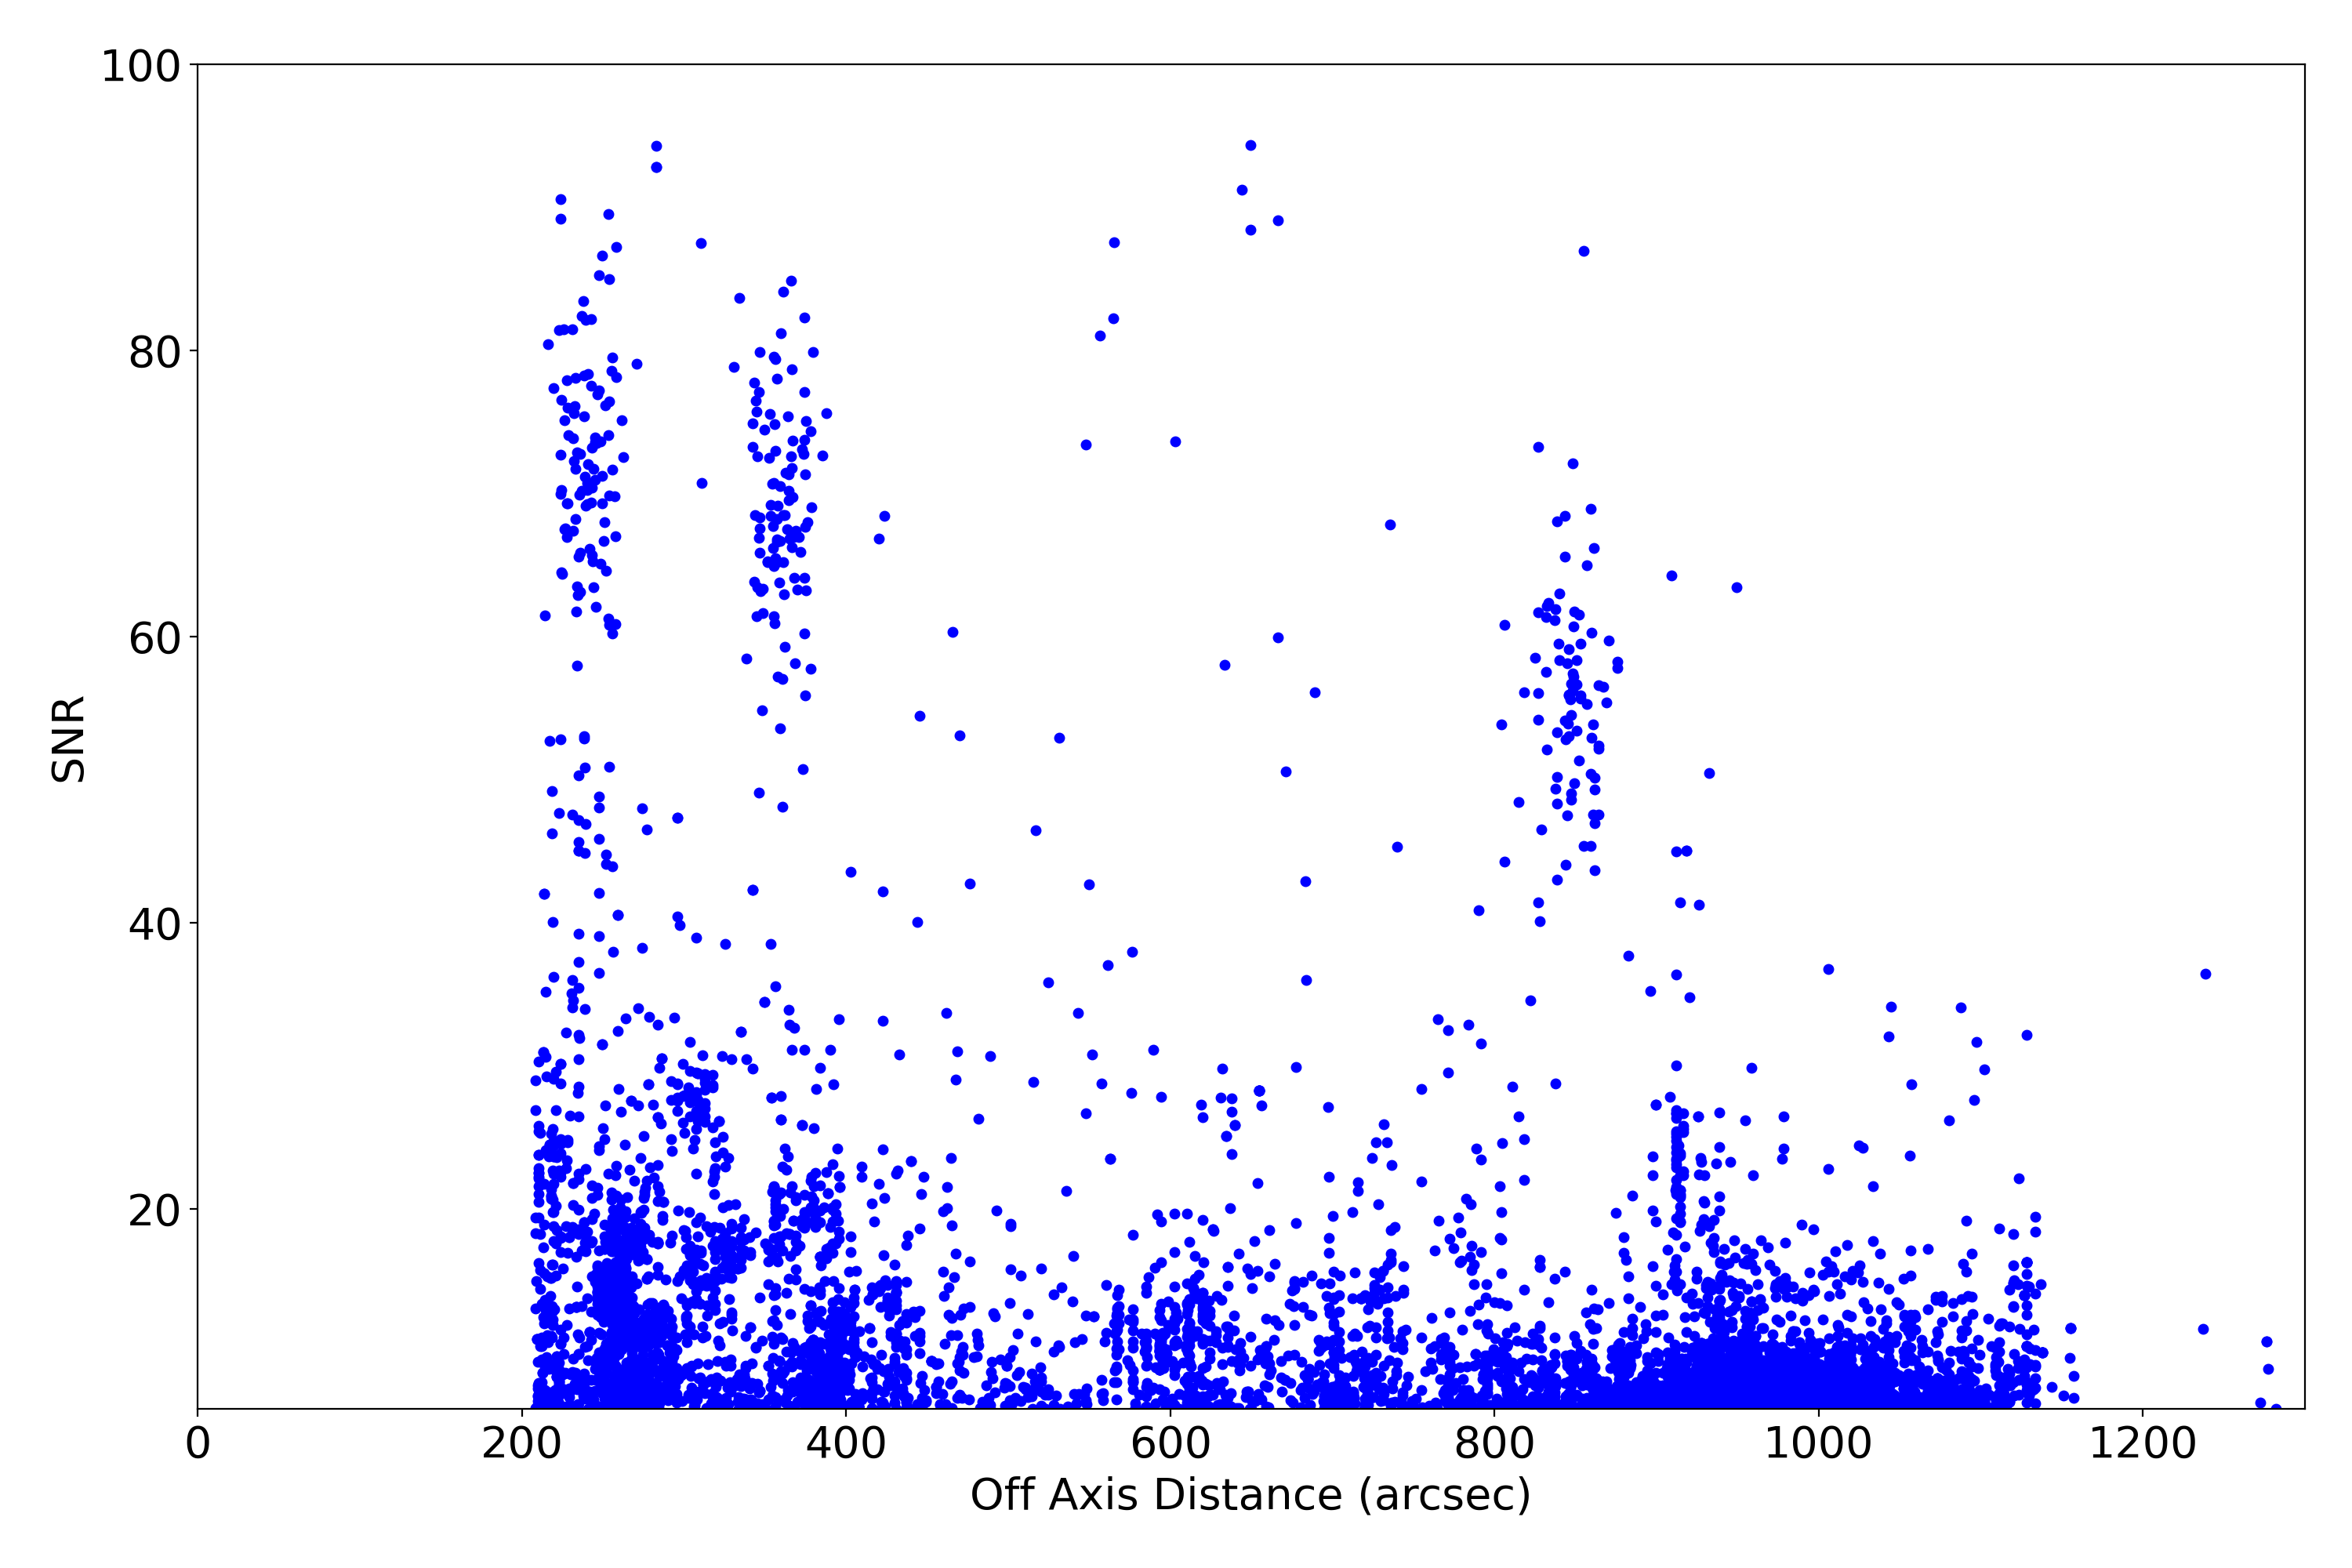
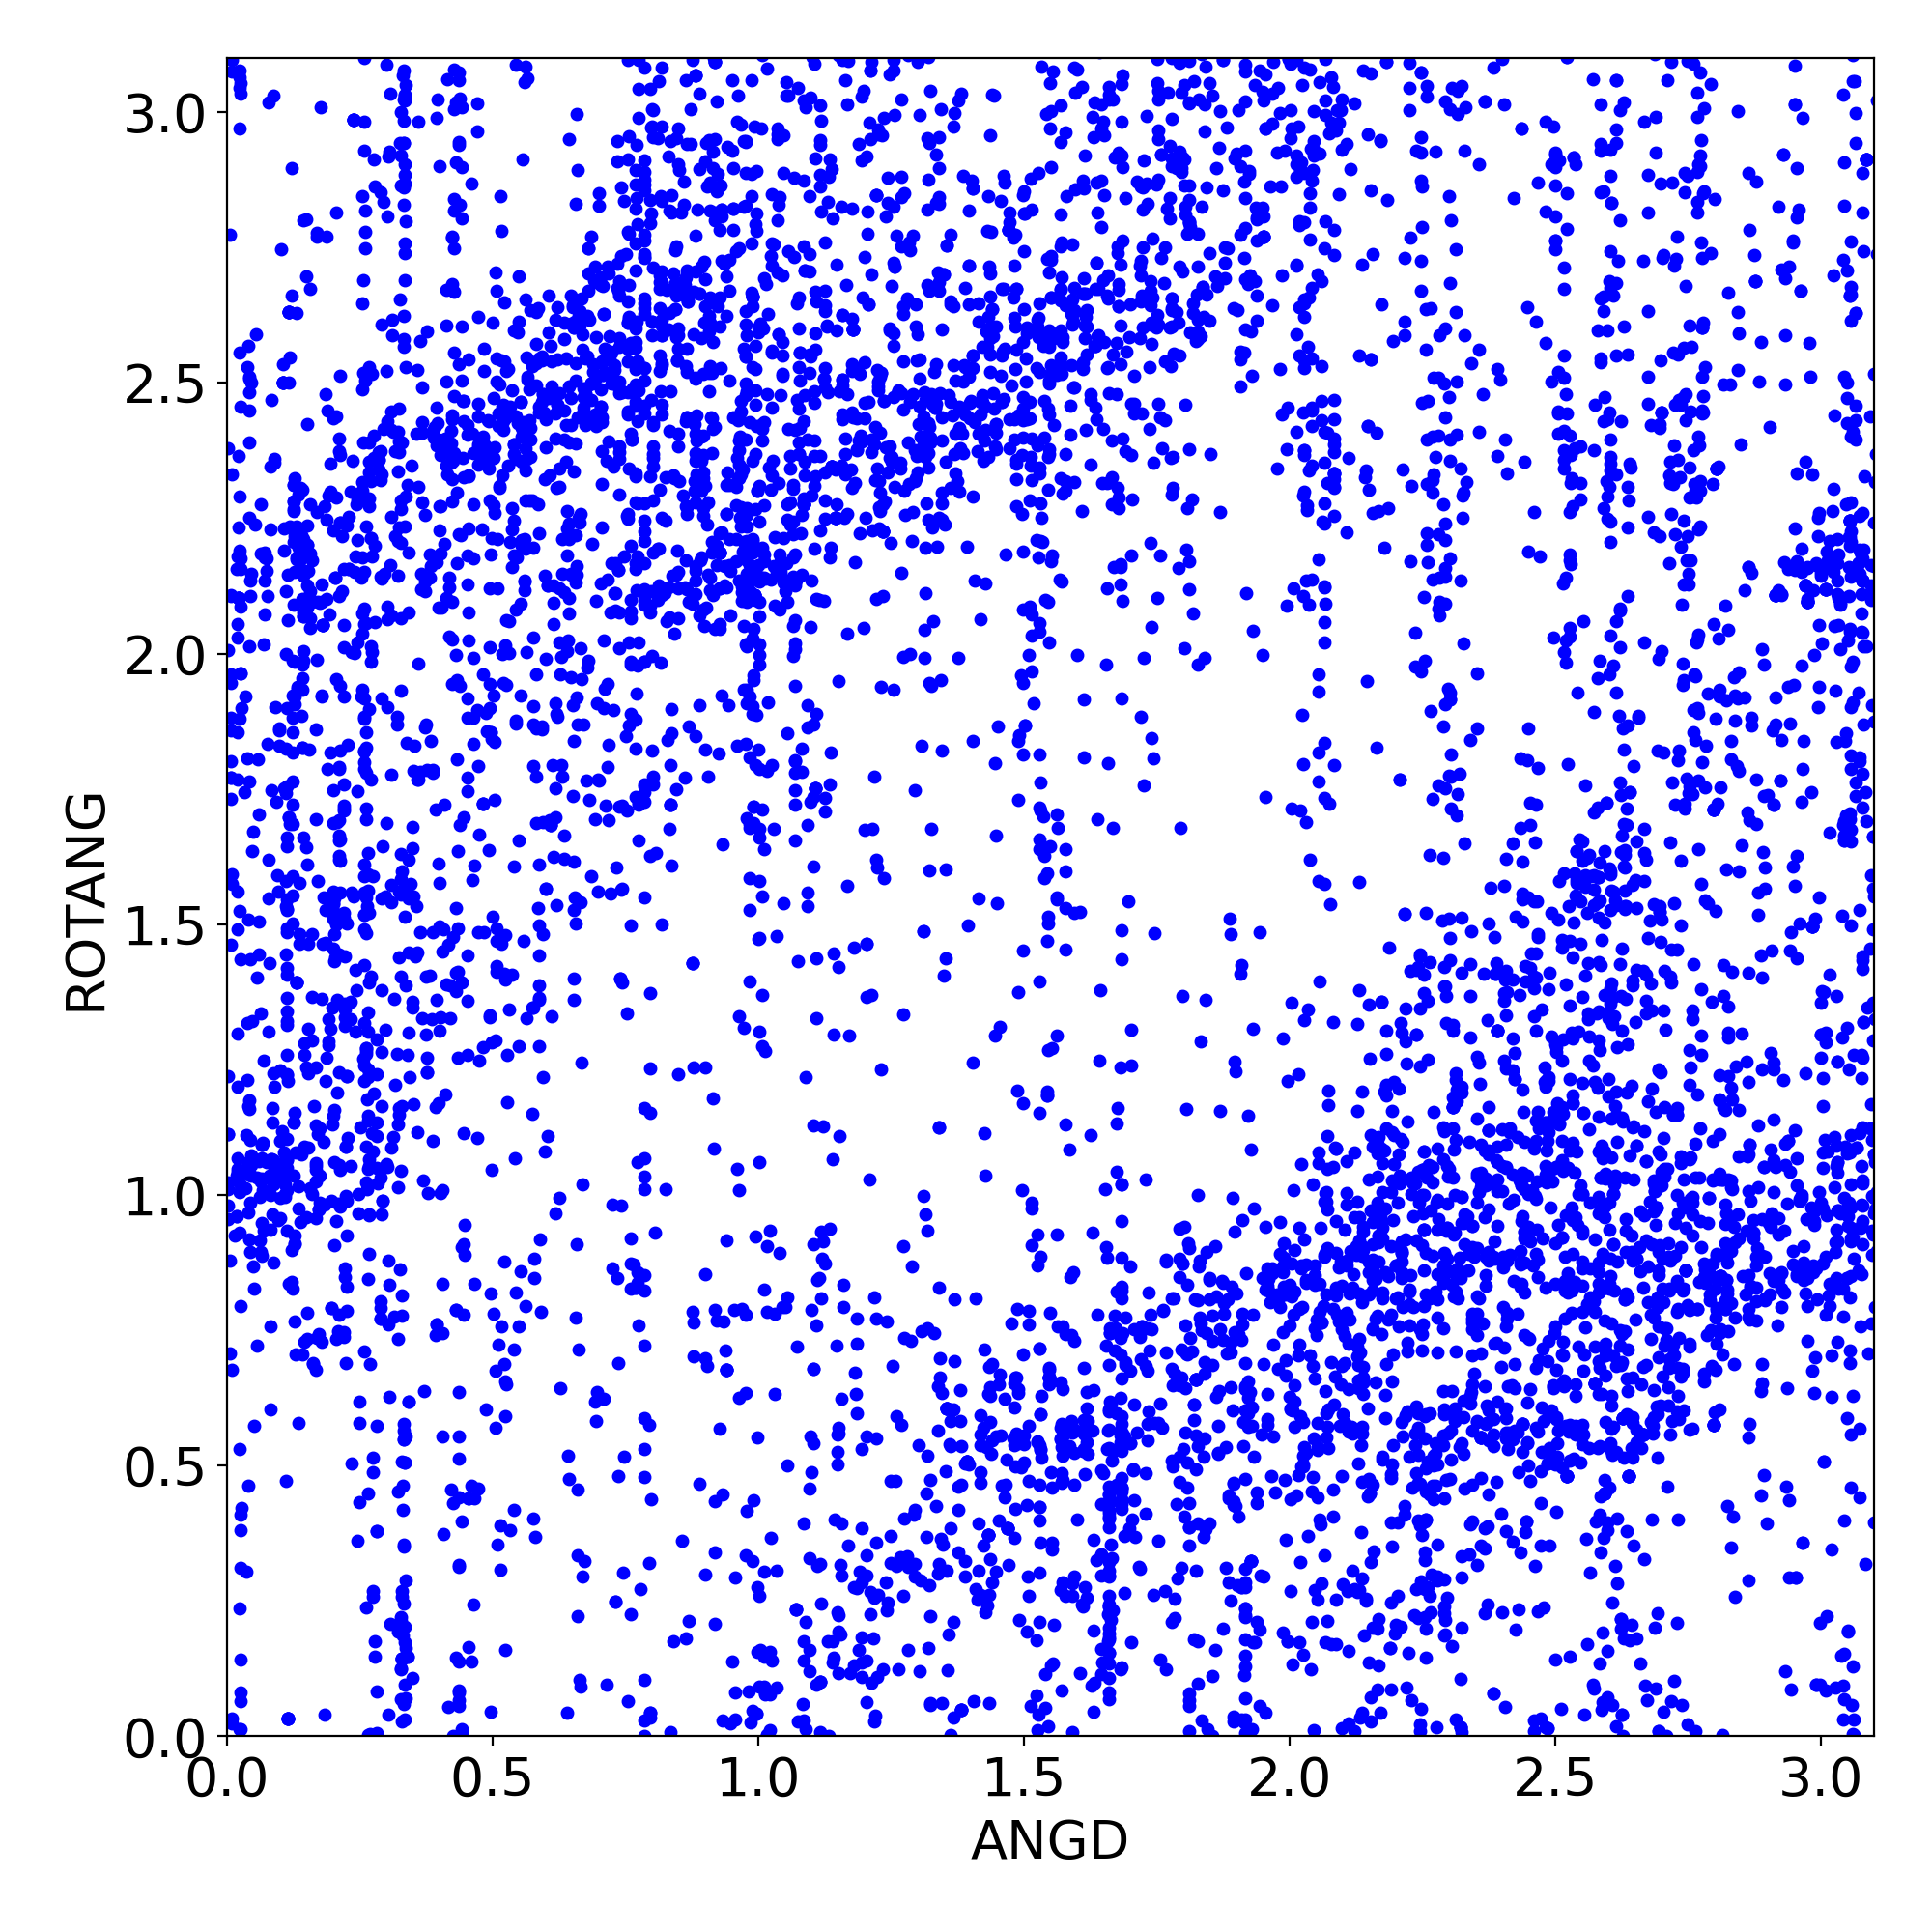
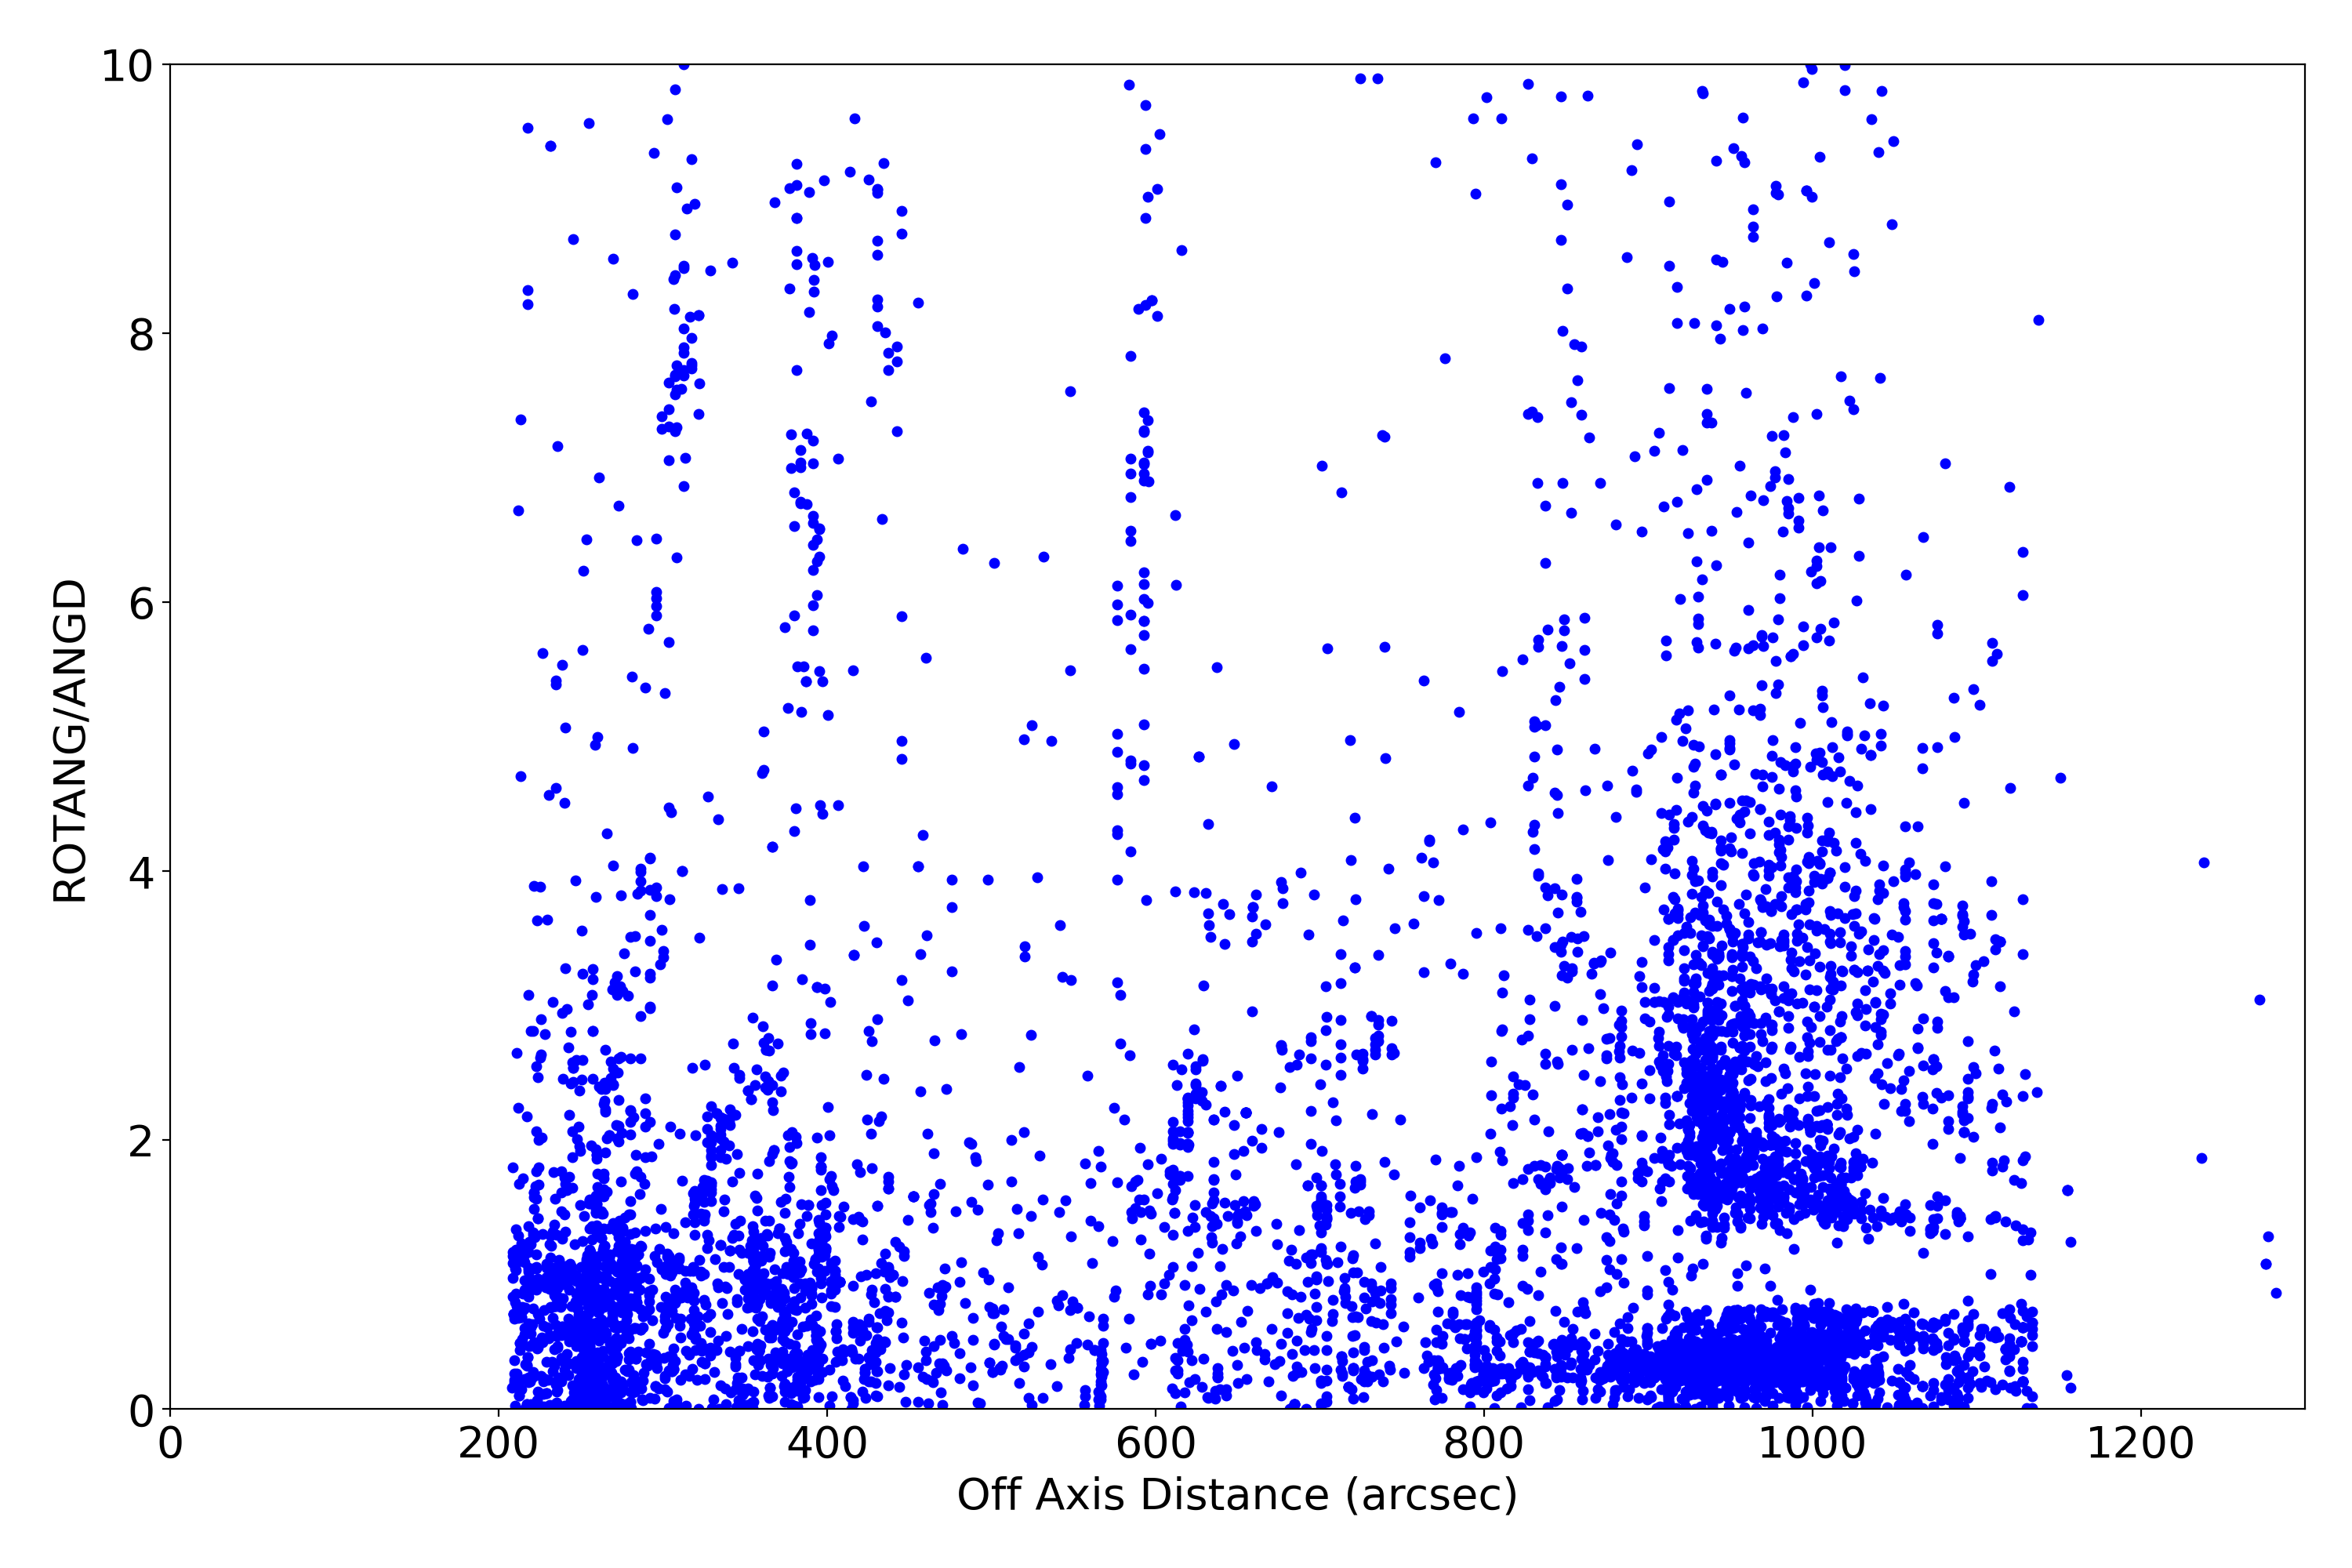
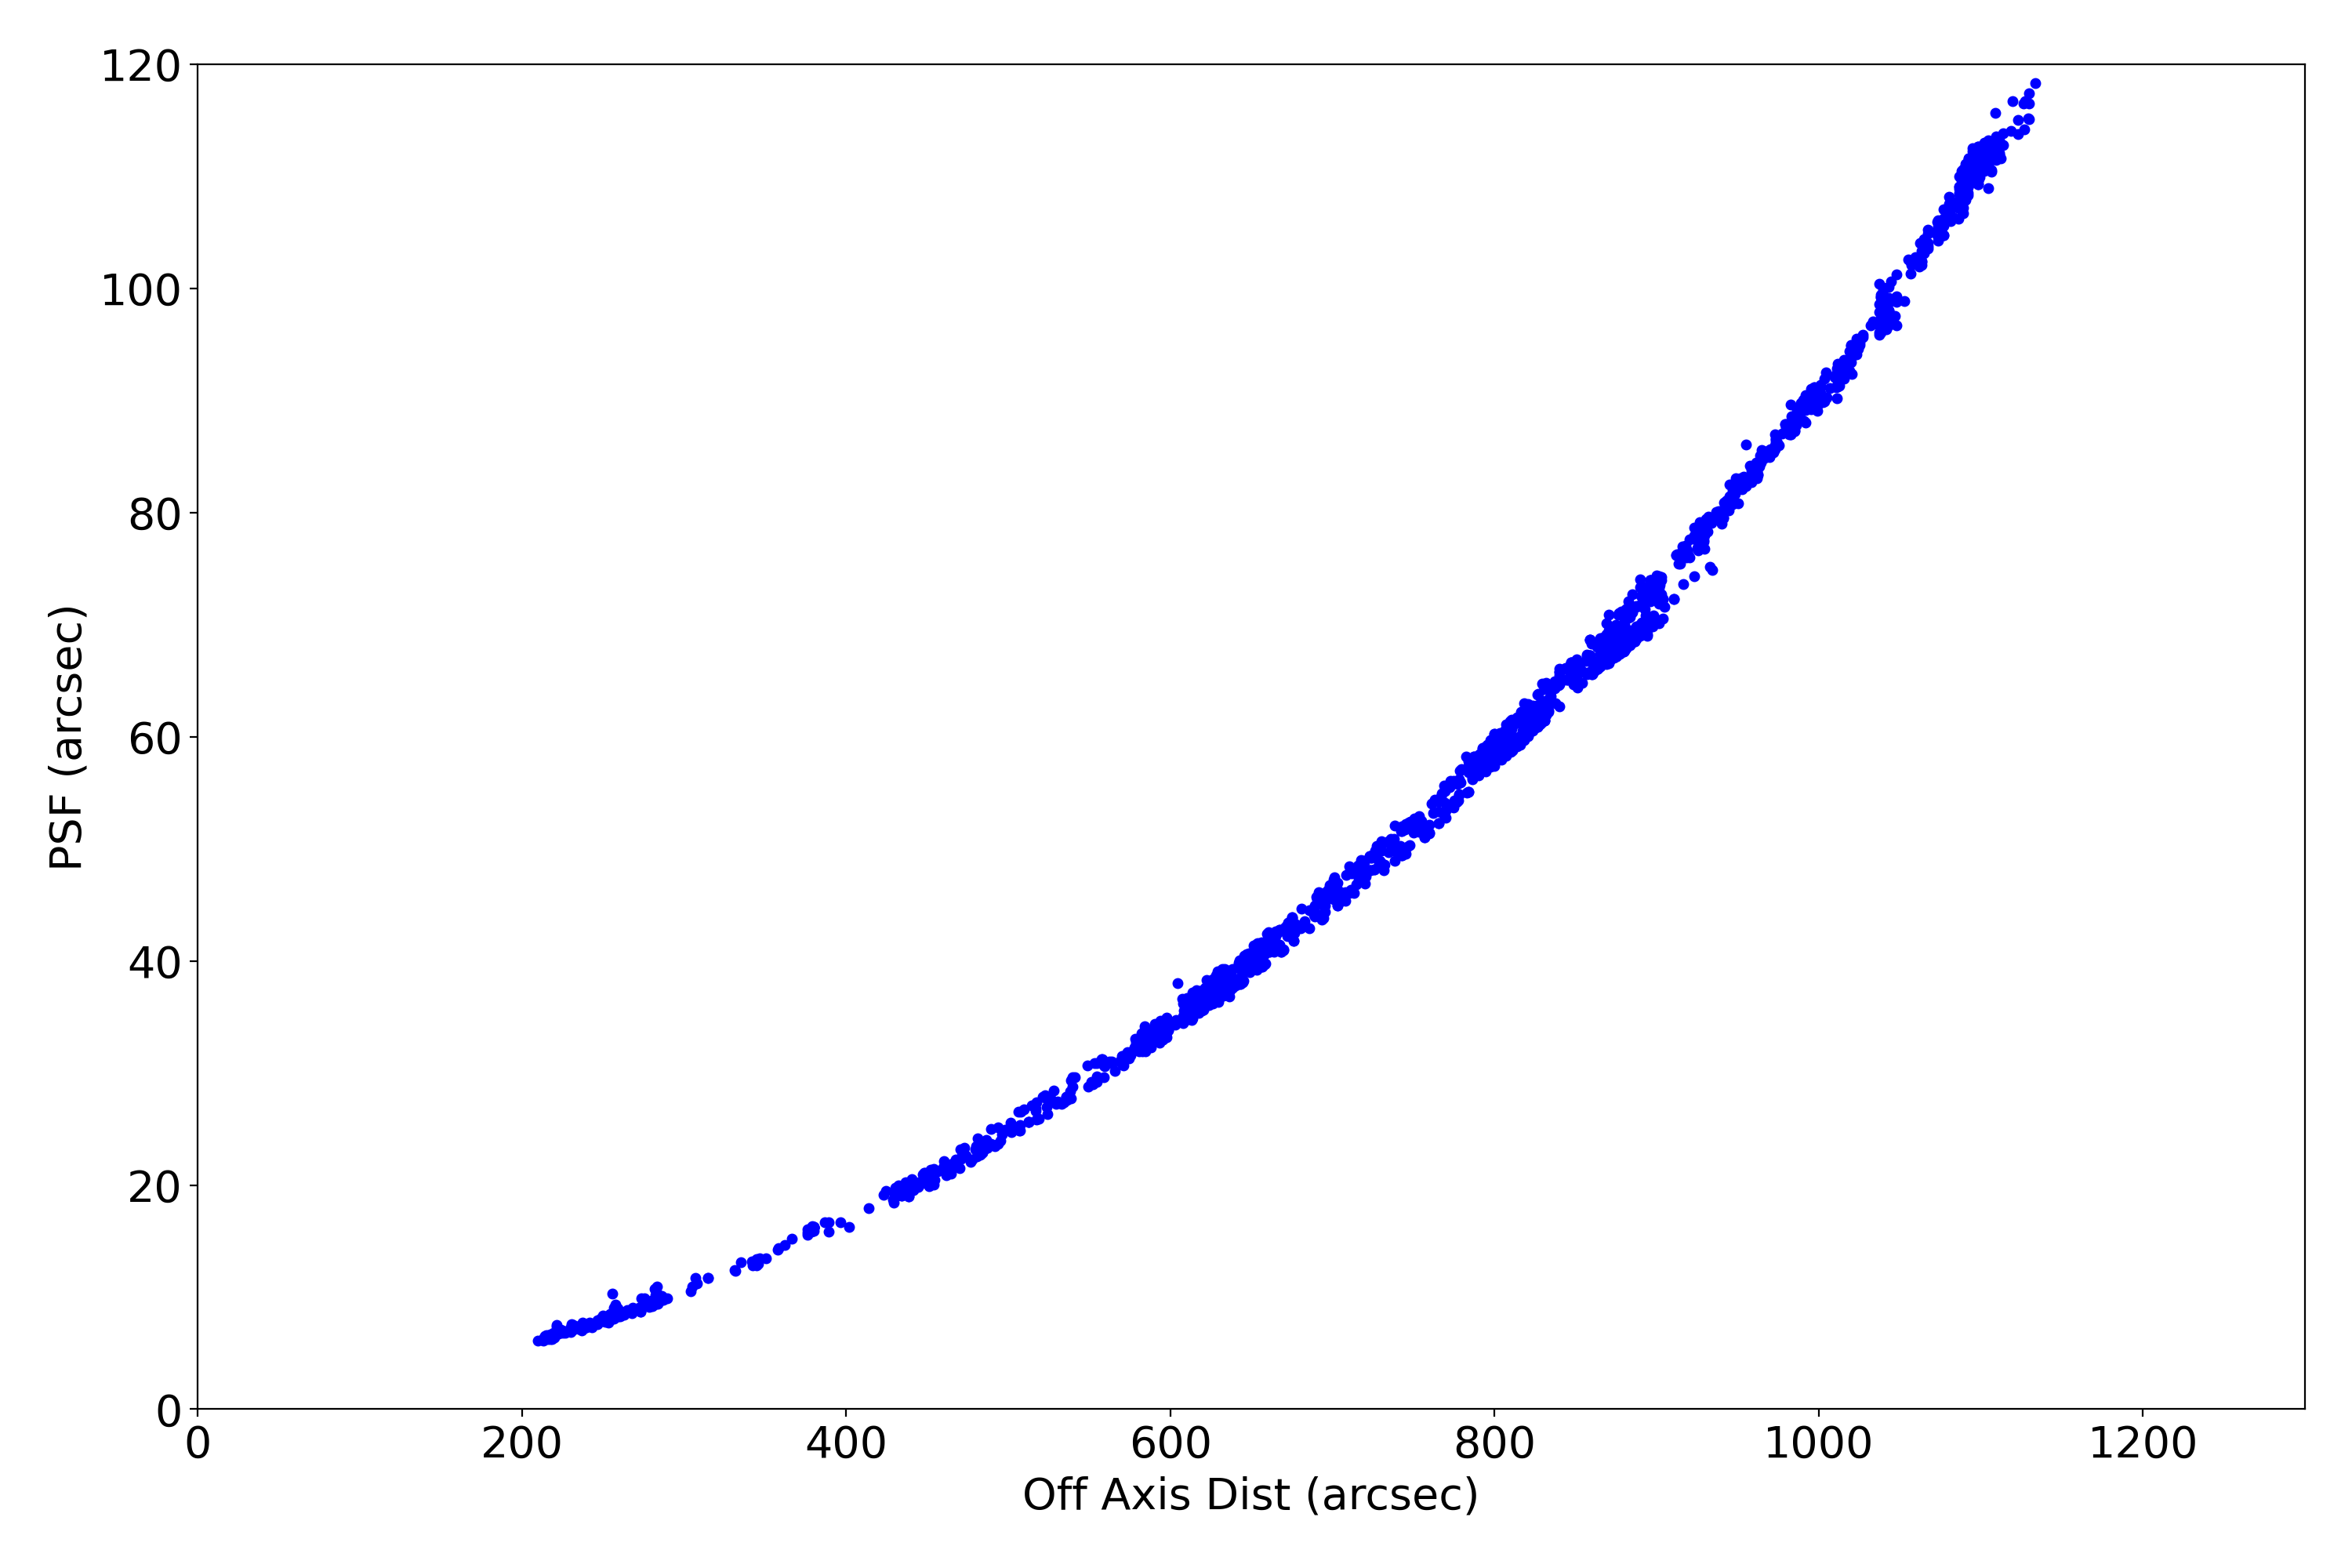
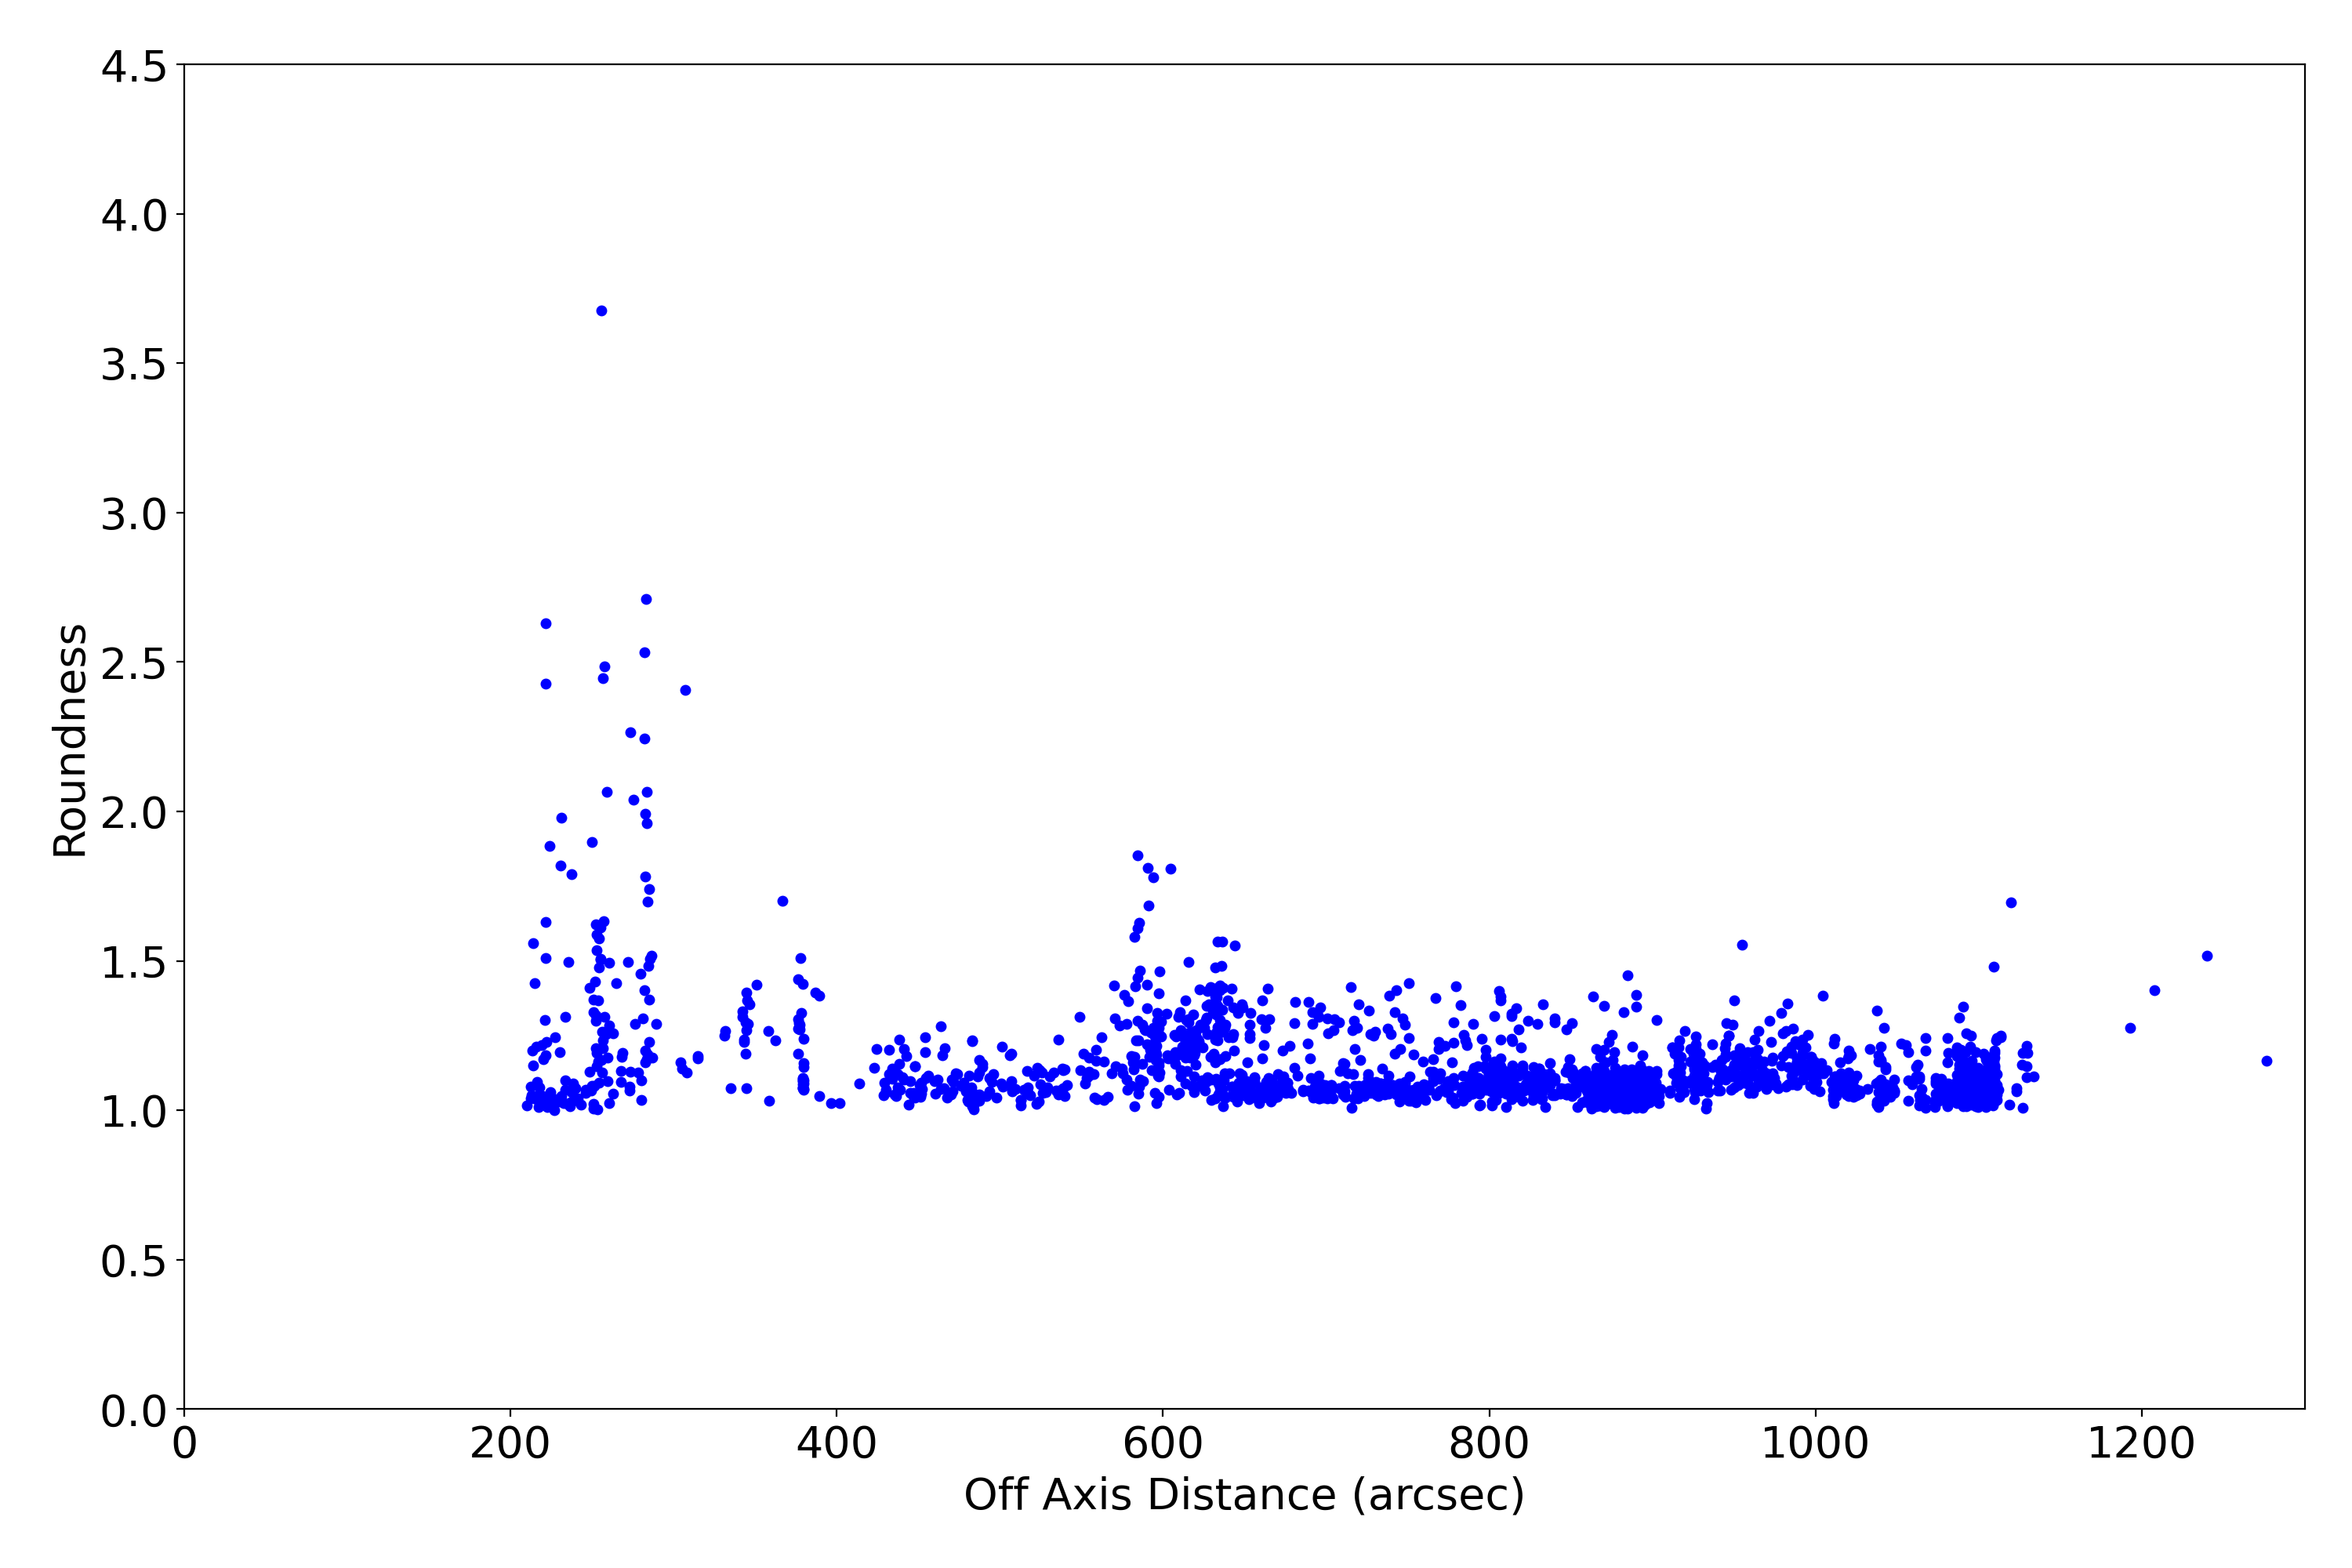
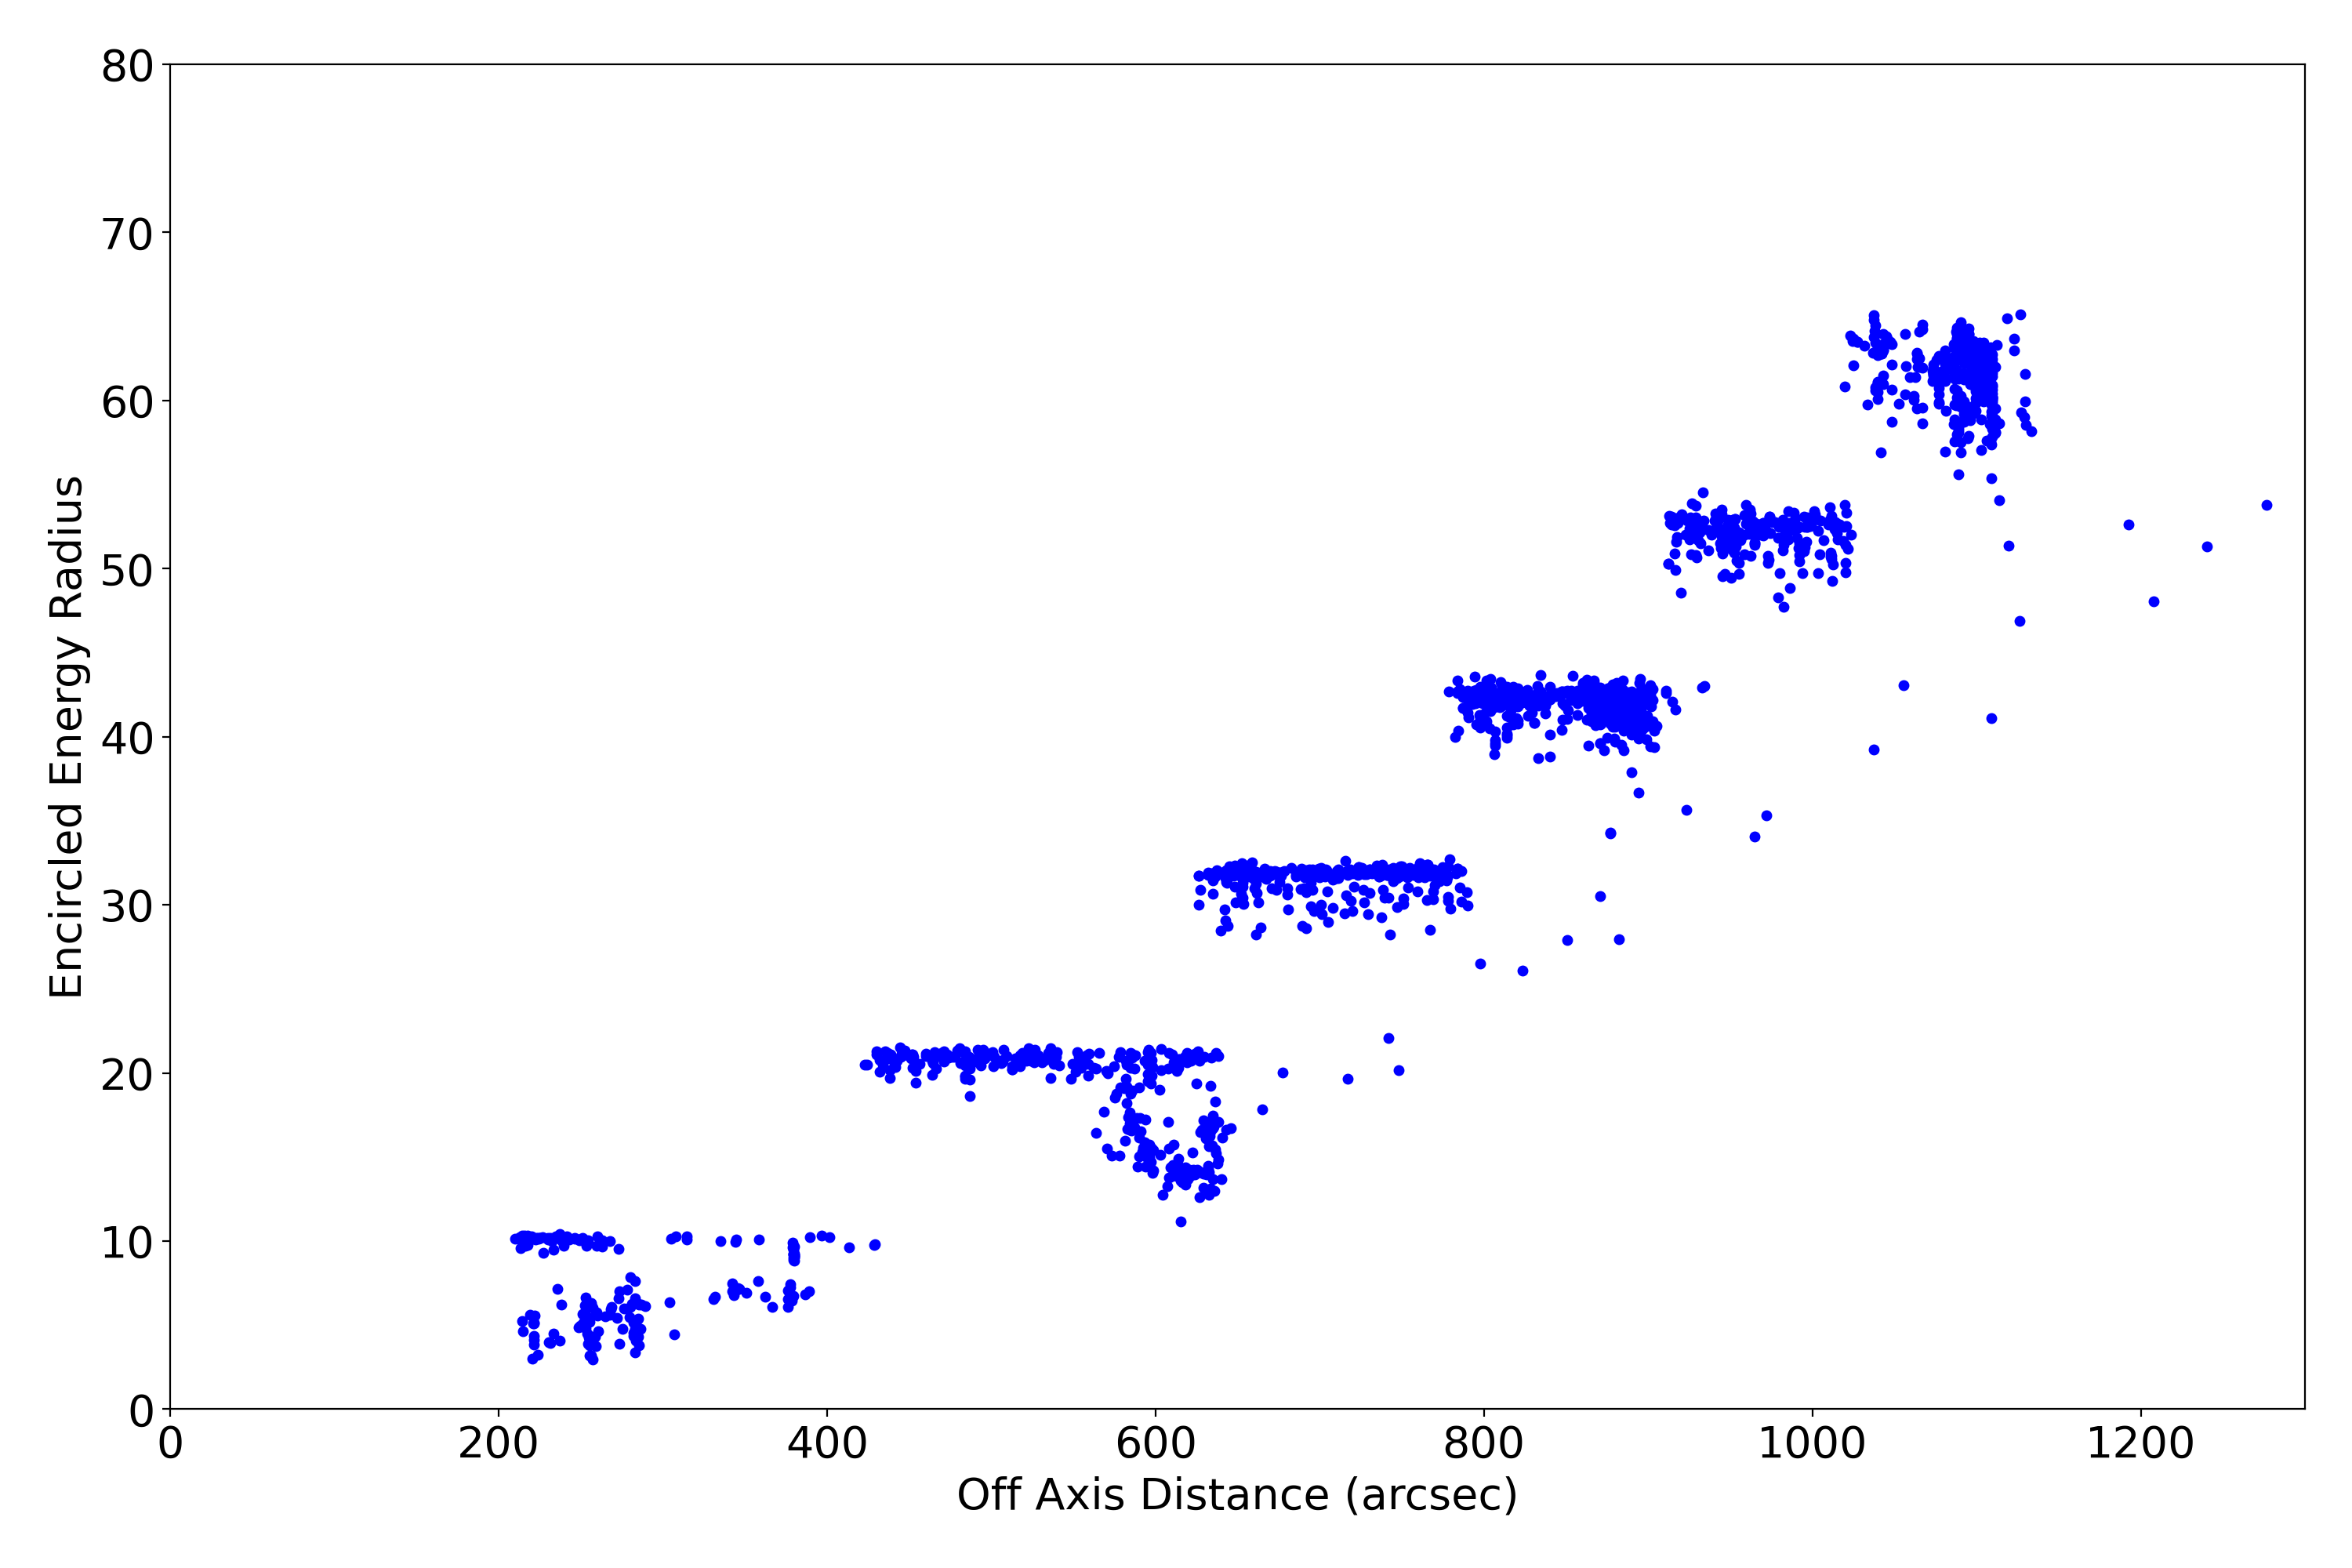
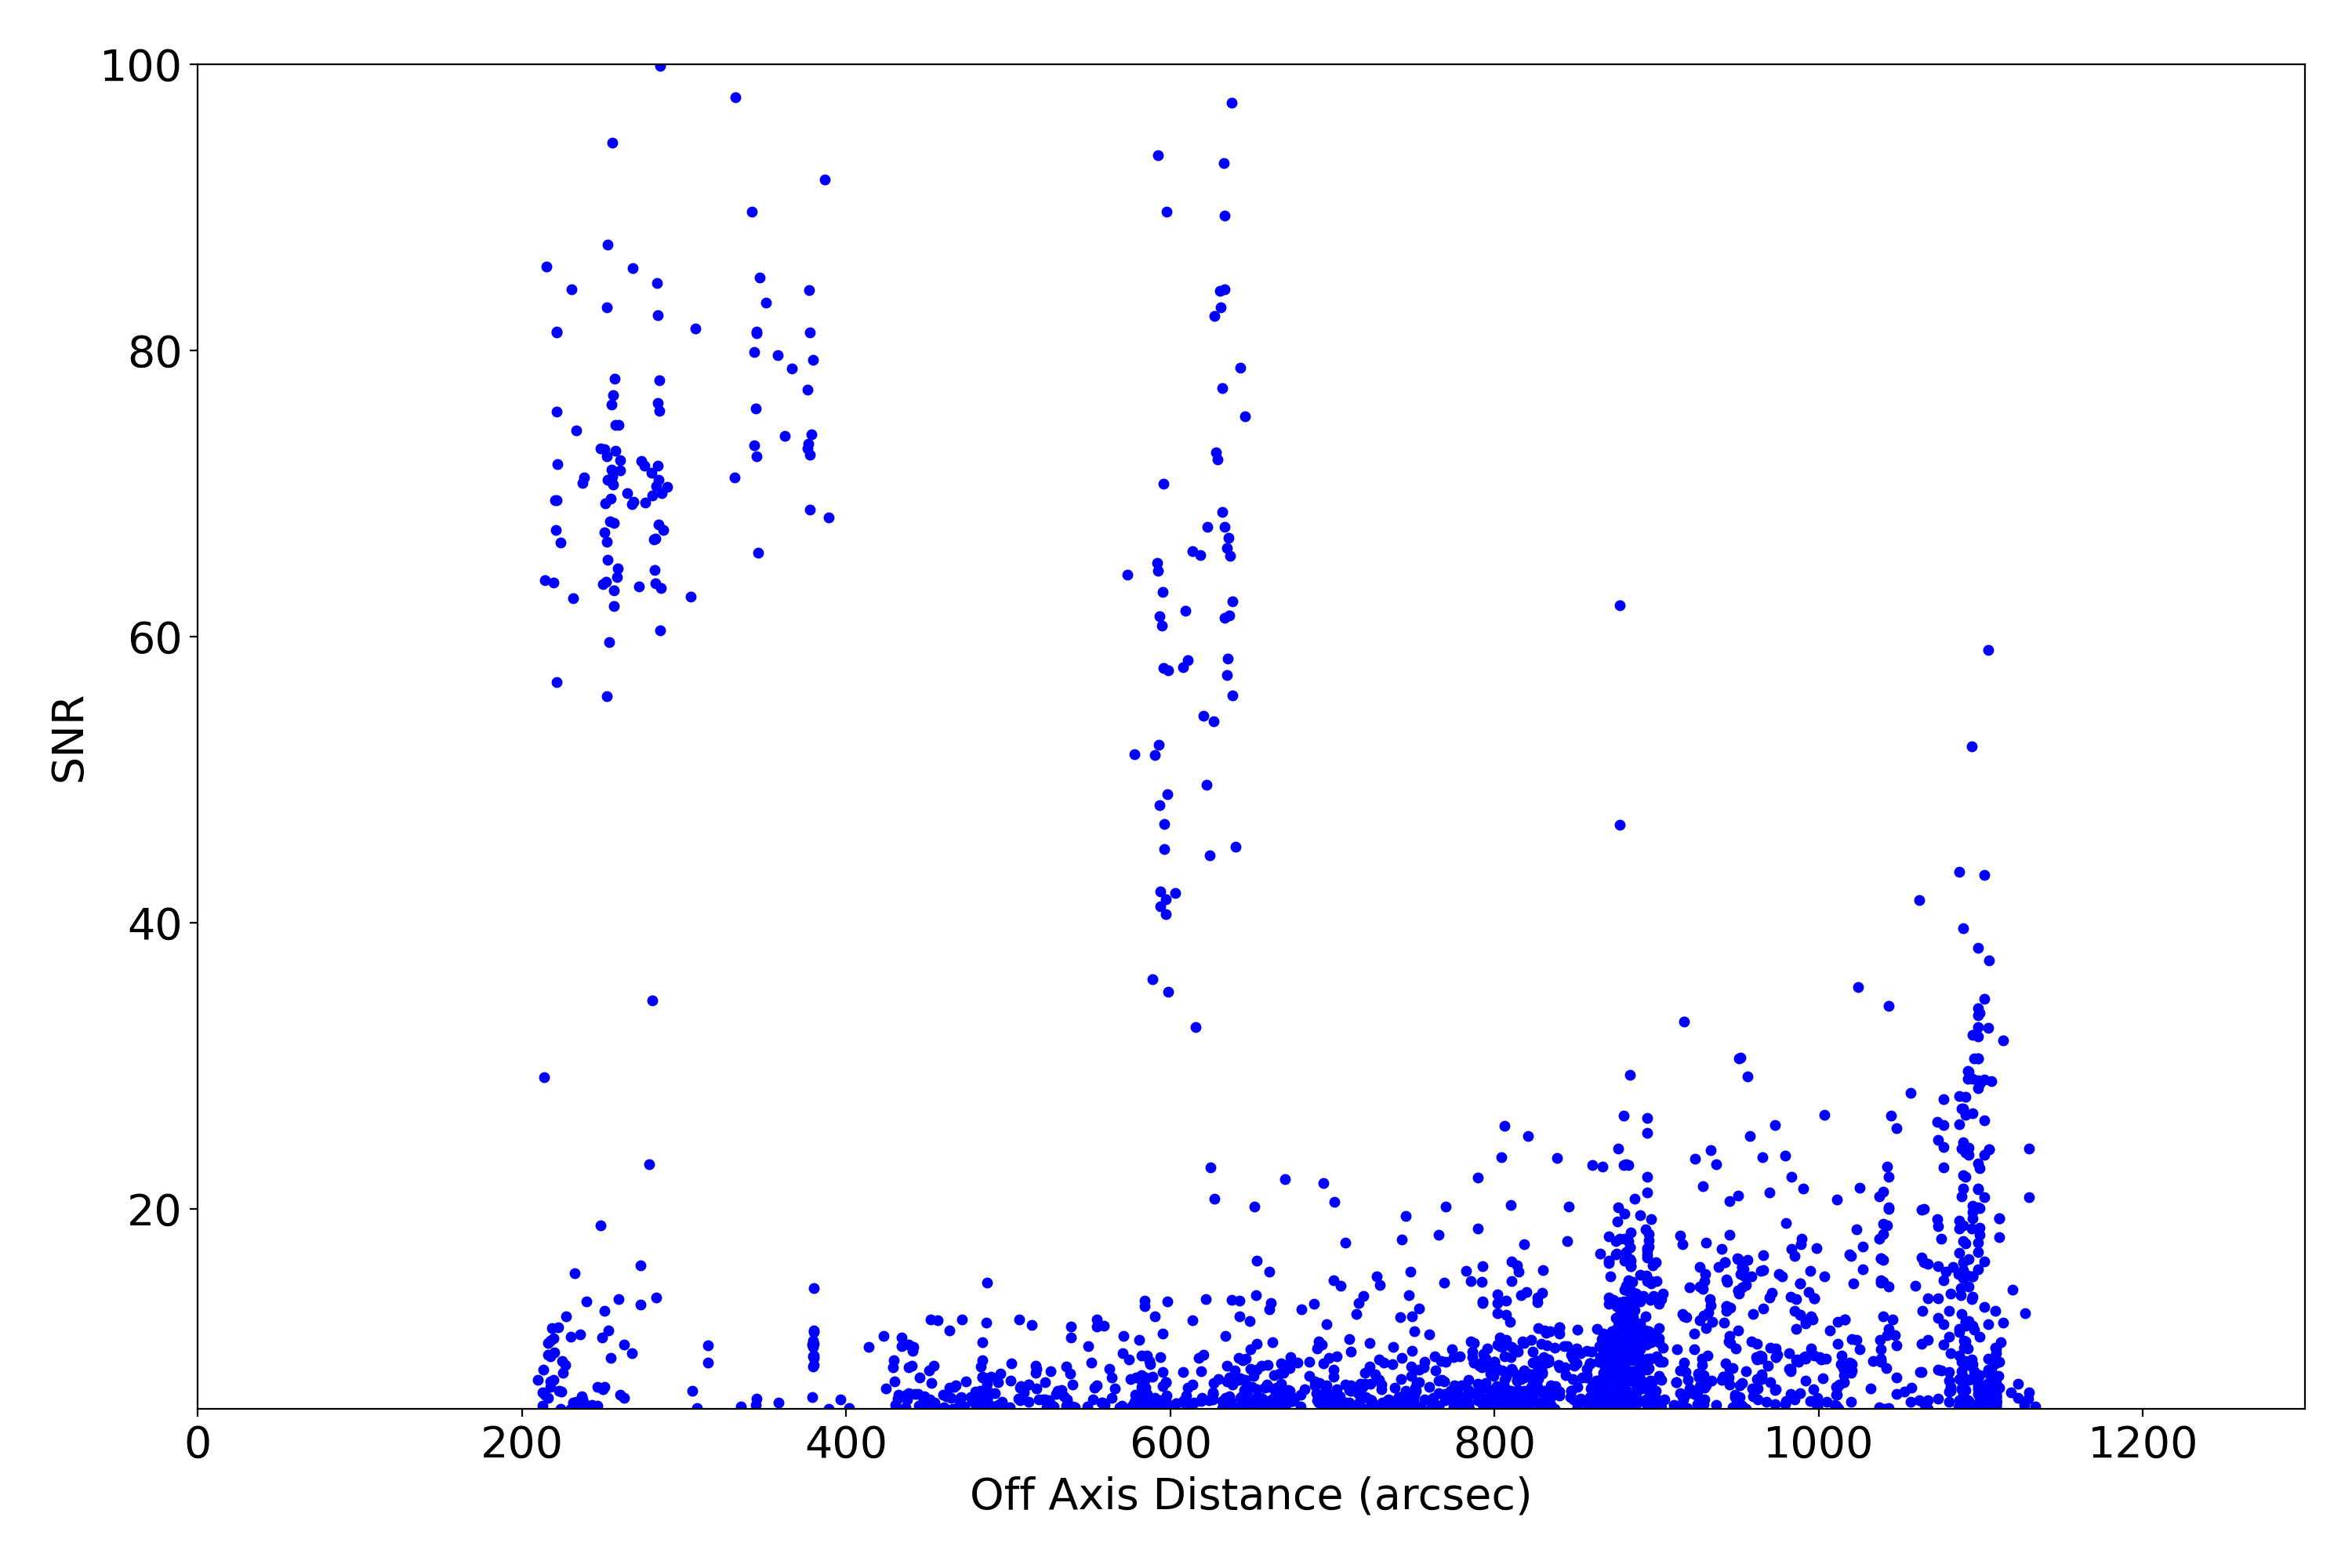
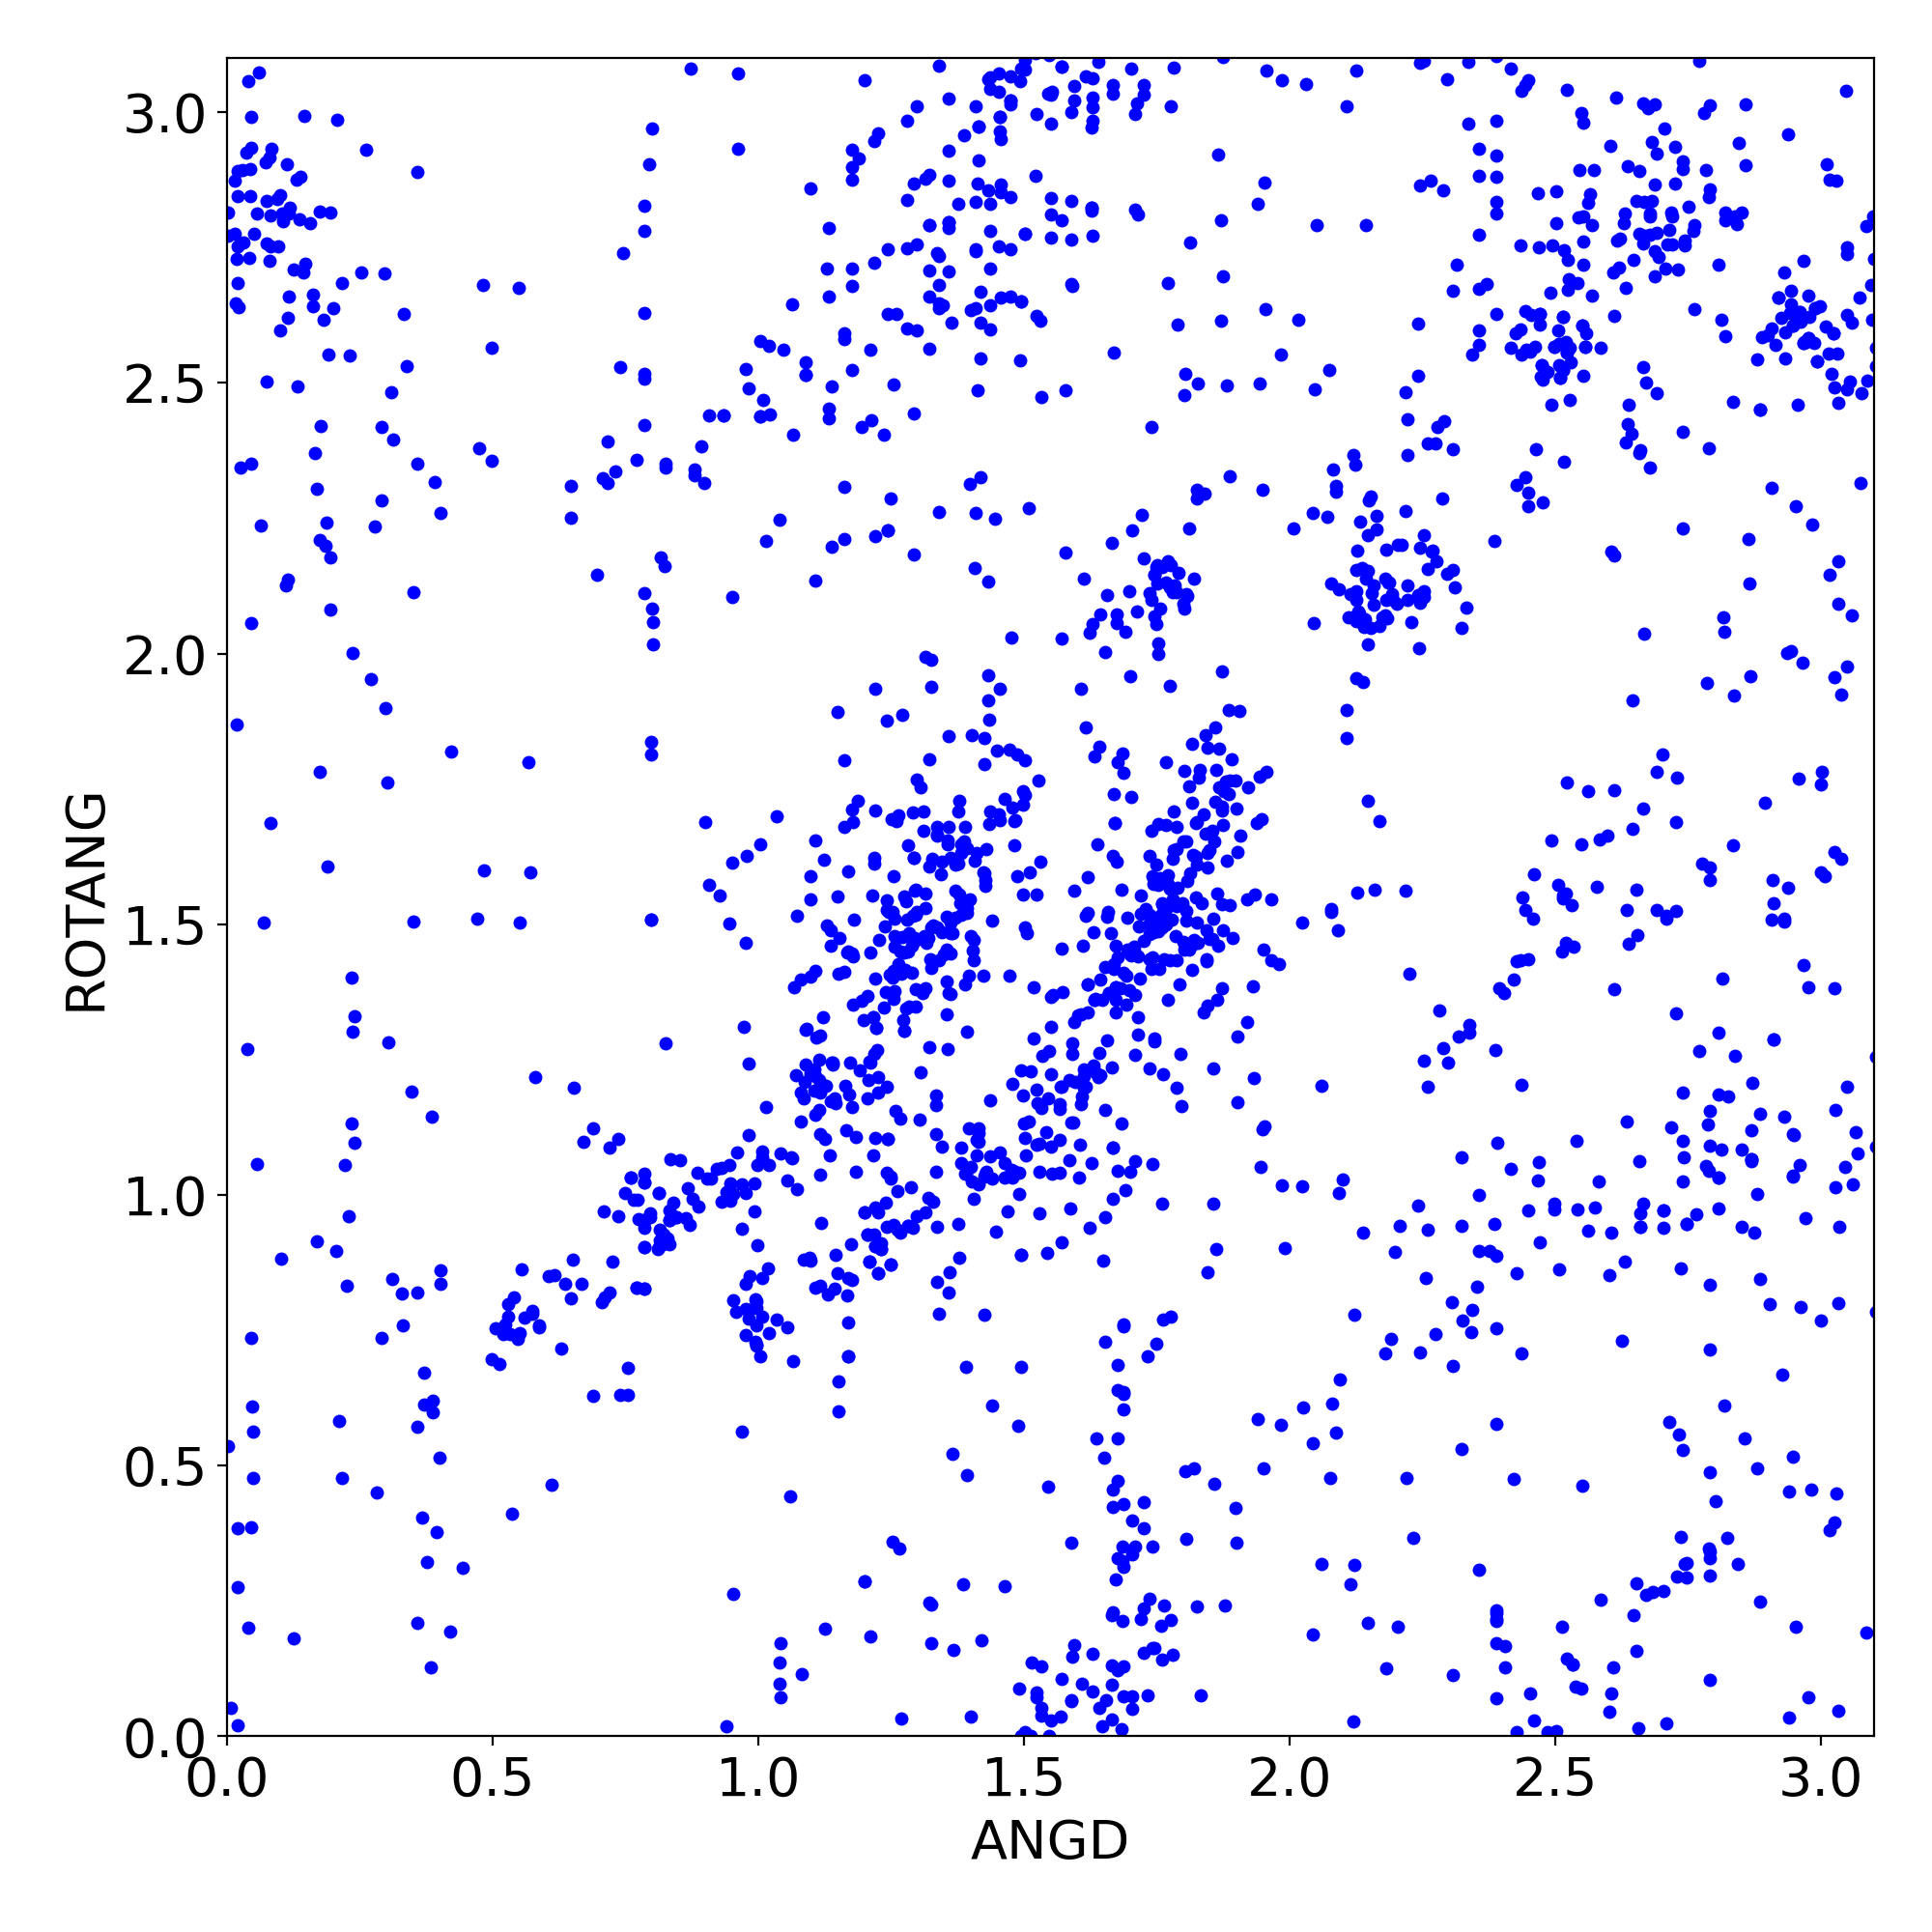
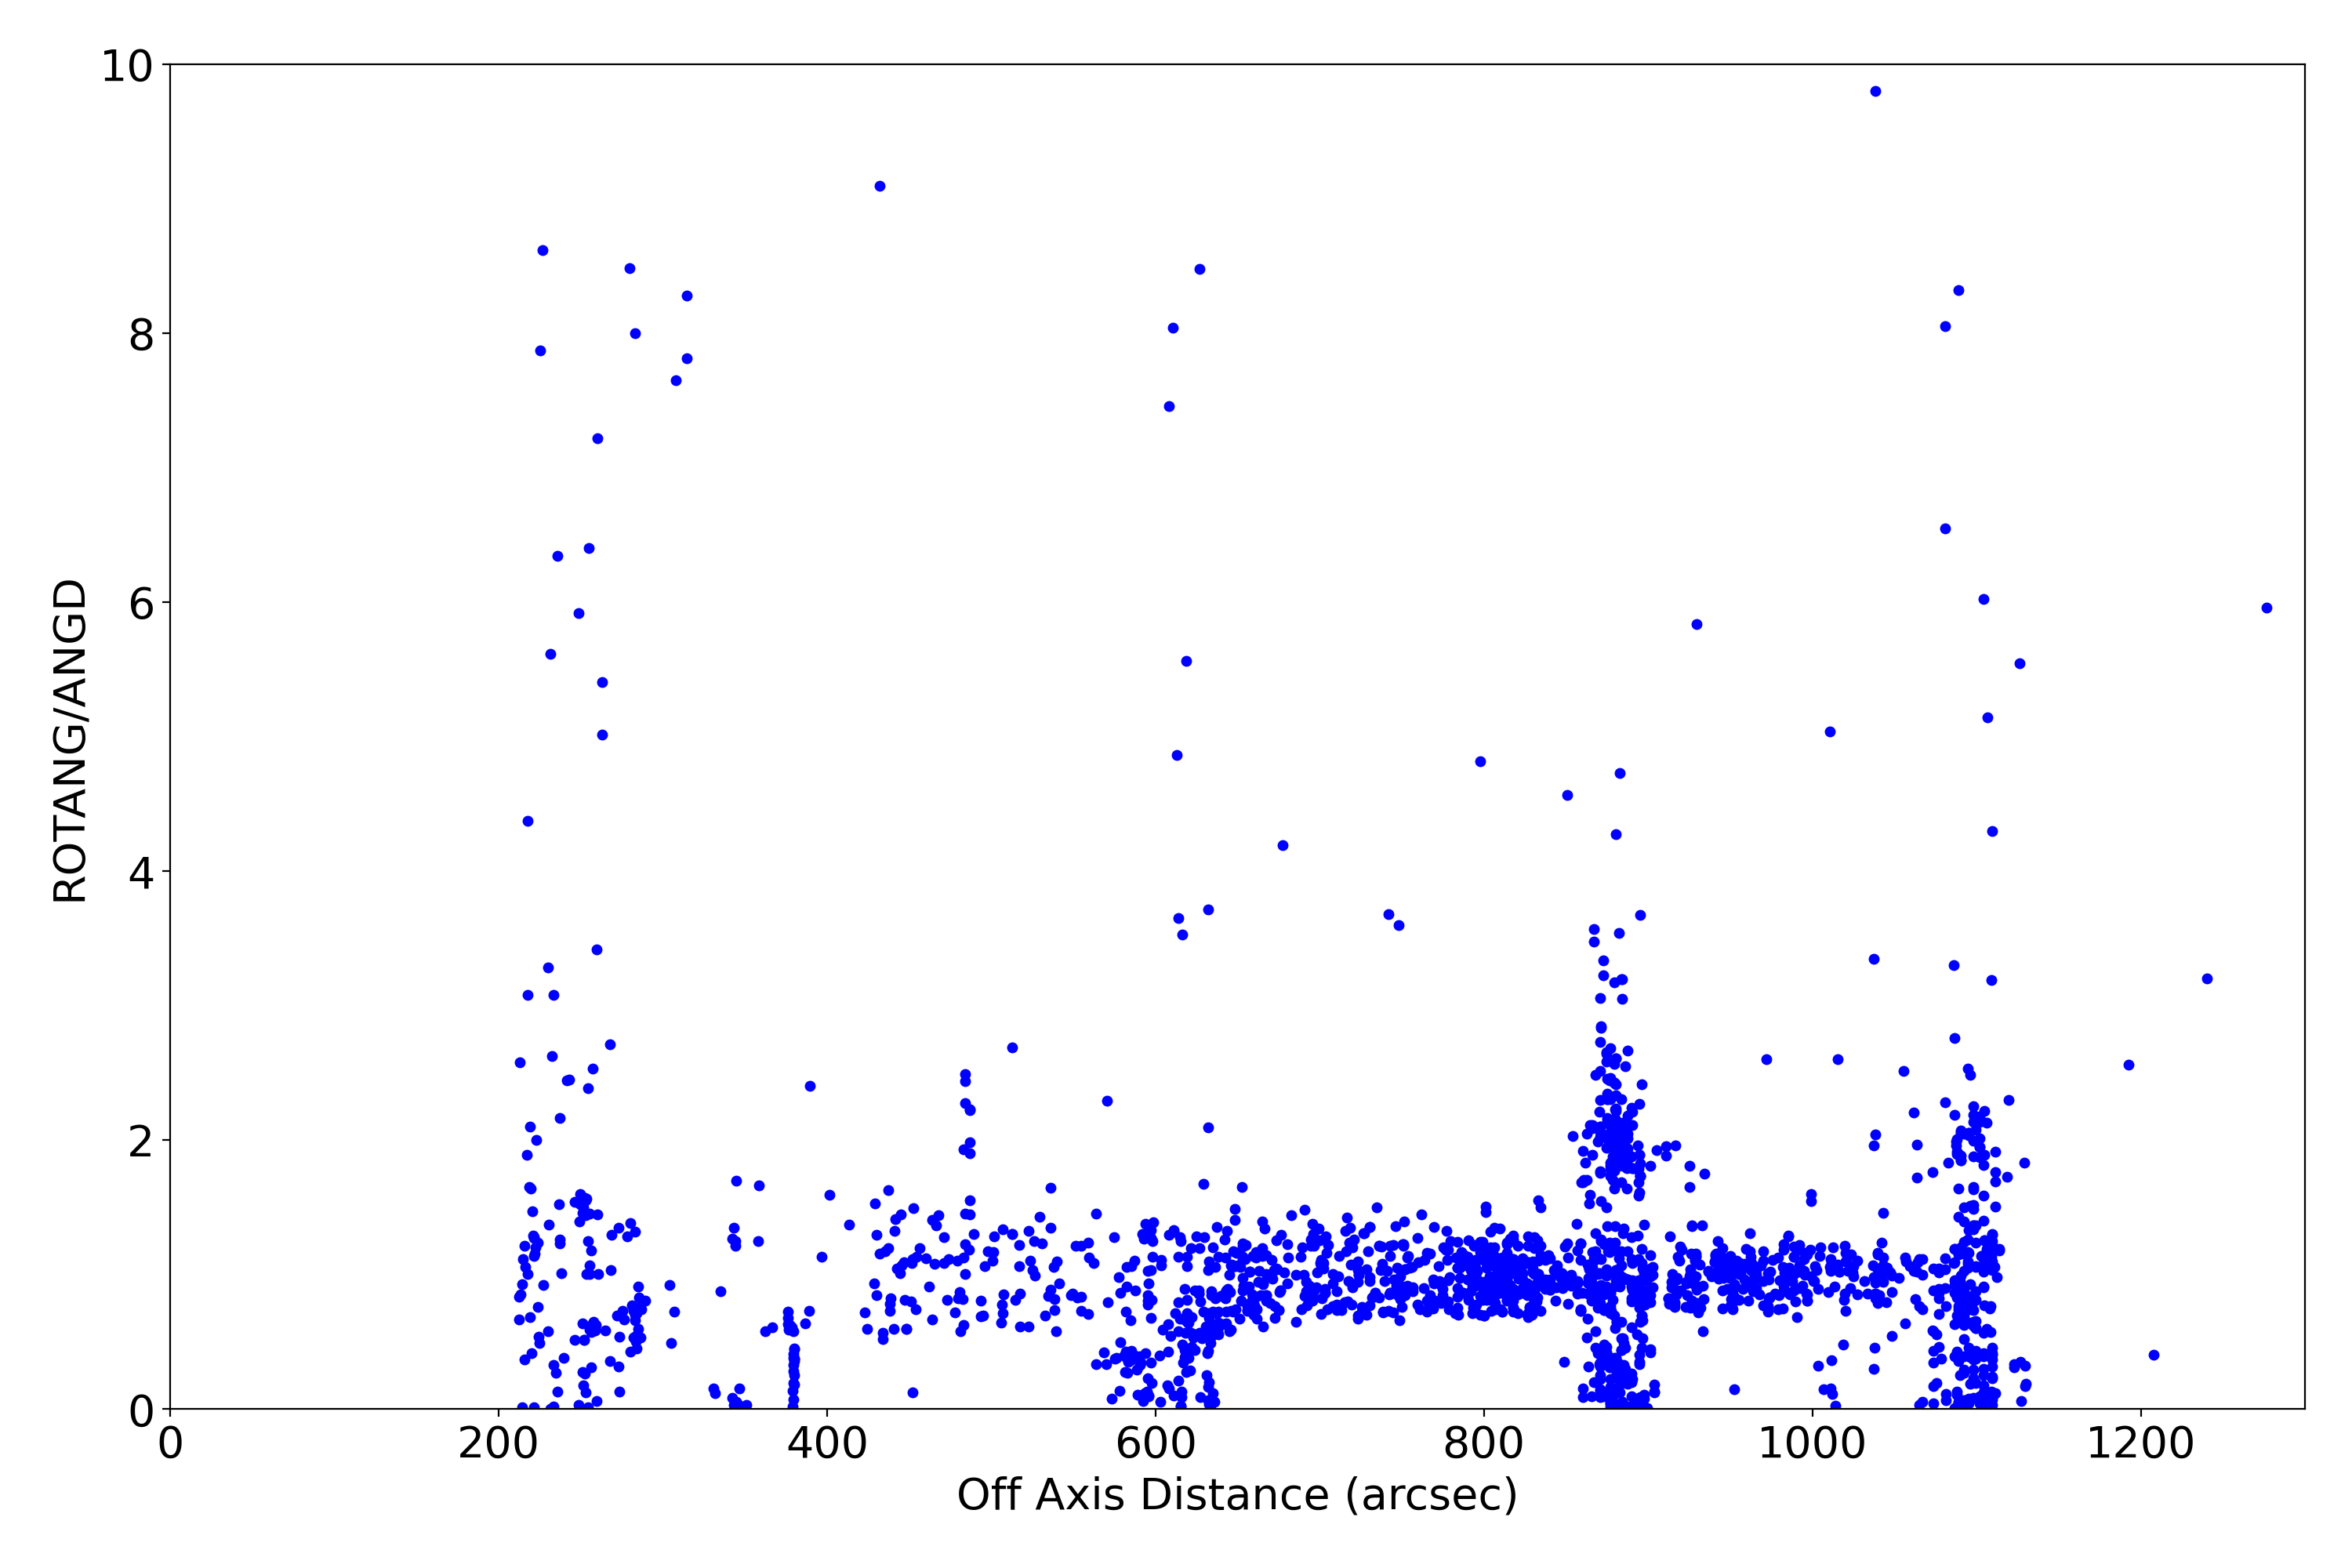
Plots below show various characteristics of detected imaging sources. Standard level 2 data products (*src2.fits) are used. Only observations with focus (sim_x) within 0.01 mm of nominal value for given SI configuration are used. Sources are also filtered for strength (SNR > 15).
| XY | PSF | Roundness | EE Radius | SNR | Rotation | Rotation2 | |
|---|---|---|---|---|---|---|---|
| ACIS I | 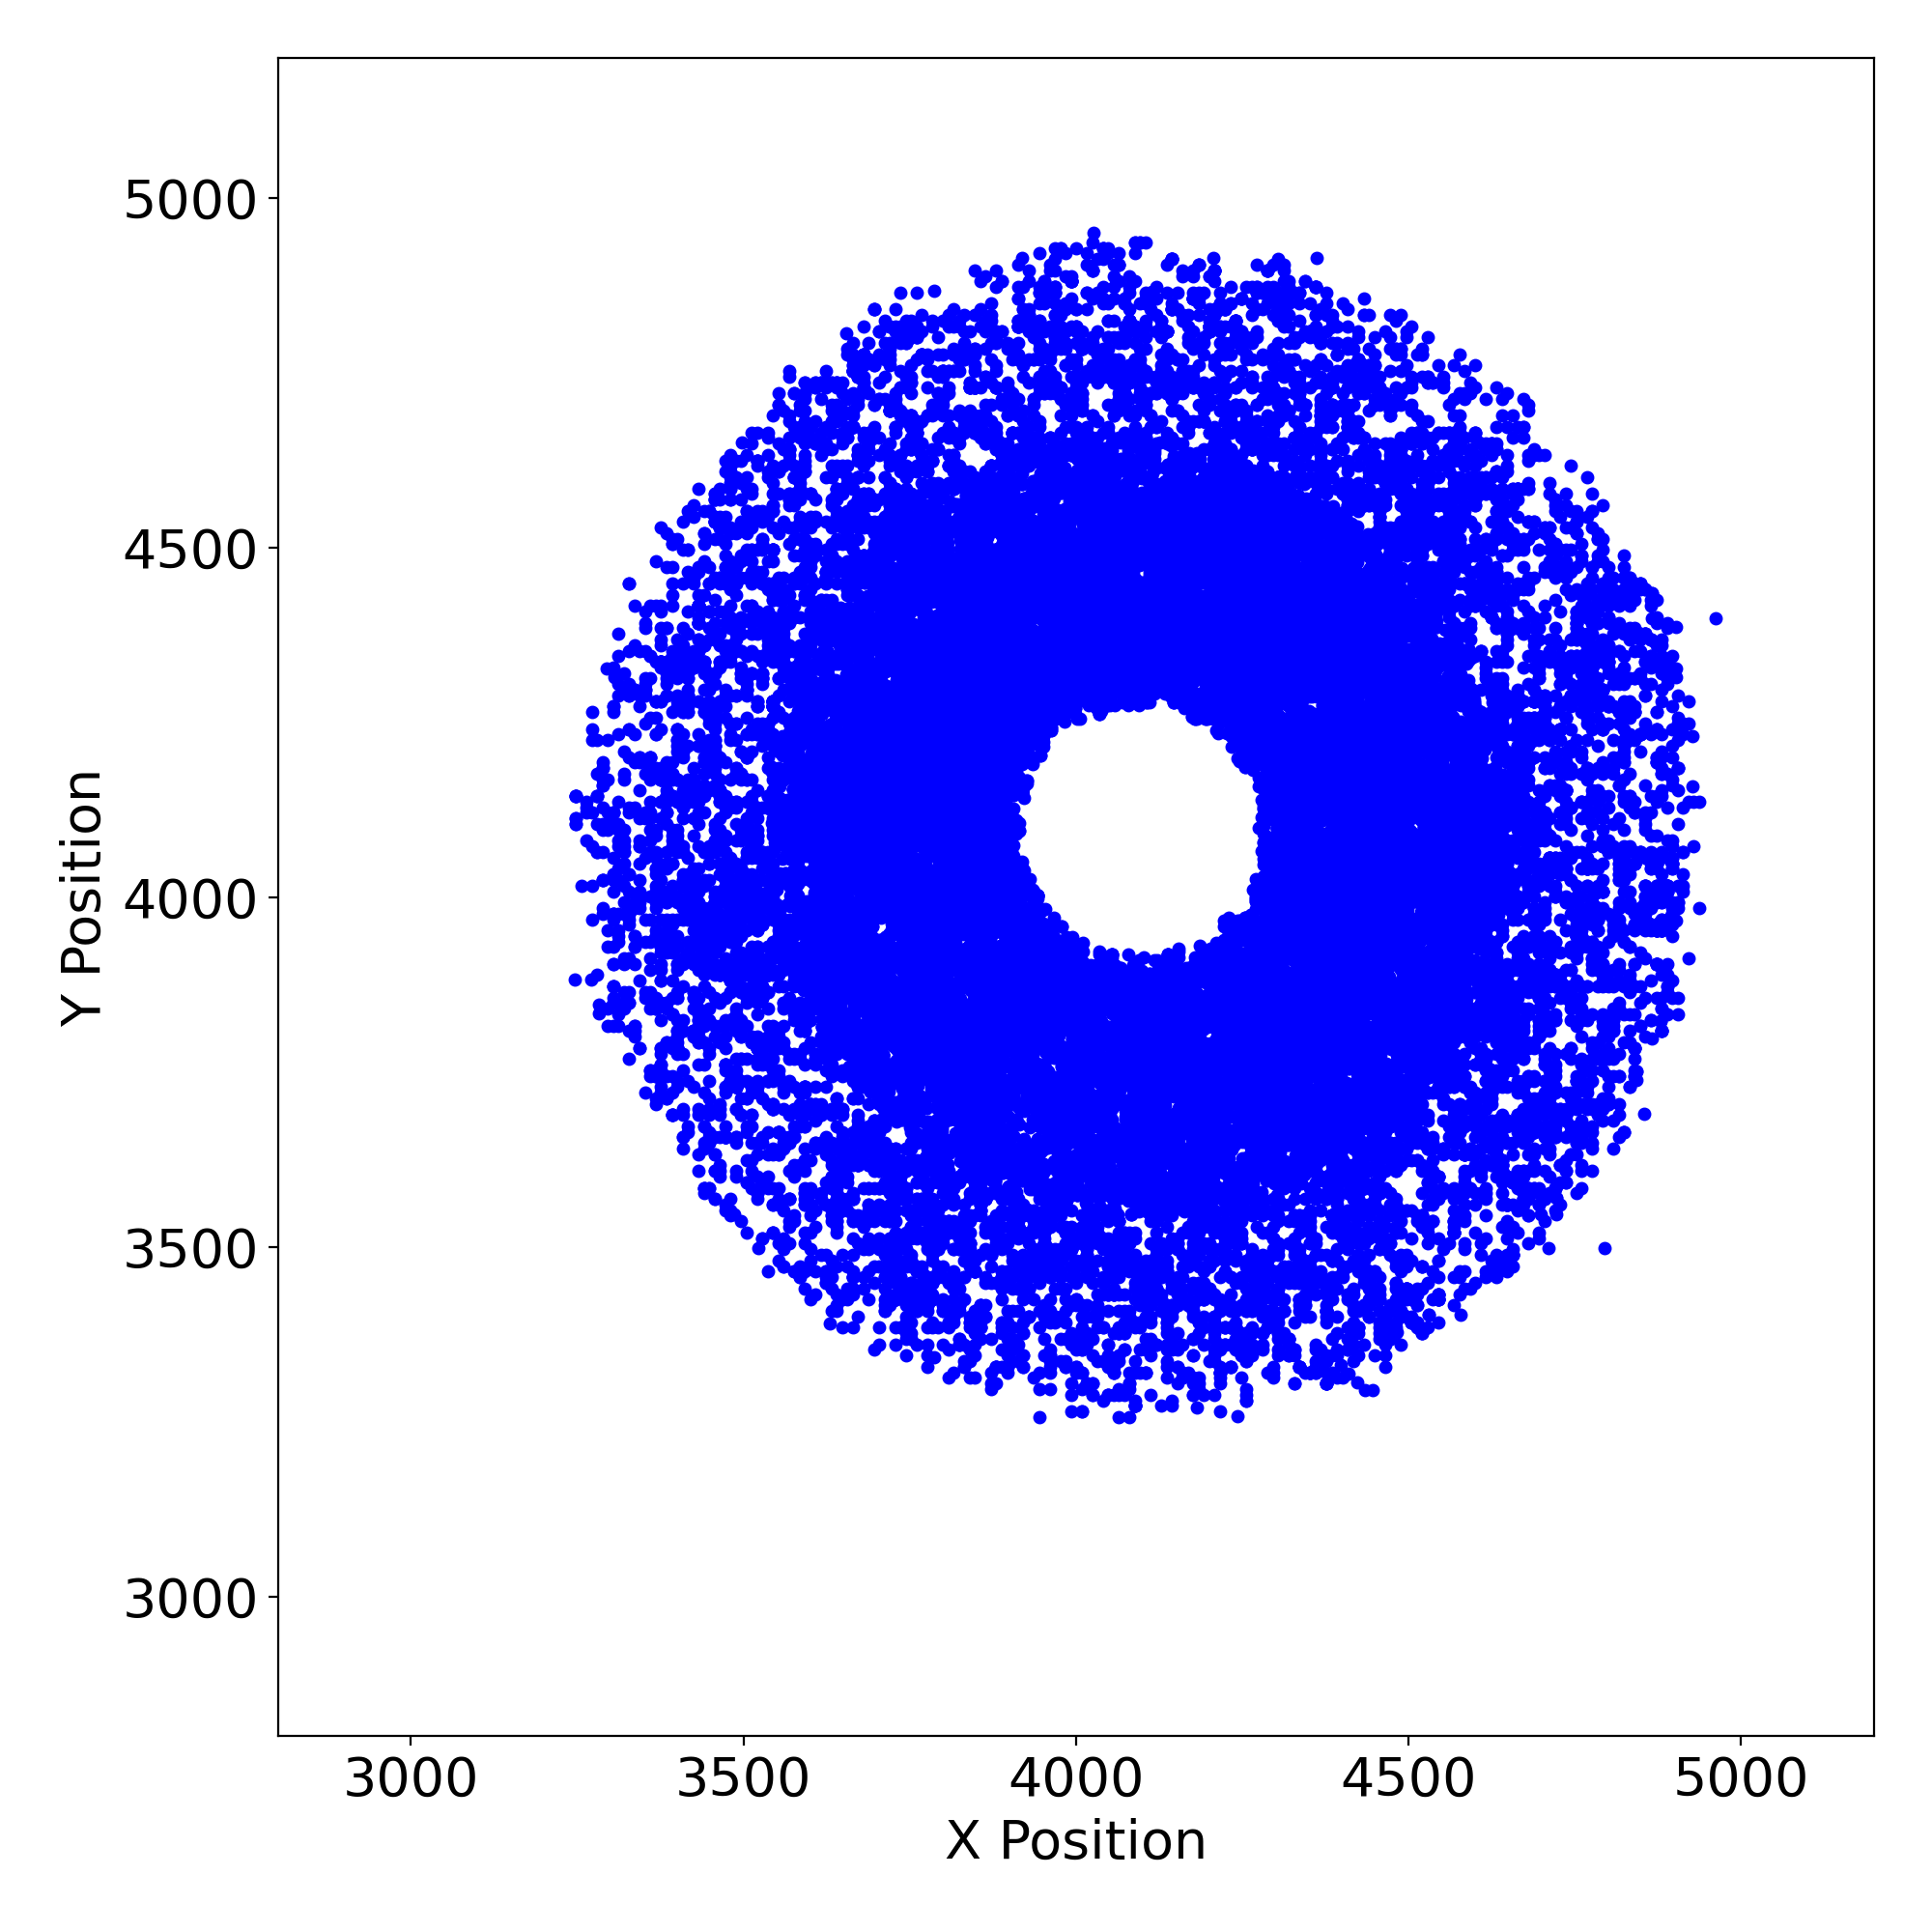 |
 |
 |
 |
 |
 |
 |
| ACIS S | 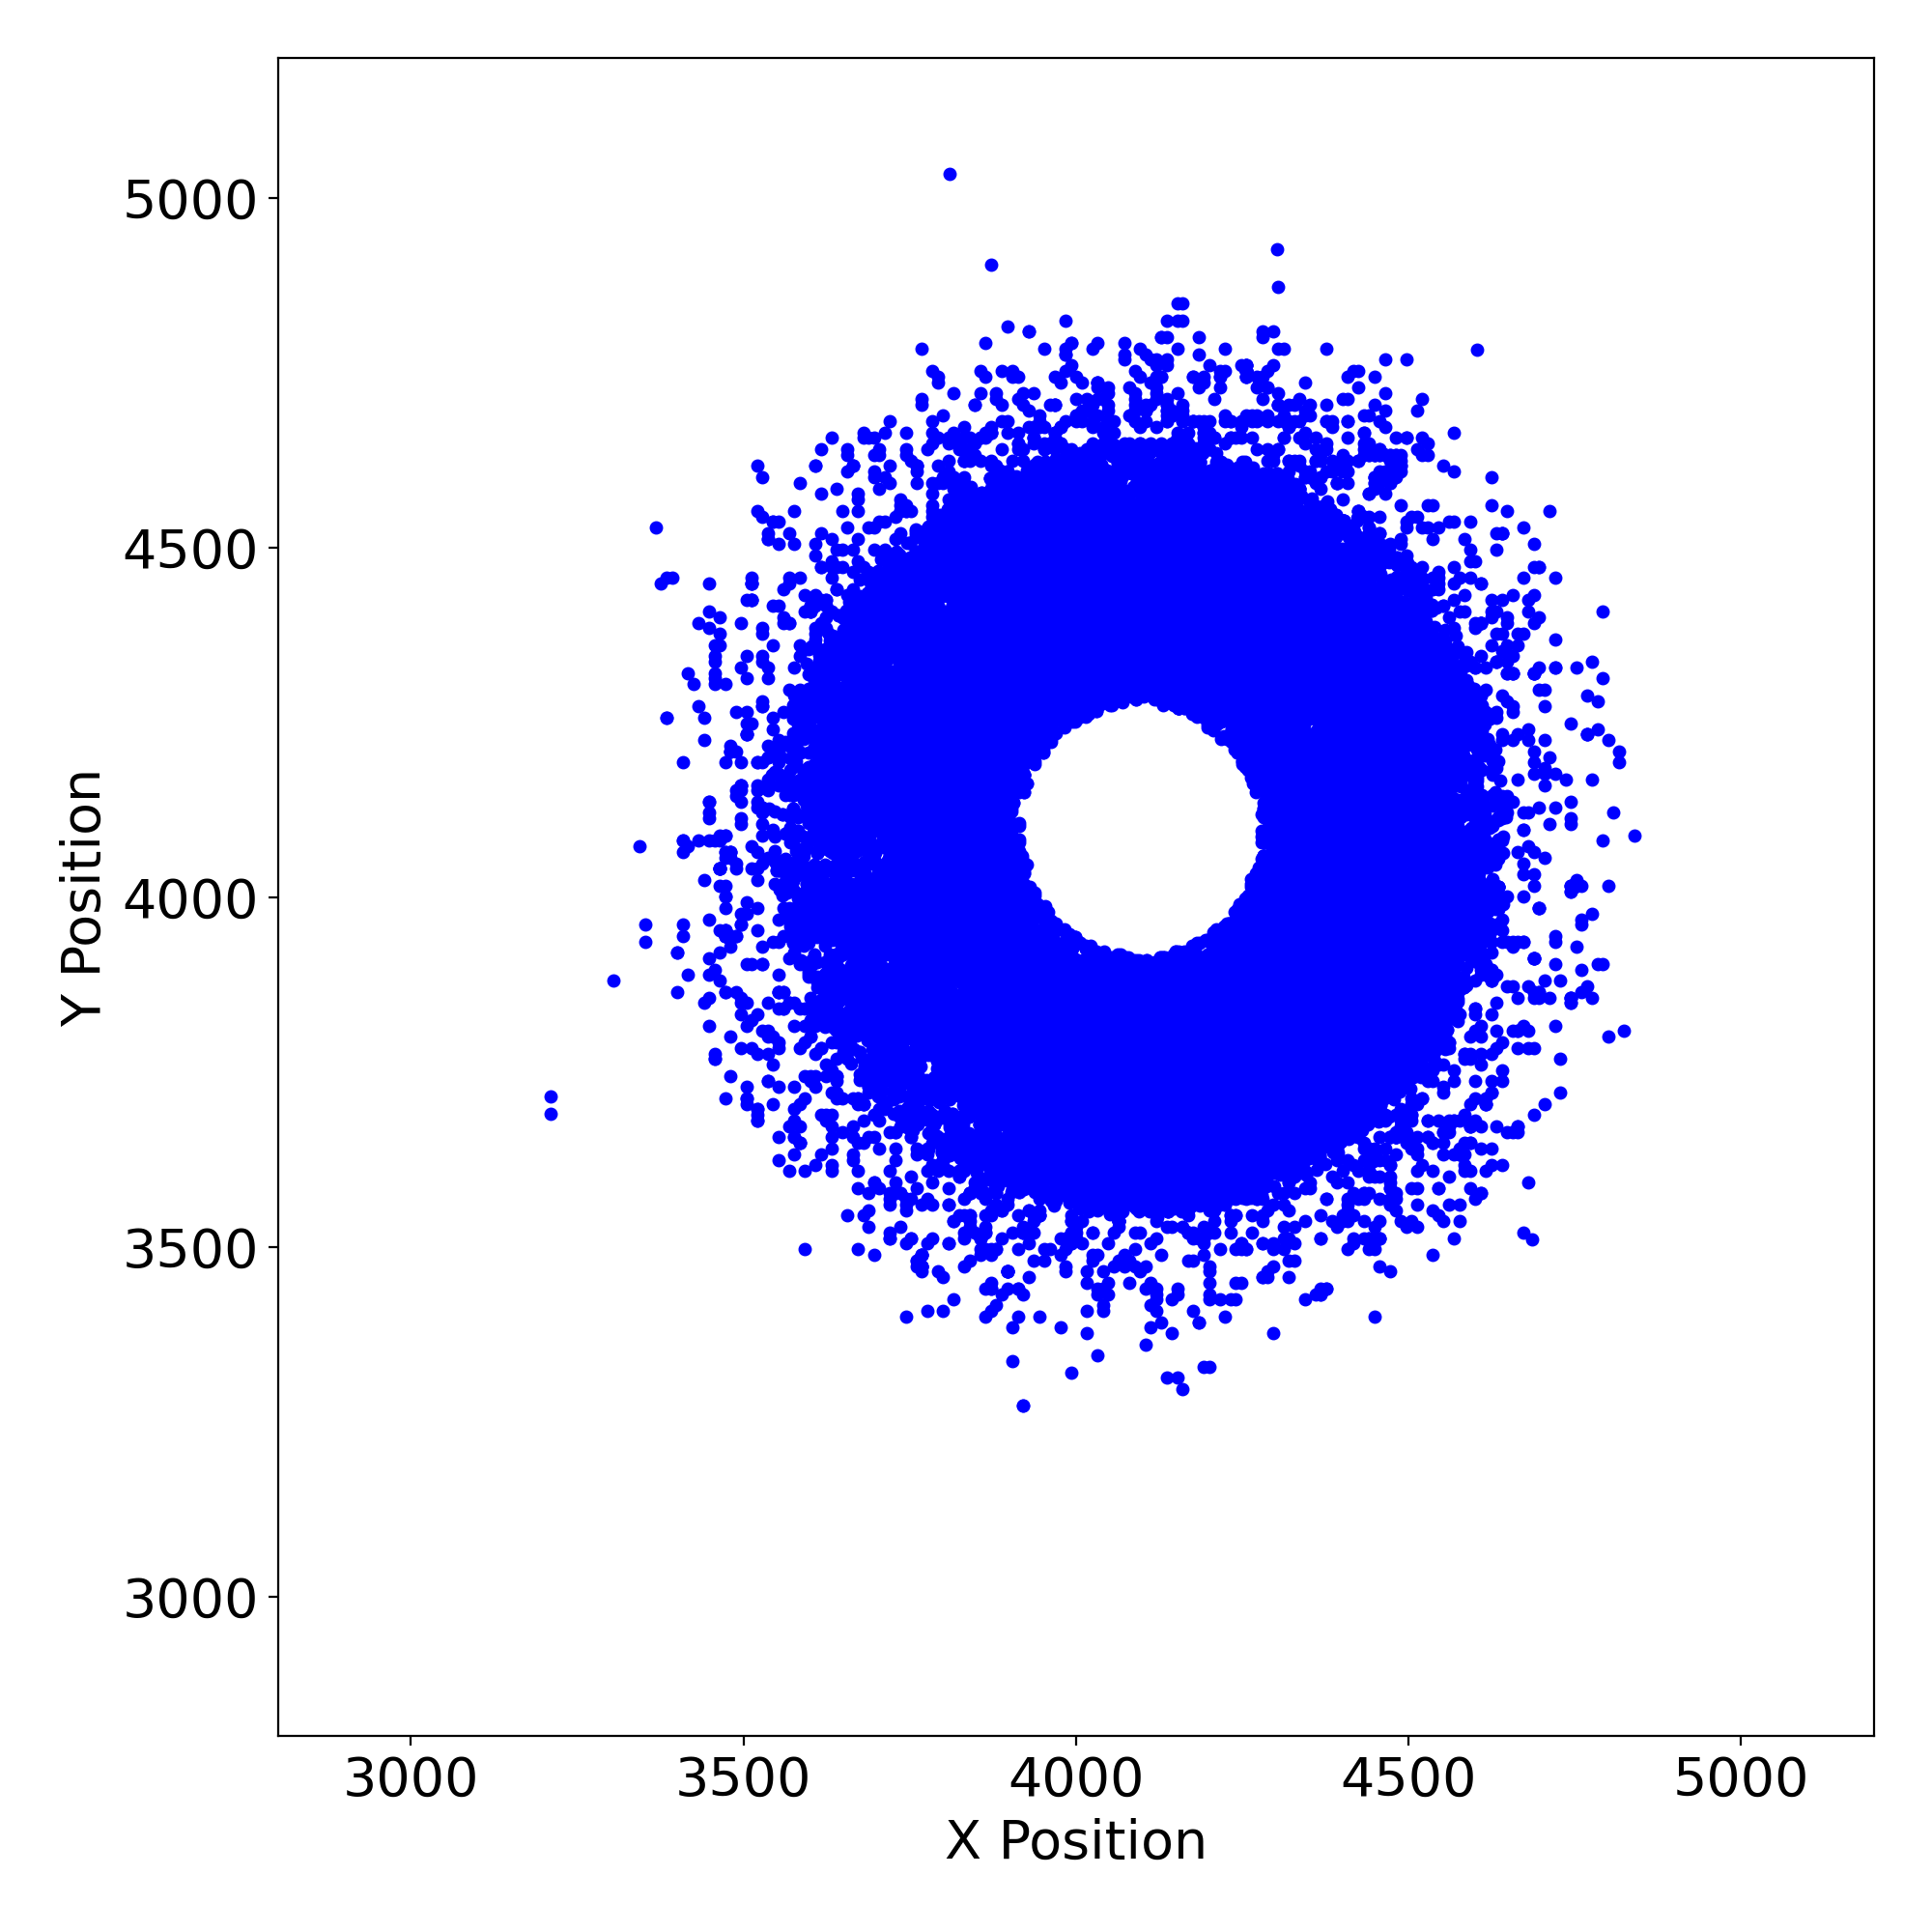 |
 |
 |
 |
 |
 |
 |
| HRC I | 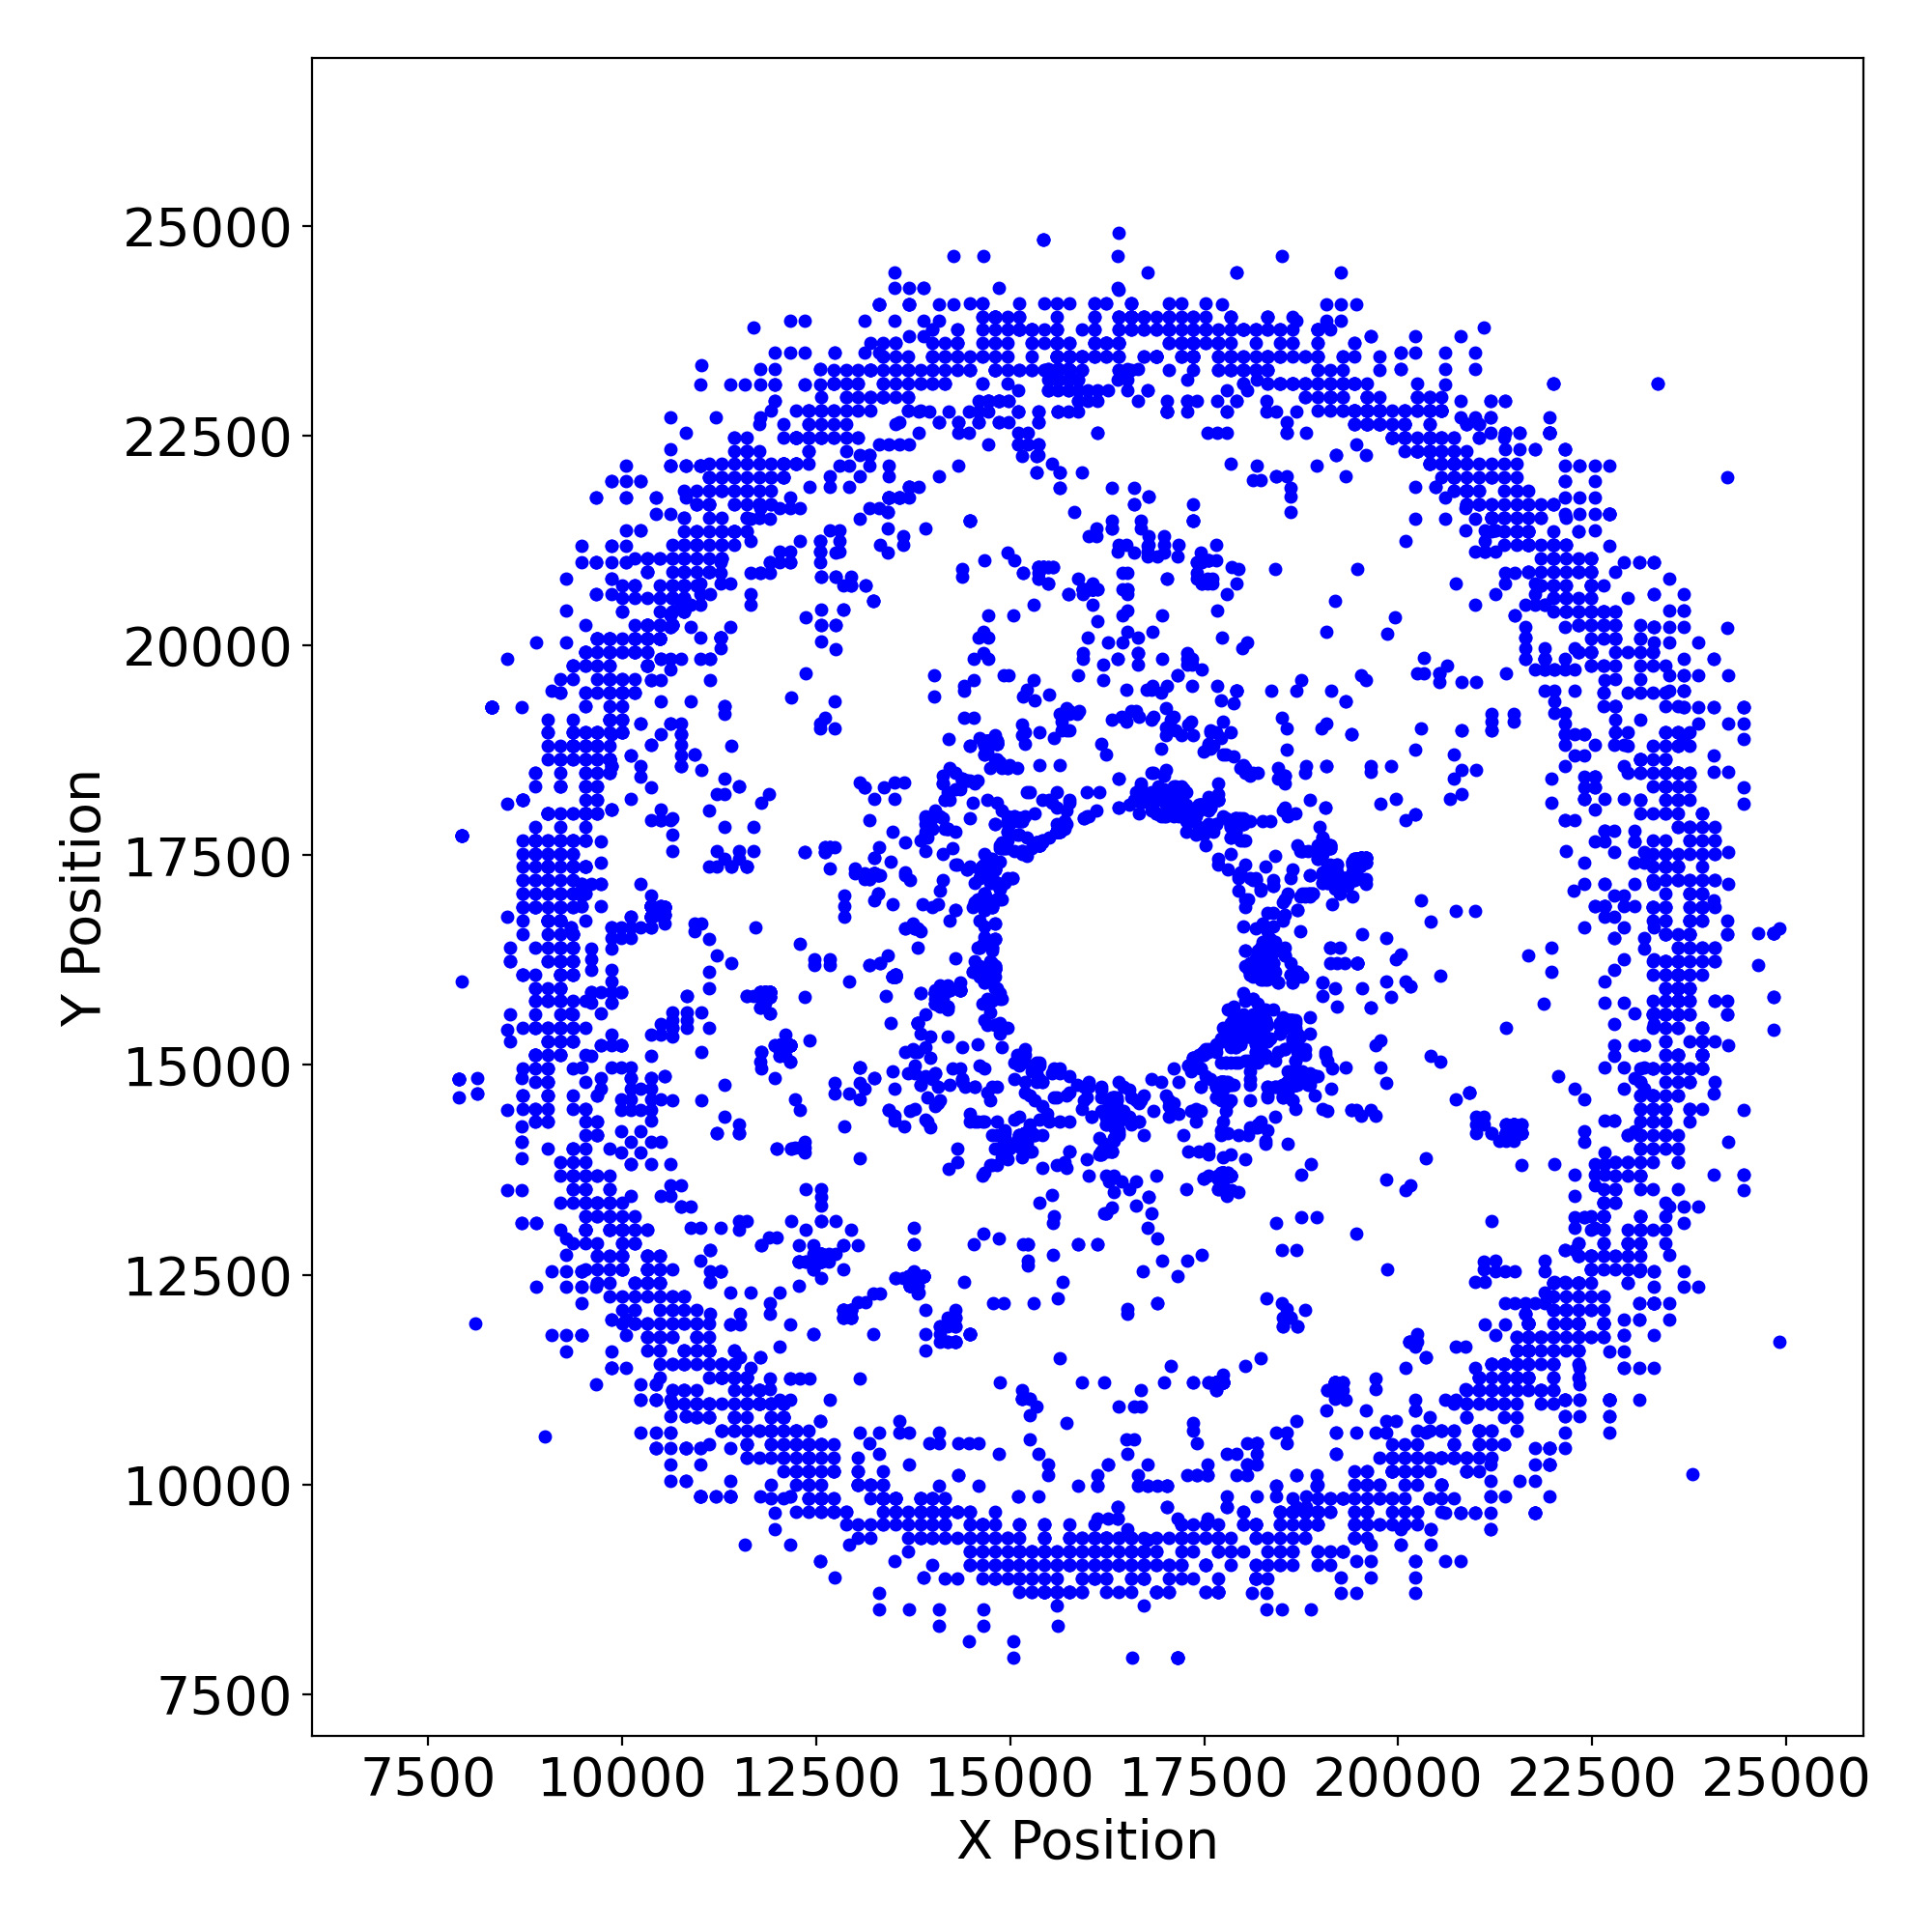 |
 |
 |
 |
 |
 |
 |
| HRC S | 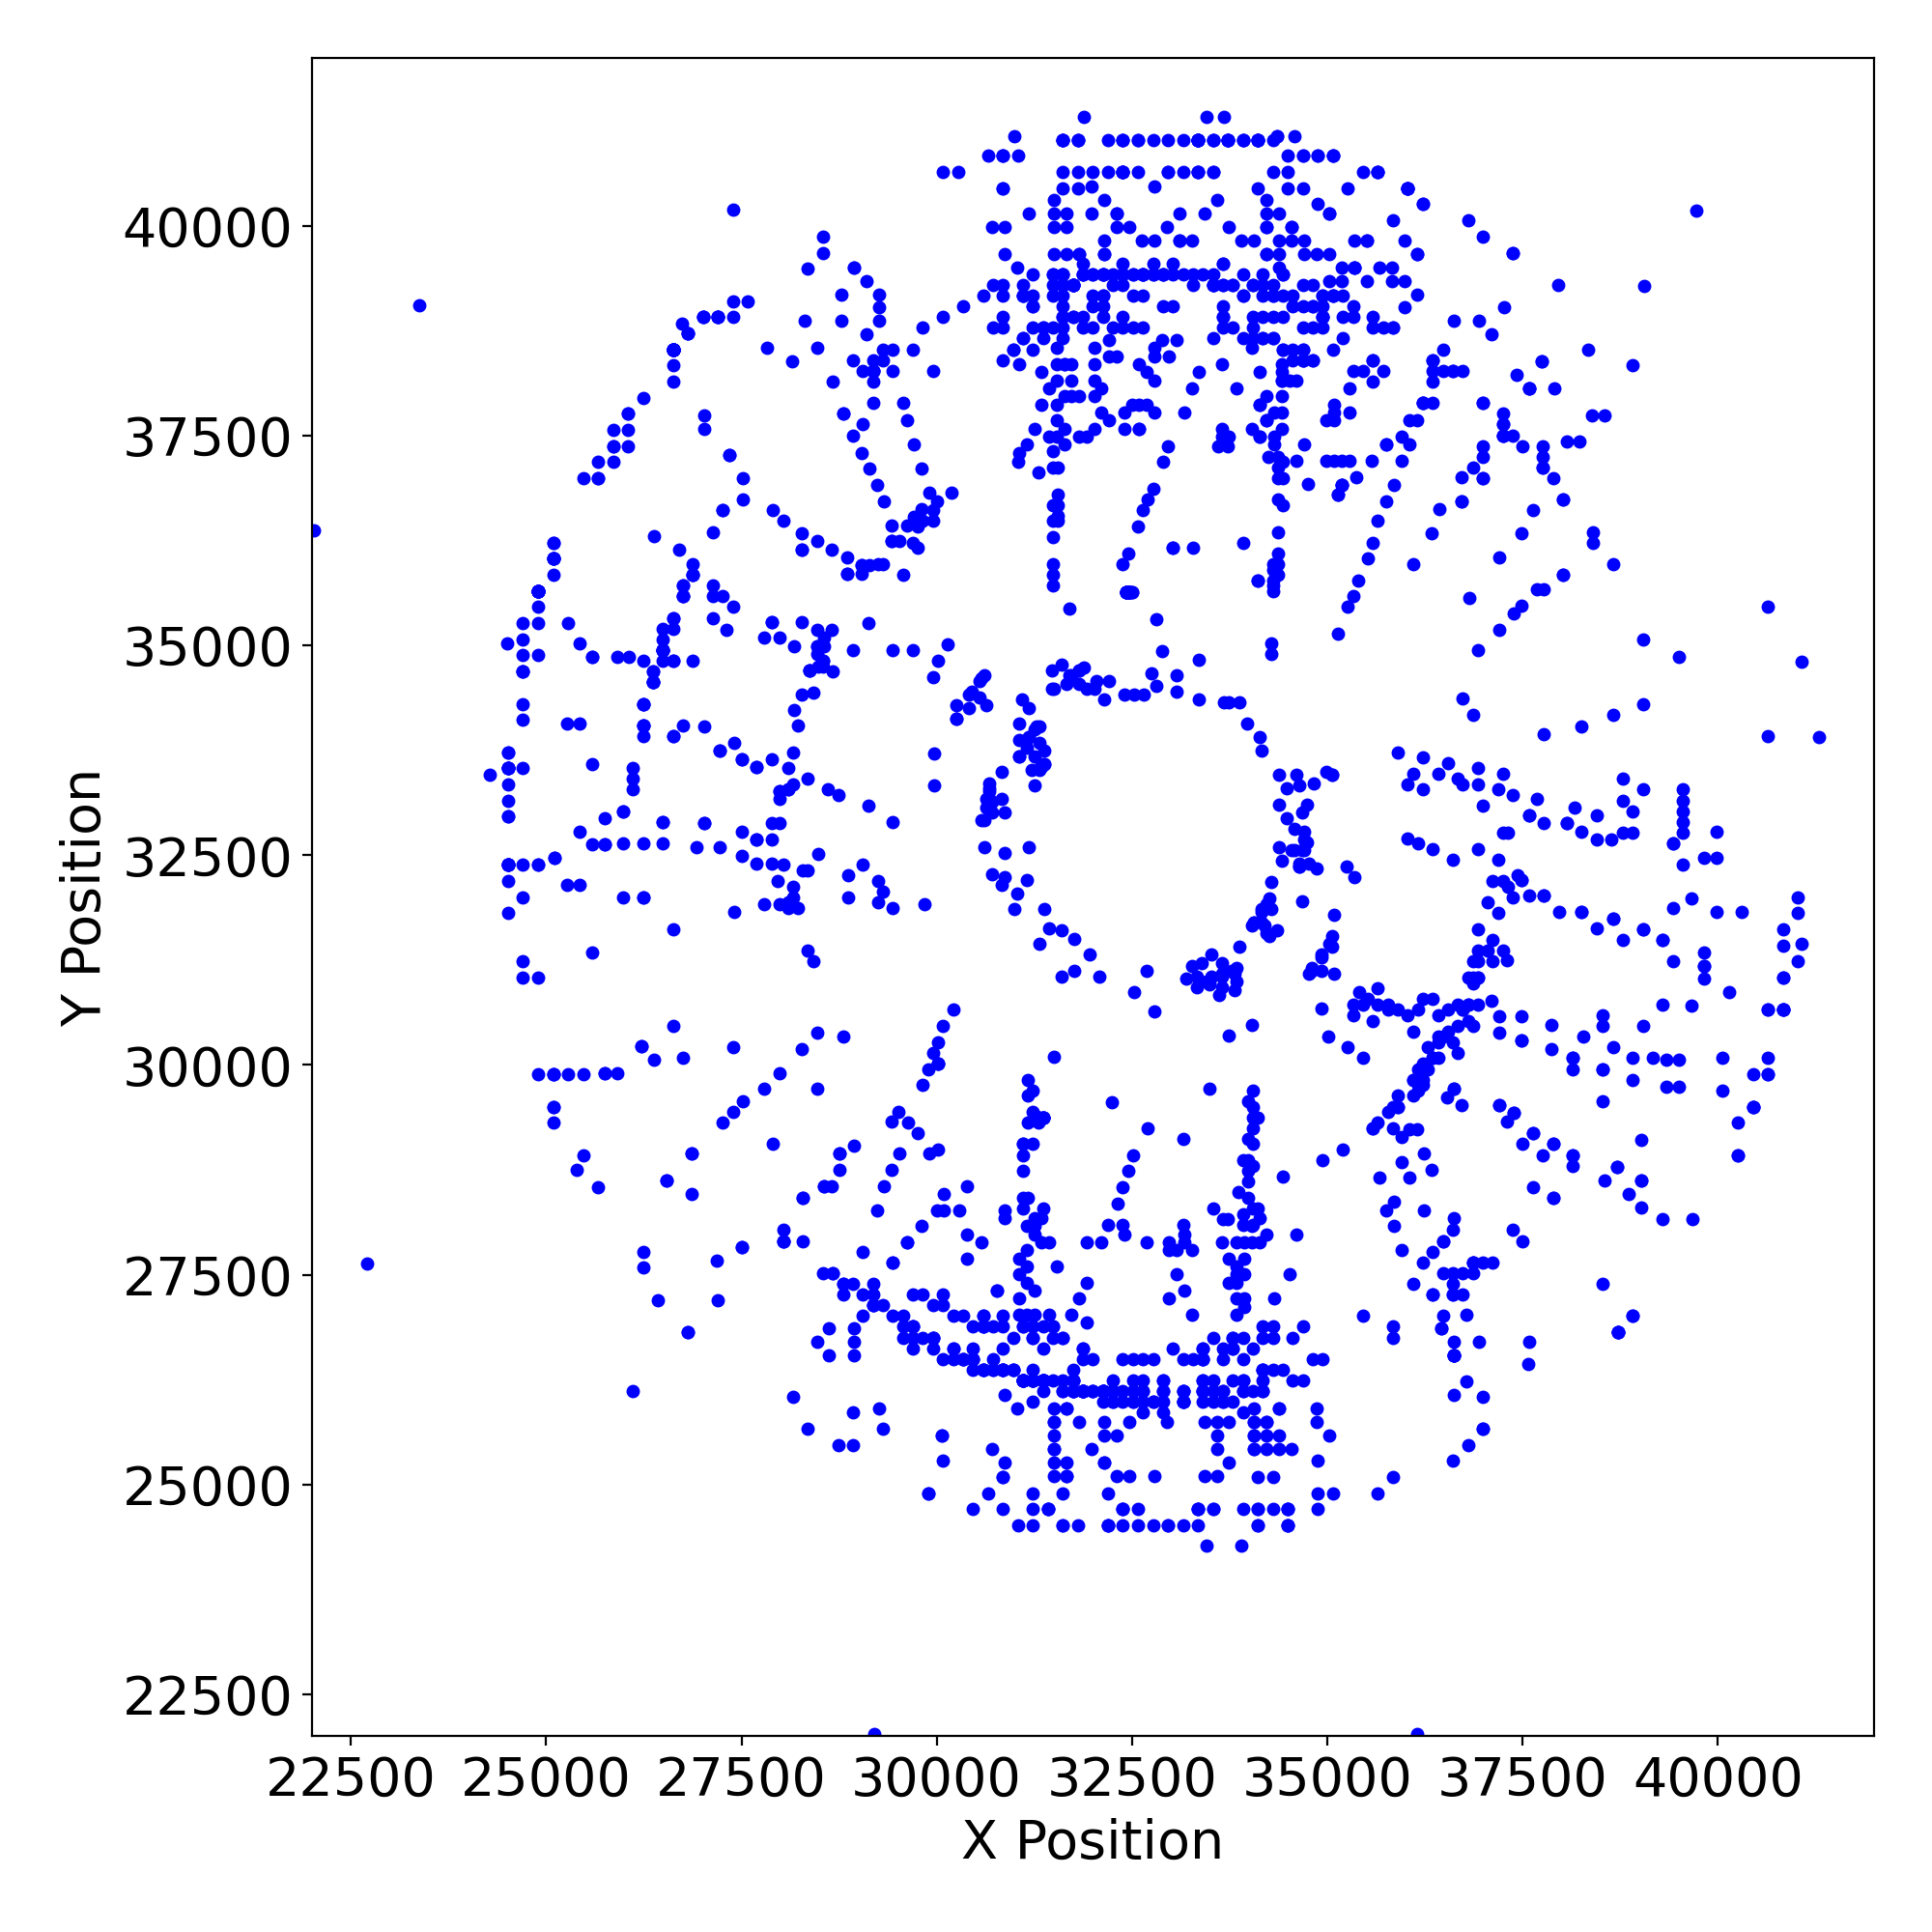 |
 |
 |
 |
 |
 |
 |
Gratings
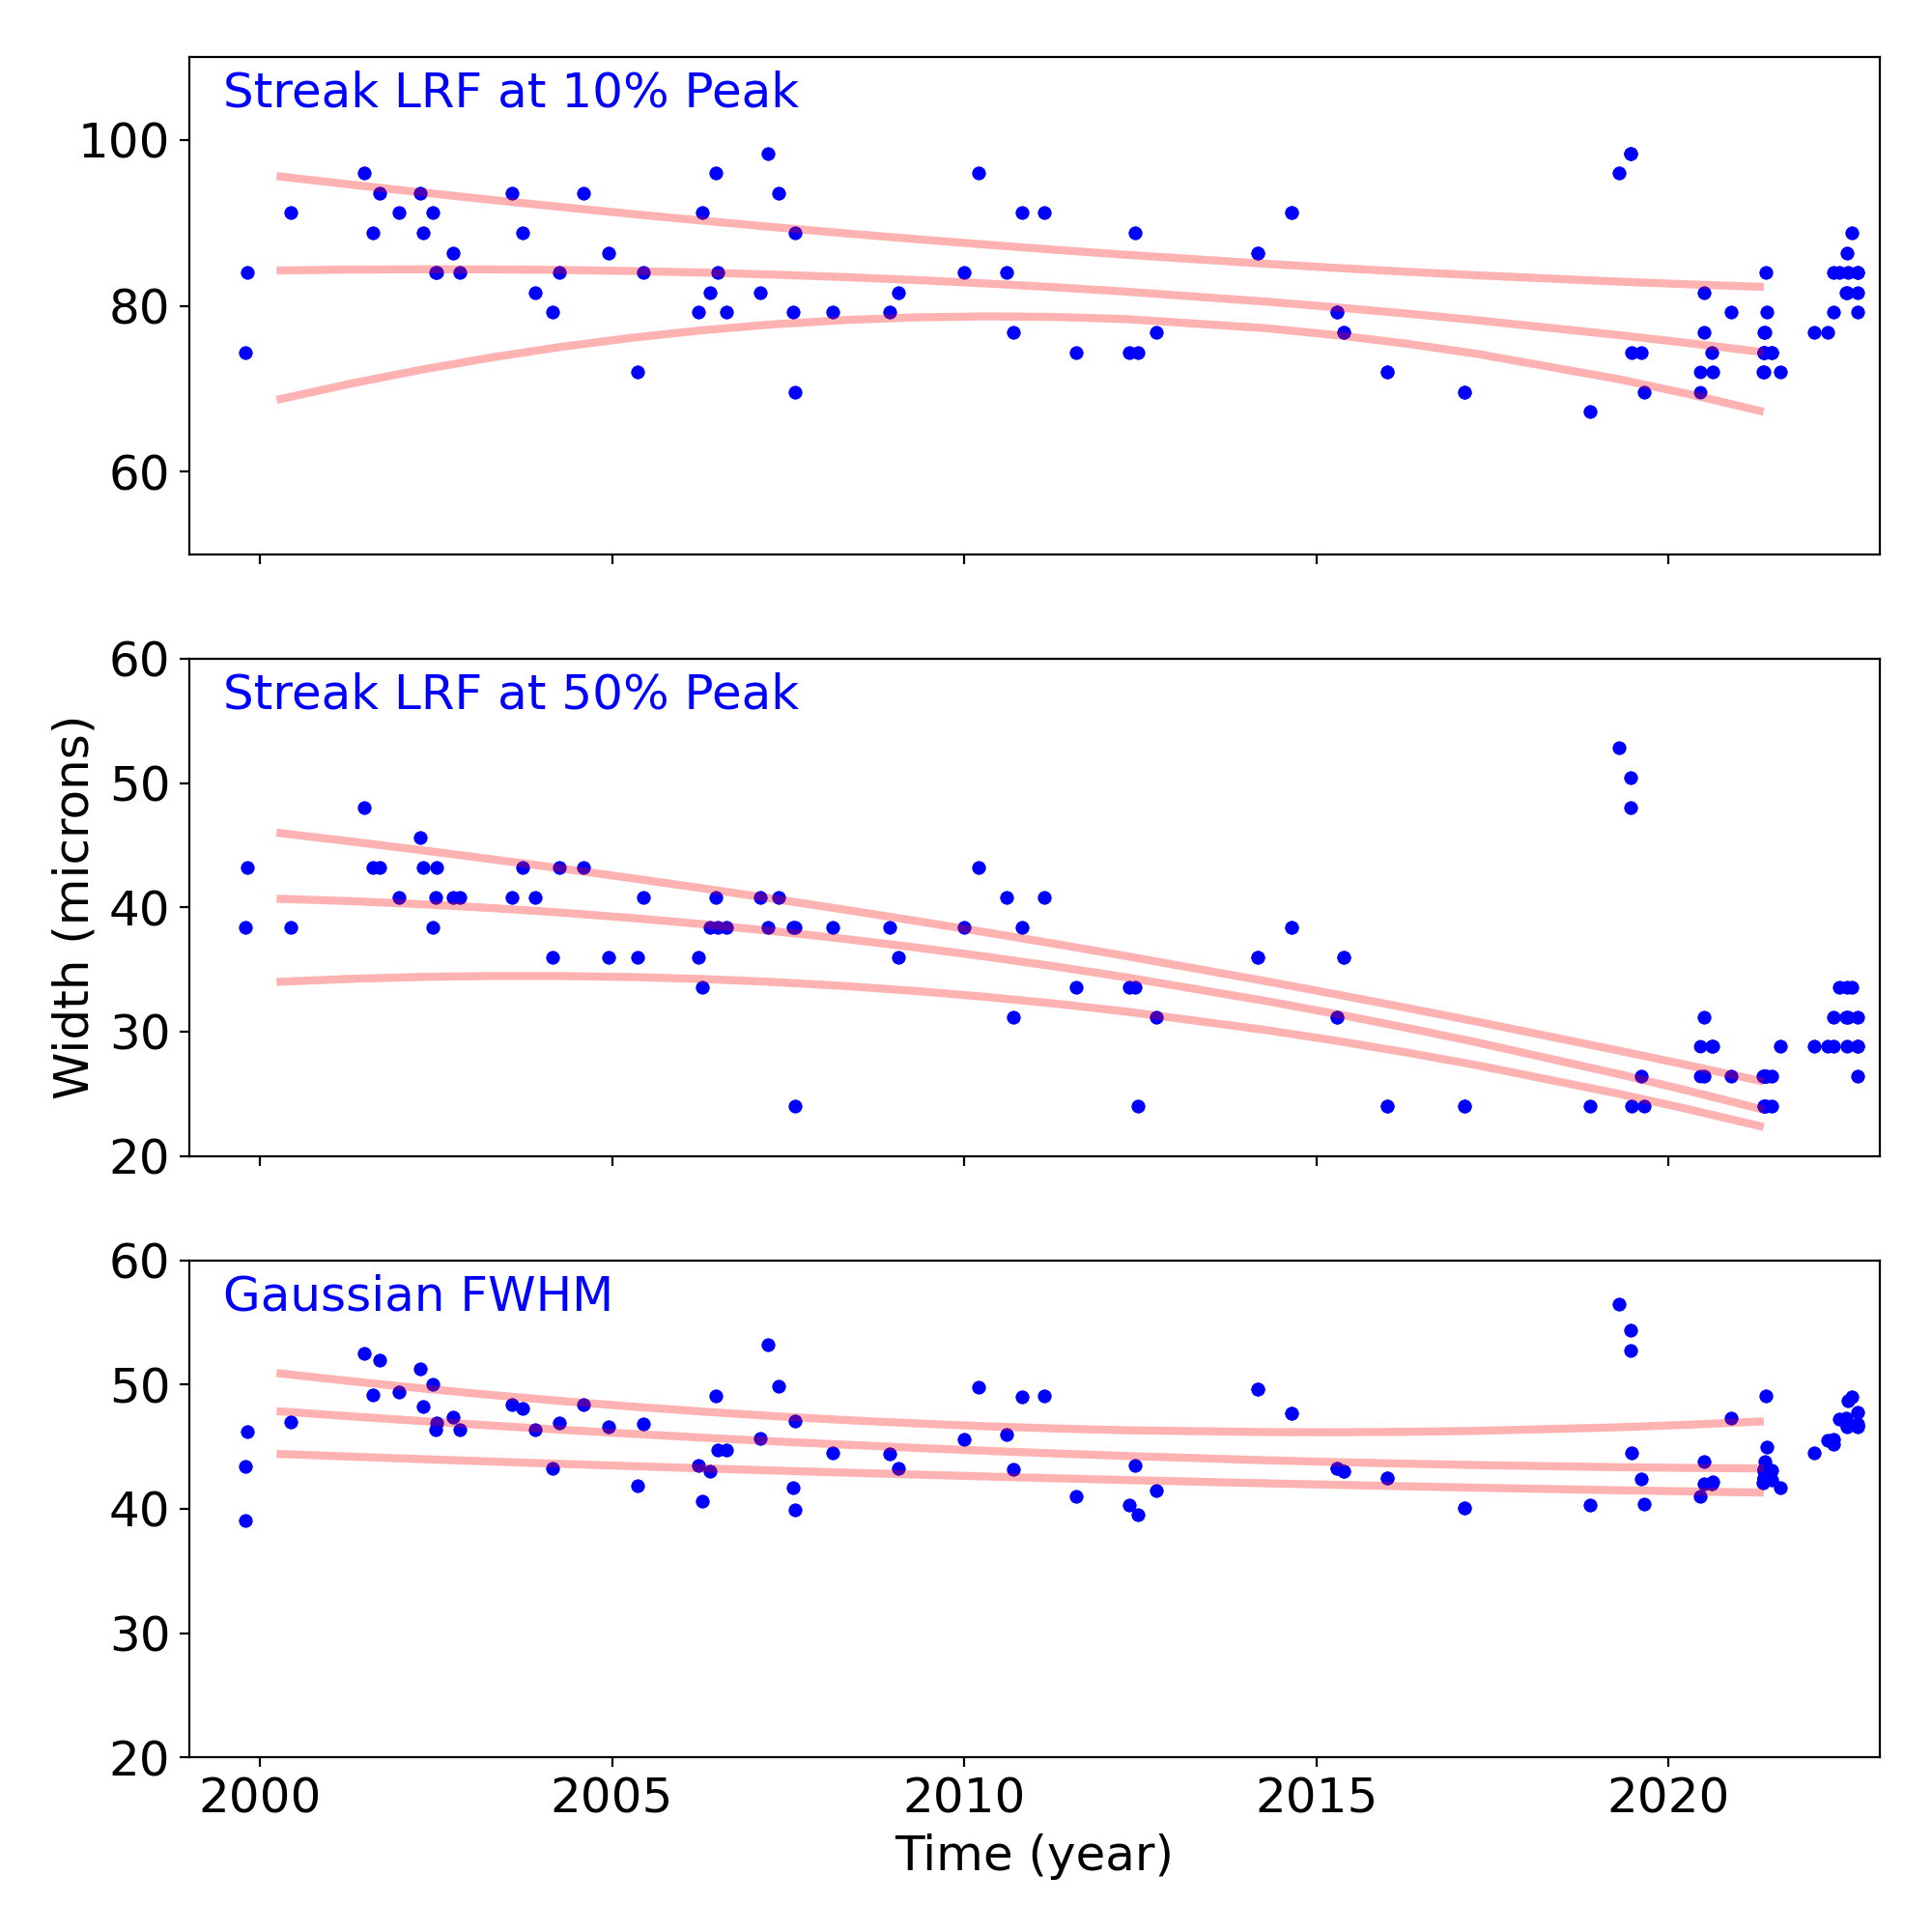
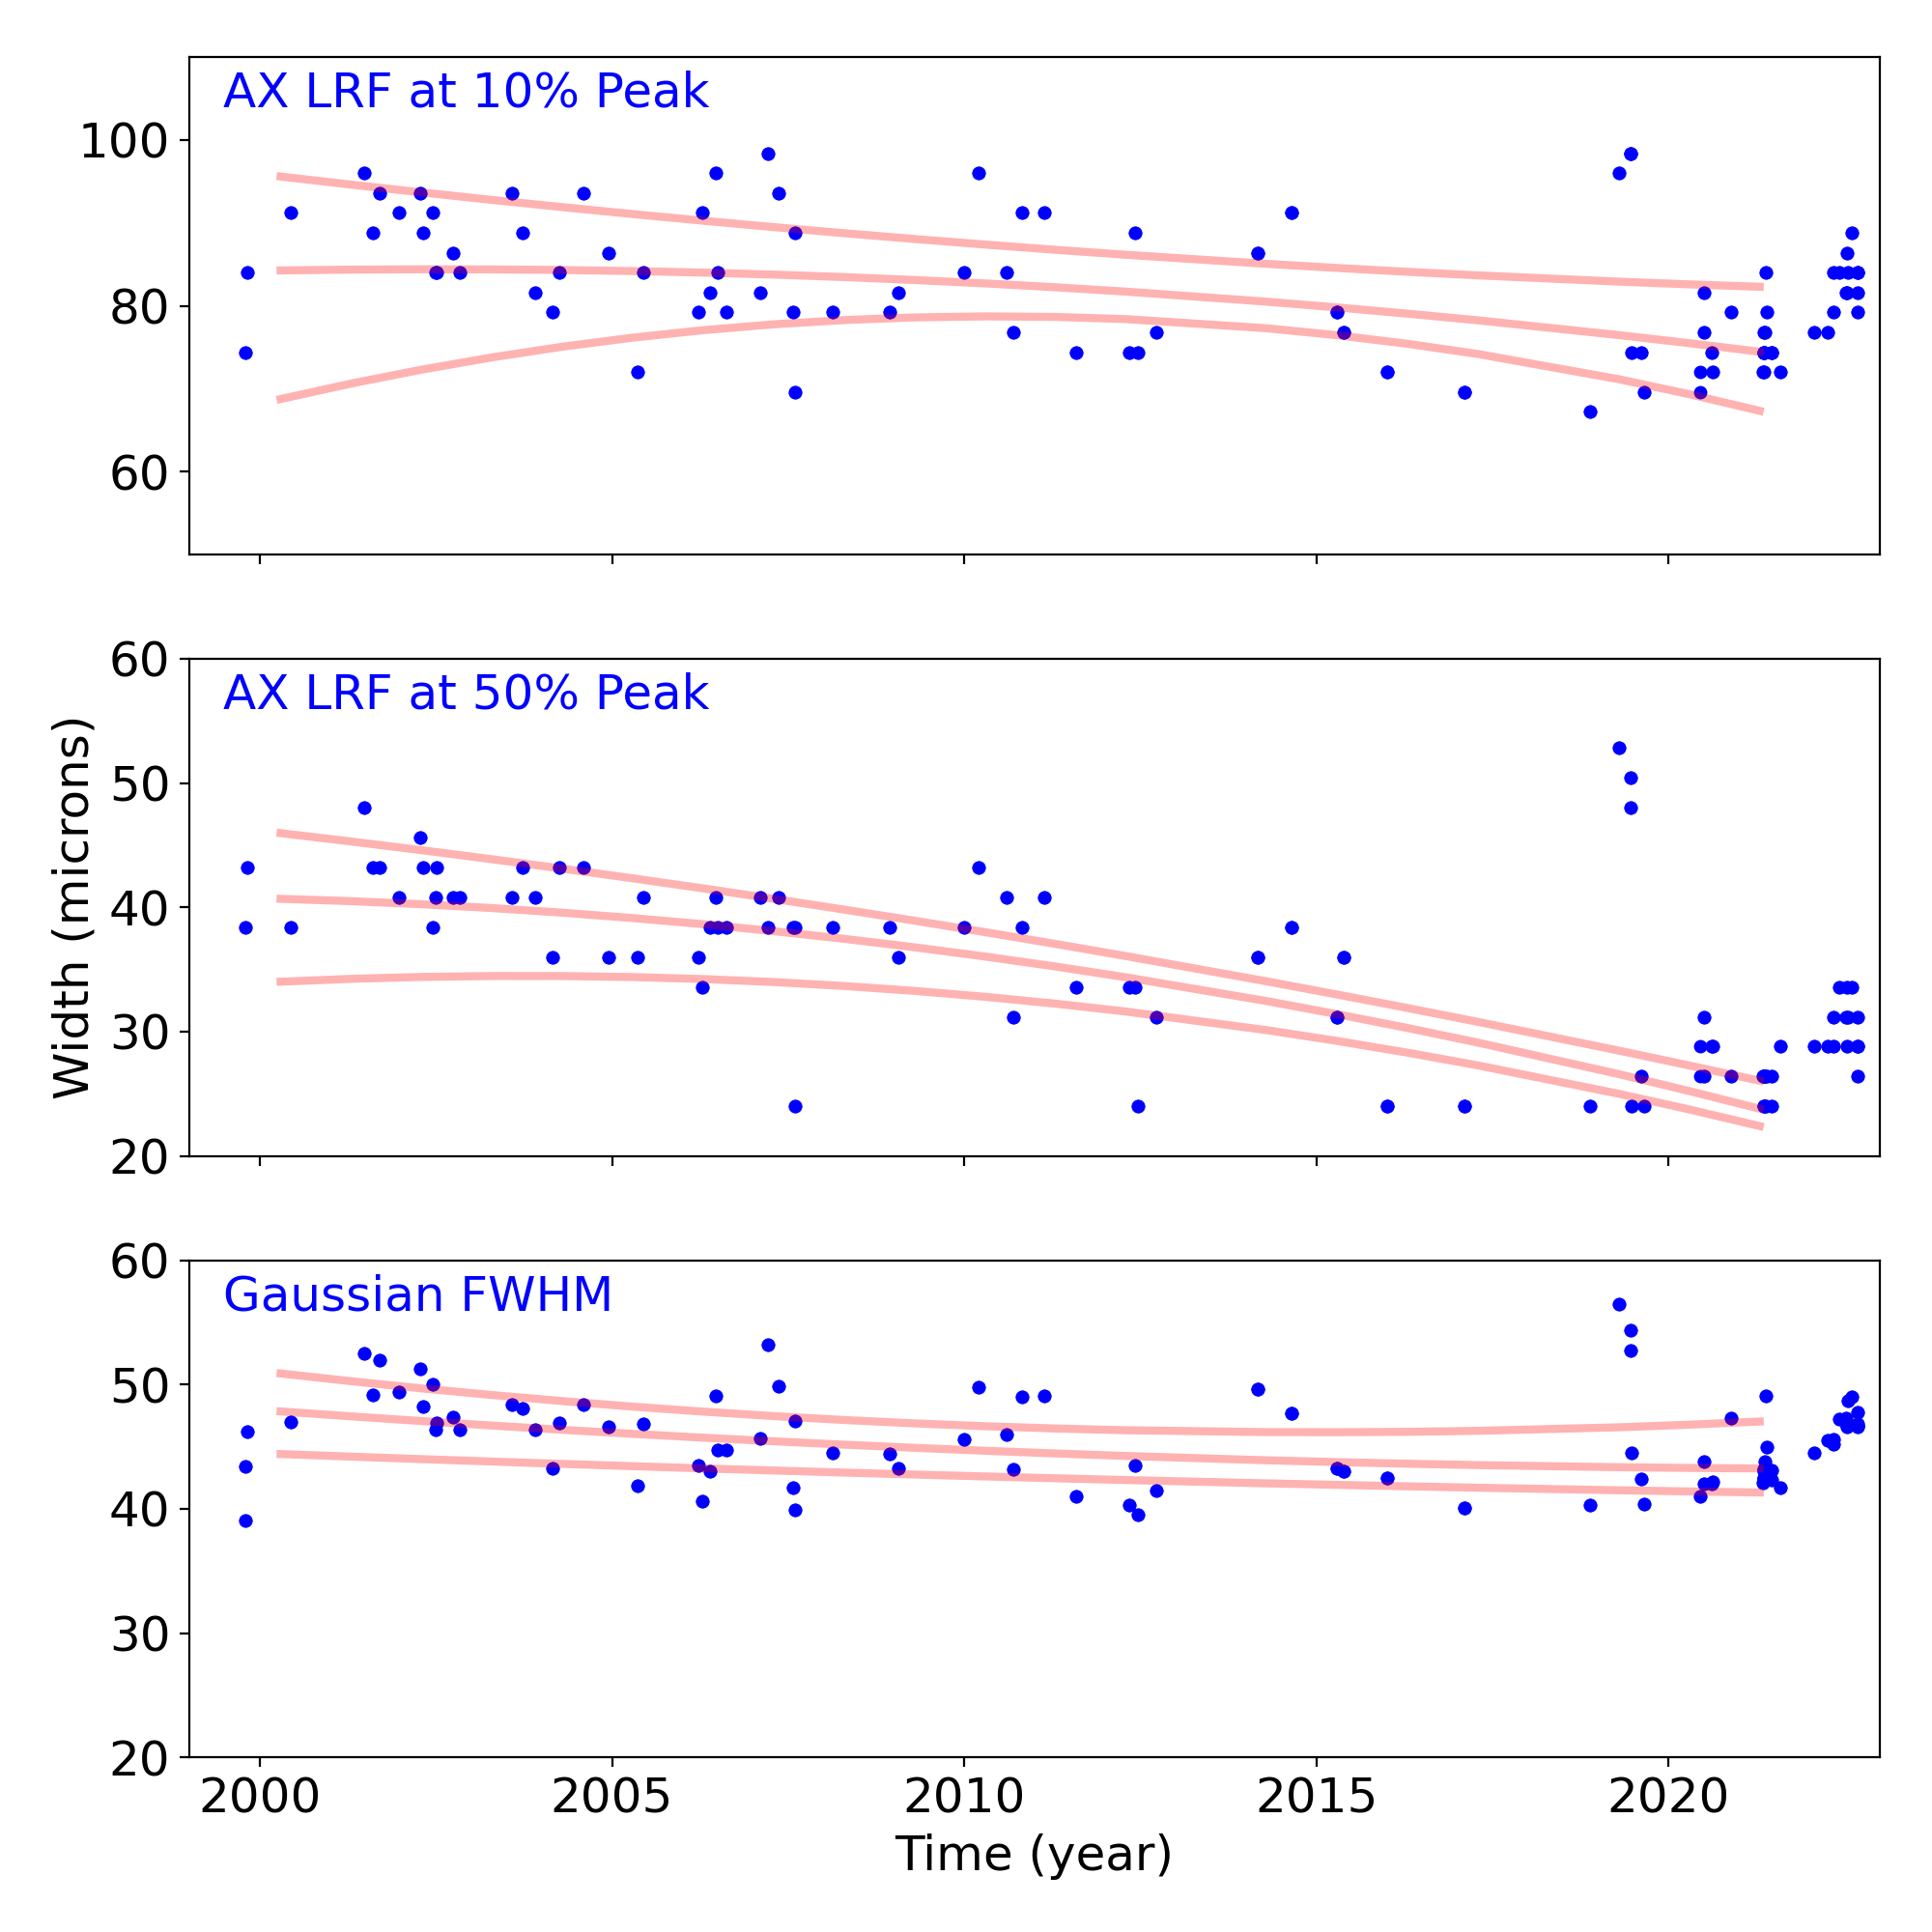
Grating Trends/Focus
We plot the width of the zero order streak of ACIS/HETG observations and the width of the zero order image for HRC/LETG observations of point sources. No significant defocusing trend is seen at this time. See Gratings Trends pages.
PCAD
ACA Trending
| ACIS |
)
|
)
|
)
|
|
|---|---|---|---|---|
)
|
)
|
)
| ||
| HRCI |
)
|
)
|
)
|
)
|
| HRCI |
)
|
)
|
)
|
)
|
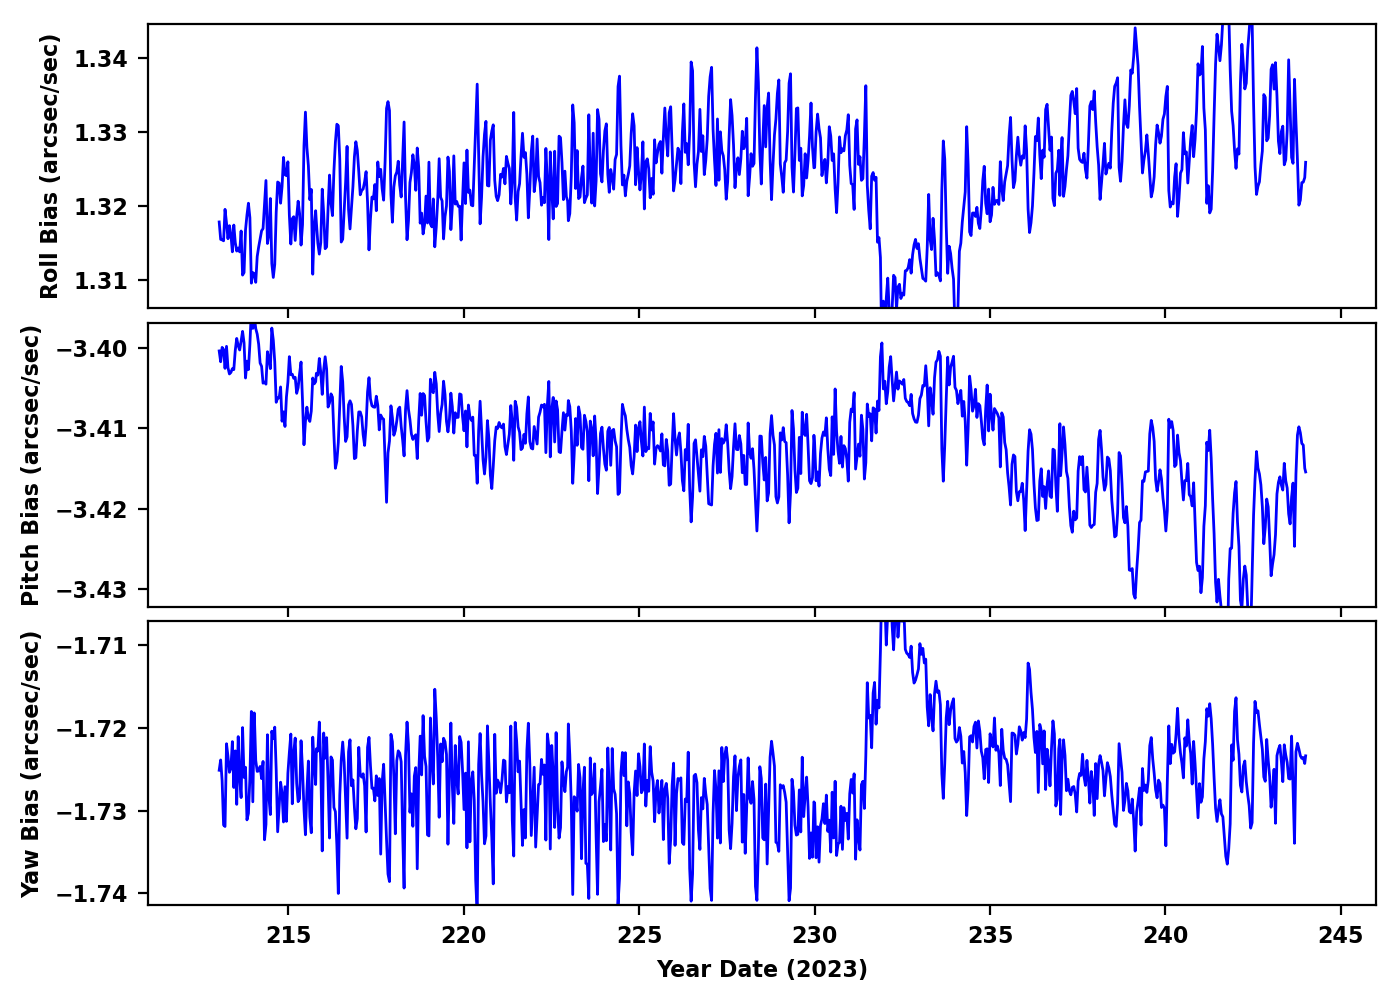
Gyro Bias Drift
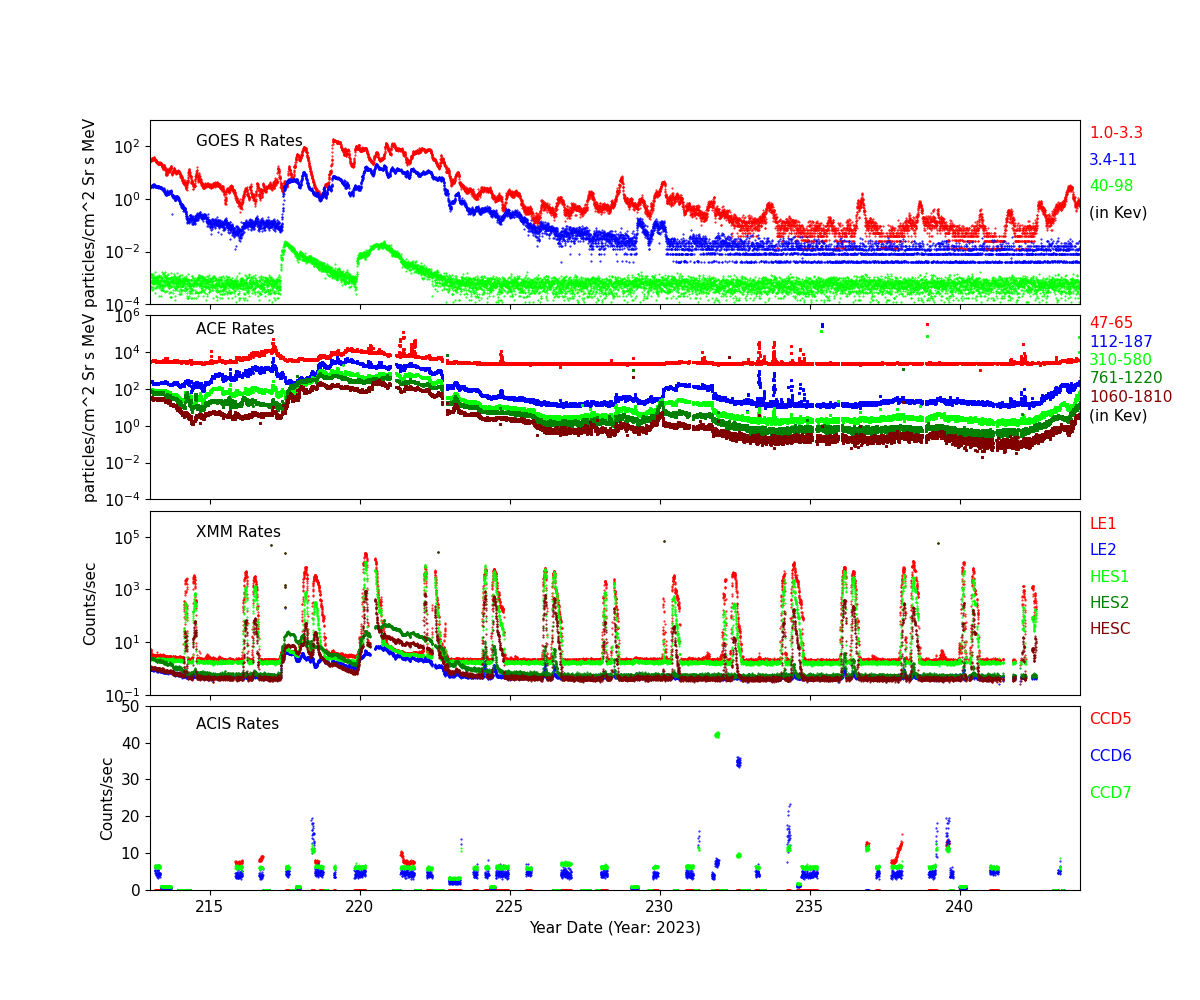
Radiation History
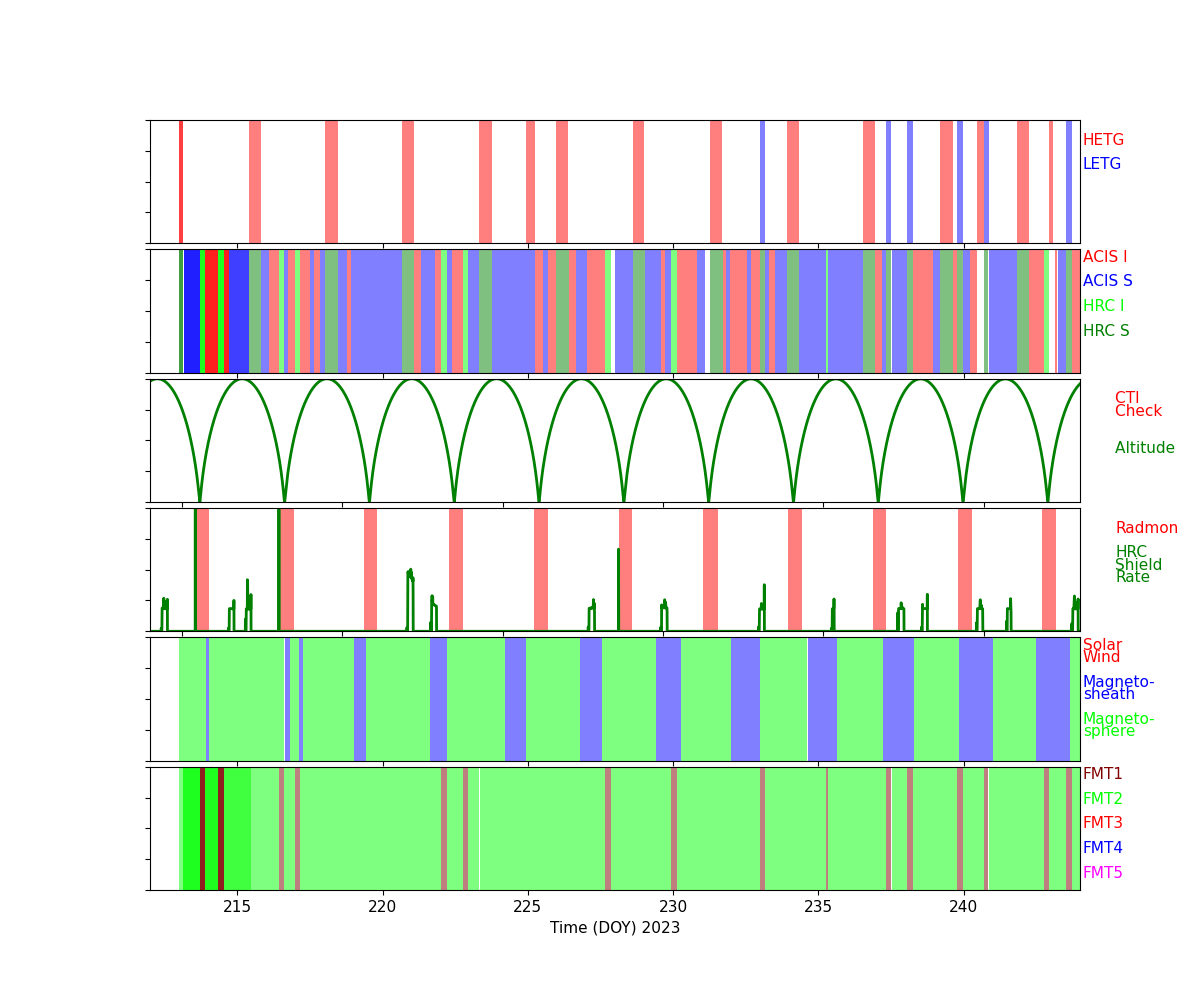
Radiation Count Rates of Aug 2023
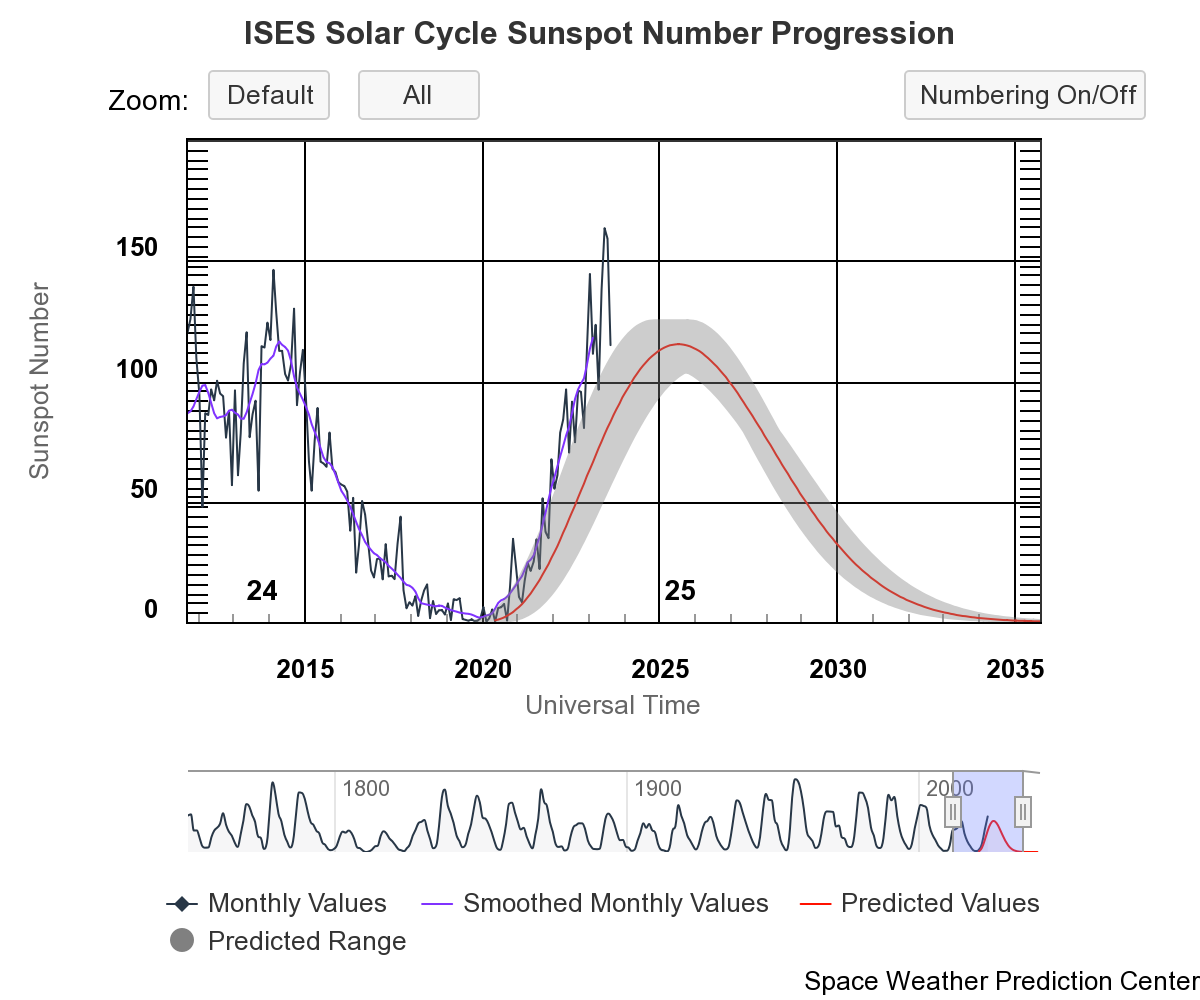
Sun Spot History (See:NOAA Page)
Trending
Quarterly Trends
- HRC Temperature
| Previous Quarter | |||||||
| MSID | MEAN | RMS | DELTA/YR | DELTA/YR/YR | UNITS | DESCRIPTION | |
| 2ceahvpt | 0.001 | 5.568e-04 | (2.79+/-0.01)e2 | 0.14 +/- 0.41 | K | CEA RADIATOR TEMPERATURE AT CENTER | |
|---|---|---|---|---|---|---|---|
| 2chtrpzt | 7.657e-04 | 5.485e-04 | (2.76+/-0.01)e2 | 0.15 +/- 0.40 | K | CENTRAL ELECTRONICS BOX TEMP | |
| 2condmxt | 0.001 | 8.217e-04 | (2.70+/-0.02)e2 | -0.87 +/- 0.54 | K | CONDUIT -X FACE TEMPERATURE | |
| 2dcentrt | 7.479e-04 | 2.794e-04 | (2.74+/-0.01)e2 | 0.17 +/- 0.21 | K | DETECTOR HOUSING TEMP 2 | |
| 2dtstatt | 0.003 | 4.523e-04 | (2.70+/-0.01)e2 | 0.07 +/- 0.32 | K | DETECTOR HOUSING TEMP 1 | |
| 2fhtrmzt | 0.006 | 0.001 | (2.65+/-0.03)e2 | -1.01 +/- 0.91 | K | FRONT END ELECTRONICS BOX TEMPERATURE | |
| 2fradpyt | 0.005 | 0.001 | (2.63+/-0.03)e2 | -1.18 +/- 0.88 | K | FRONT END ASSEMBLY +Y AT RADIATOR CENTER TEMP | |
| 2pmt1t | -0.003 | 6.786e-04 | (2.83+/-0.02)e2 | 0.12 +/- 0.42 | K | PMT 1 TEMPERATURE | |
| 2pmt2t | -0.002 | 6.911e-04 | (2.83+/-0.02)e2 | 0.21 +/- 0.43 | K | PMT 2 TEMPERATURE | |
| 2uvlspxt | -6.398e-04 | 4.948e-04 | (2.75+/-0.01)e2 | 0.36 +/- 0.36 | K | UV LIGHT SHIELD NEXT TO SNOUT TEMP | |
- HRC HK
| Previous Quarter | |||||||
| MSID | MEAN | RMS | DELTA/YR | DELTA/YR/YR | UNITS | DESCRIPTION | |
| 2fe00atm | -3.621e-04 | 0.006 | -1.20 +/- 3.15 | 0.56 +/- 0.12 | C | Front end temperature | |
|---|---|---|---|---|---|---|---|
| 2fepratm | on | 0.075 | 0.004 | 25.19 +/- 1.89 | -2.48 +/- 1.79 | C | FE temp card temperature | off | 3.976e-04 | 0.005 | -1.11 +/- 3.12 | 0.57 +/- 0.11 |
| 2imhvatm | on | 0.046 | 0.003 | 31.71 +/- 1.25 | -1.31 +/- 1.13 | C | Imaging det HVPS temperature | off | 0.008 | 0.003 | 16.31 +/- 1.64 | -0.02 +/- 0.12 |
| 2iminatm | on | 0.064 | 0.003 | 20.52 +/- 1.59 | -1.25 +/- 1.57 | C | Imaging det temperature | off | 0.002 | 0.001 | 1.29 +/- 0.67 | 0.27 +/- 0.06 |
| 2lvplatm | on | 0.036 | 0.003 | 28.00 +/- 1.17 | -1.19 +/- 1.10 | C | LVPS plate temperature | off | -0.003 | 0.003 | 10.20 +/- 1.51 | 0.14 +/- 0.09 |
| 2prbscr | on | 0.001 | 1.075e-04 | 1.76 +/- 0.05 | -0.03 +/- 0.05 | AMP | Primary bus current | off | 7.708e-06 | 2.818e-05 | 1.71 +/- 0.02 | (8.30+/-152.50)e-5 |
| 2prbsvl | 9.826e-04 | 2.024e-04 | 26.76 +/- 0.12 | -0.04 +/- 0.01 | V | Primary bus voltage | |
| 2smtratm | on | 2.481e-13 | 2.768e-09 | 5.94 +/- 0.00 | (2.46+/-13.58)e-13 | C | Selected motor temperature | off | -3.541e-15 | 999.000 | 5.66 +/- 0.00 | (2.67+/-1.54)e-14 |
| 2sphvatm | on | -0.002 | 0.003 | 31.48 +/- 1.19 | -0.02 +/- 1.24 | C | Spect det HVPS temperature | off | -0.018 | 0.003 | 16.55 +/- 1.78 | 0.31 +/- 0.08 |
| 2spinatm | on | 0.054 | 0.003 | 19.08 +/- 1.49 | -1.14 +/- 1.53 | C | Spect det temperature | off | -0.001 | 0.001 | 3.46 +/- 0.78 | 0.09 +/- 0.05 |
- PCAD Temperature
| Previous Quarter | |||||||
| MSID | MEAN | RMS | DELTA/YR | DELTA/YR/YR | UNITS | DESCRIPTION | |
| aacccdpt | 5.140e-05 | 7.863e-04 | (2.65+/-0.02)e2 | 0.47 +/- 0.47 | K | AC CCD TEMP (PRI) | |
|---|---|---|---|---|---|---|---|
| aacccdrt | 1.529e-04 | 8.473e-04 | (3.09+/-0.02)e2 | 0.57 +/- 0.51 | K | AC CCD TEMP (RDNT) | |
| aach1t | 2.078e-04 | 8.645e-04 | (3.06+/-0.02)e2 | 0.46 +/- 0.52 | K | AC HOUSING TEMP (ACH1) | |
| aach2t | 2.692e-04 | 8.665e-04 | (3.06+/-0.02)e2 | 0.54 +/- 0.52 | K | AC HOUSING TEMP (ACH2) | |
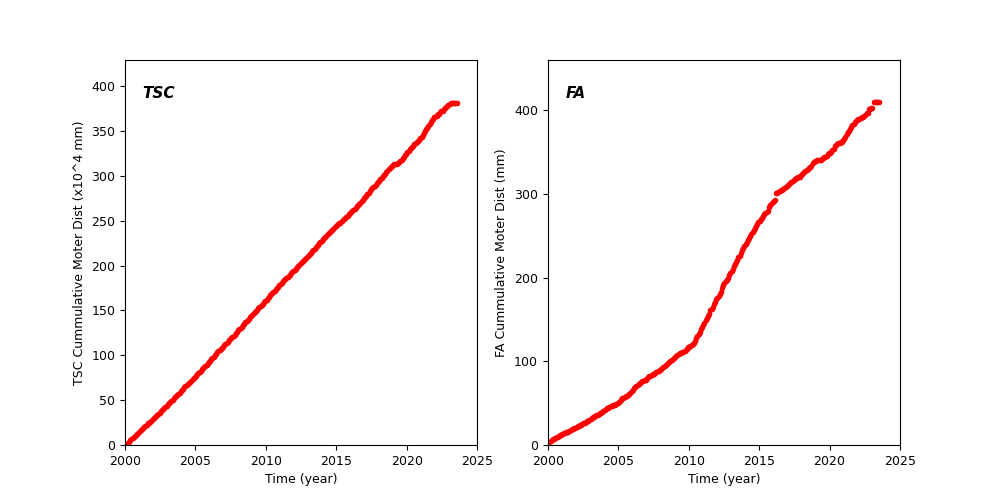
Spacecraft Motions
TSC and FA Cummulative Moter Distance
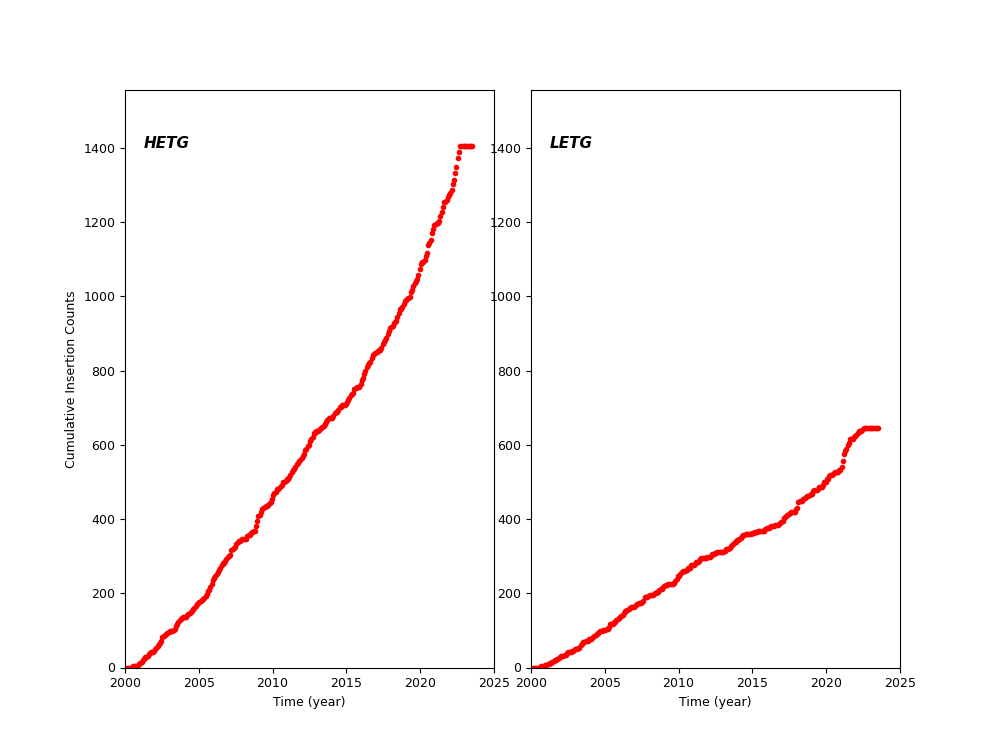
HETG and LETG Cummulative Insertion Counts
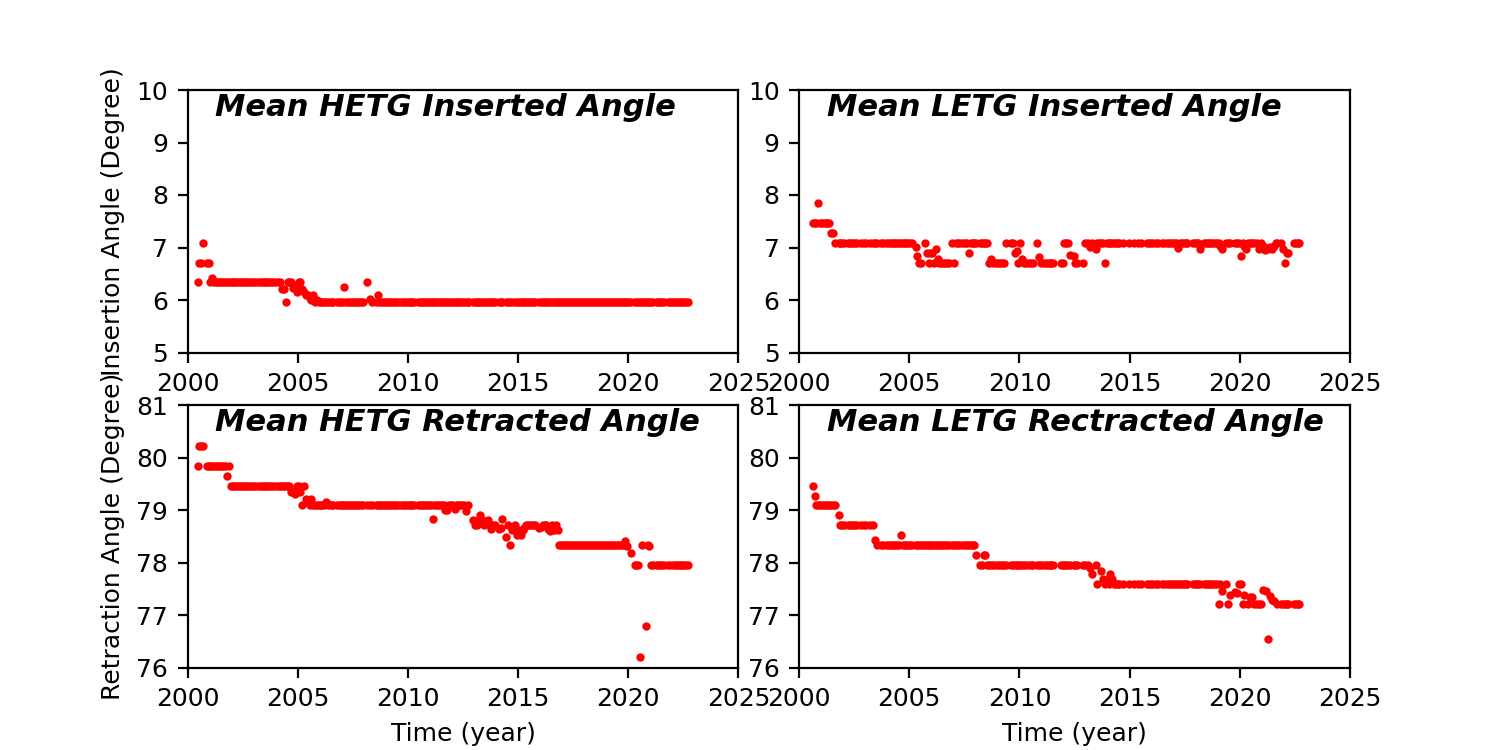
HETG/LETG Insertion/Retraction Angle
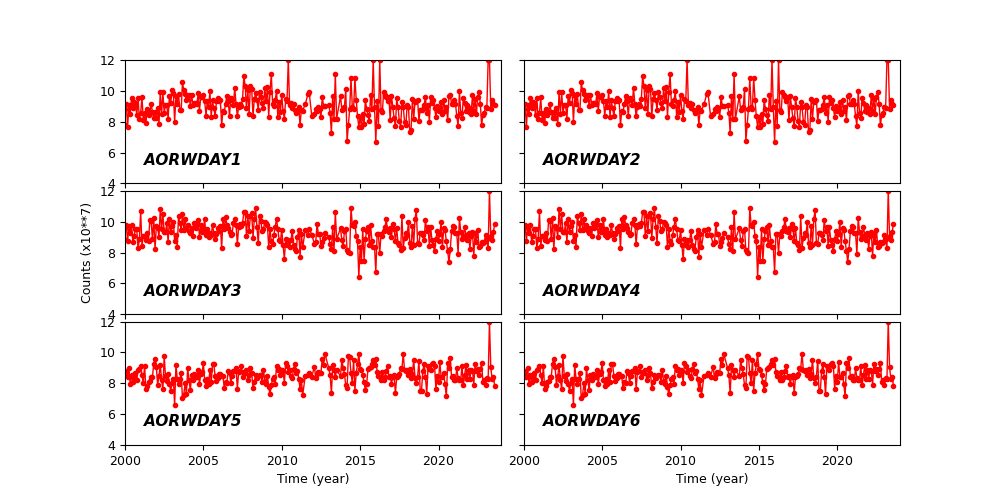
Reaction Wheel Rotations