ACIS
ACIS DOSE Registered-Photon-Map
The steps we took to compute the dose map are;
- Level 1 Event files for a specified month are obtained from archive.
- Image data including I2, I3, S2, S3 CCDs are extracted from all event files.
- All the extracted image data were merged to create a month long exposure map for the month.
- The exposure map is opened with ds9, and check a distribution of count rates against energy. From this, estimate the upper threshold value. Any events beyond this upper threshold are assumed erroneous events such as bad pixels.
- Using this upper threshold, the data is filtered, and create a cleaned exposure map for the month.
- The exposure map from each month from the Sep 1999 is added up to create a cumulative exposure map for each month.
- Using fimgstatistic, we compute count rate statistics for each CCDs.
- For observations with high data drop rates (e.g., Crab nebula, Cas A), we corrected the observations by adding events.
Please check more detail plots at Telemetered Photon Dose Trend page.
)
)
)
Statistics:
# IMAGE     NPIX     MEAN        RMS        MIN     MAX
ACIS_sep23 6004901       4.140         7.100           0.0     3776


I2 node 0  262654	3.428892	2.117224	0.0	 56.0
I2 node 1  262654	3.562036	2.901363	0.0	946.0
I2 node 2  262654	3.550999	2.167794	0.0	 78.0
I2 node 3  262654	3.610672	2.341177	0.0	243.0

I3 node 0  262654	4.895354	2.672449	0.0	 71.0
I3 node 1  262654	4.675326	6.113097	0.0	2852.0
I3 node 2  262654	4.407220	2.400368	0.0	 52.0
I3 node 3  262654	4.332968	2.410174	0.0	137.0

S2 node 0  262654	4.594420	3.826814	0.0	338.0
S2 node 1  262654	5.043413	4.707400	0.0	204.0
S2 node 2  262654	6.860501	12.034050	0.0	2822.0
S2 node 3  262654	6.650695	9.380145	0.0	359.0

S3 node 0  262654	7.388469	10.377744	0.0	162.0
S3 node 1  262654	7.737667	10.625712	0.0	3776.0
S3 node 2  262654	9.248974	10.386834	0.0	120.0
S3 node 3  262654	8.813963	11.407523	0.0	133.0
)
)
)
Statistics:
 IMAGE     NPIX      MEAN        RMS           MIN      MAX
ACIS_total   6004901       2656.674         3382.358           0.0   153424


I2 node 0  262654	2307.793255	467.127362	492.0	14595.0
I2 node 1  262654	2431.354025	675.916446	505.0	151418.0
I2 node 2  262654	2459.853588	521.247554	531.0	15641.0
I2 node 3  262654	2464.404762	637.809555	492.0	32292.0

I3 node 0  262654	2652.805101	653.259085	495.0	14399.0
I3 node 1  262654	2735.074861	1748.258345	516.0	55958.0
I3 node 2  262654	2445.830720	457.419169	489.0	14770.0
I3 node 3  262654	2425.688375	492.219010	458.0	35522.0

S2 node 0  262654	3096.410428	502.289930	1678.0	22511.0
S2 node 1  262654	3285.077789	747.489125	1859.0	17742.0
S2 node 2  262654	3637.763978	750.094346	2269.0	31984.0
S2 node 3  262654	3600.248957	607.851404	2002.0	78877.0

S3 node 0  262654	5495.153359	2984.059805	2412.0	54773.0
S3 node 1  262654	6711.777626	2384.010539	0.0	68757.0
S3 node 2  262654	5441.449395	1363.531866	2521.0	27449.0
S3 node 3  262654	4260.672919	767.124522	2577.0	26599.0
)
|
)
|
)
|
)
|
| Jun 2023 | Mar 2023 | Dec 2022 | Sep 2022 |
|---|
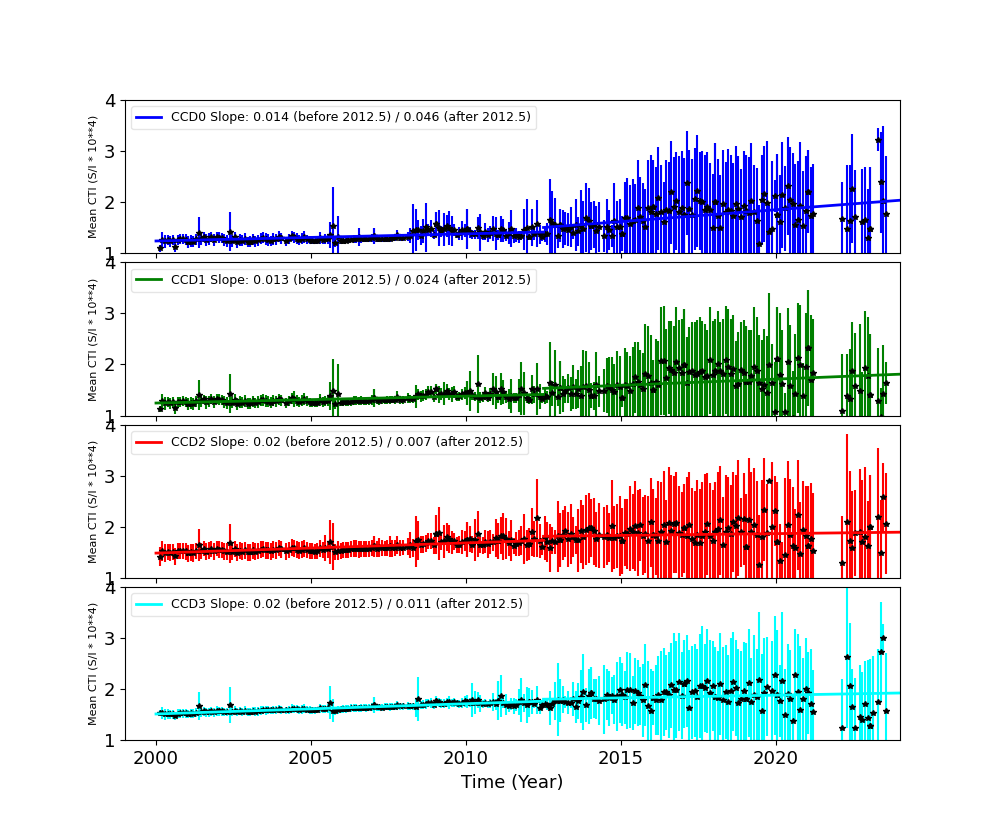
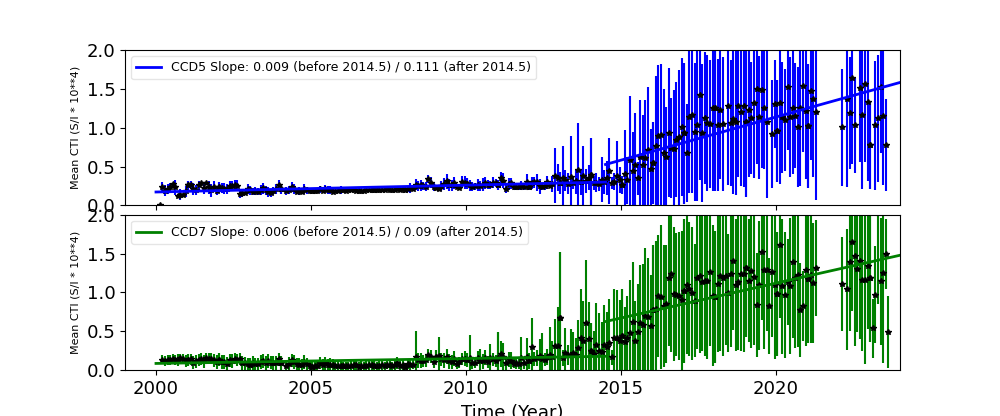
The Mean Detrended CTI
We report CTIs with a refined data definition. CTIs were computed for the temperature dependency corrected data. Please see CTI page for detailed explanation. CTI's are computed for Mn K alpha, and defined as slope/intercept x10^4 of row # vs ADU. Data file: here
Imaging CCDs
Spectral CCDs
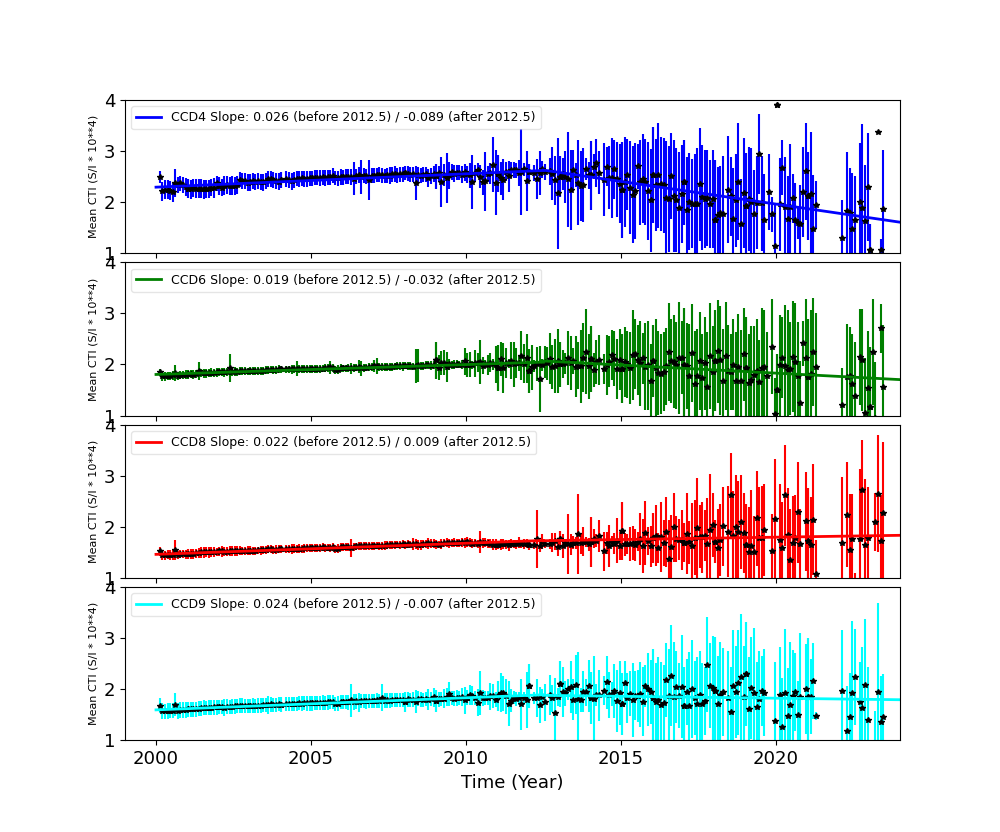
Backside CCDs
Focal Plane Temperature
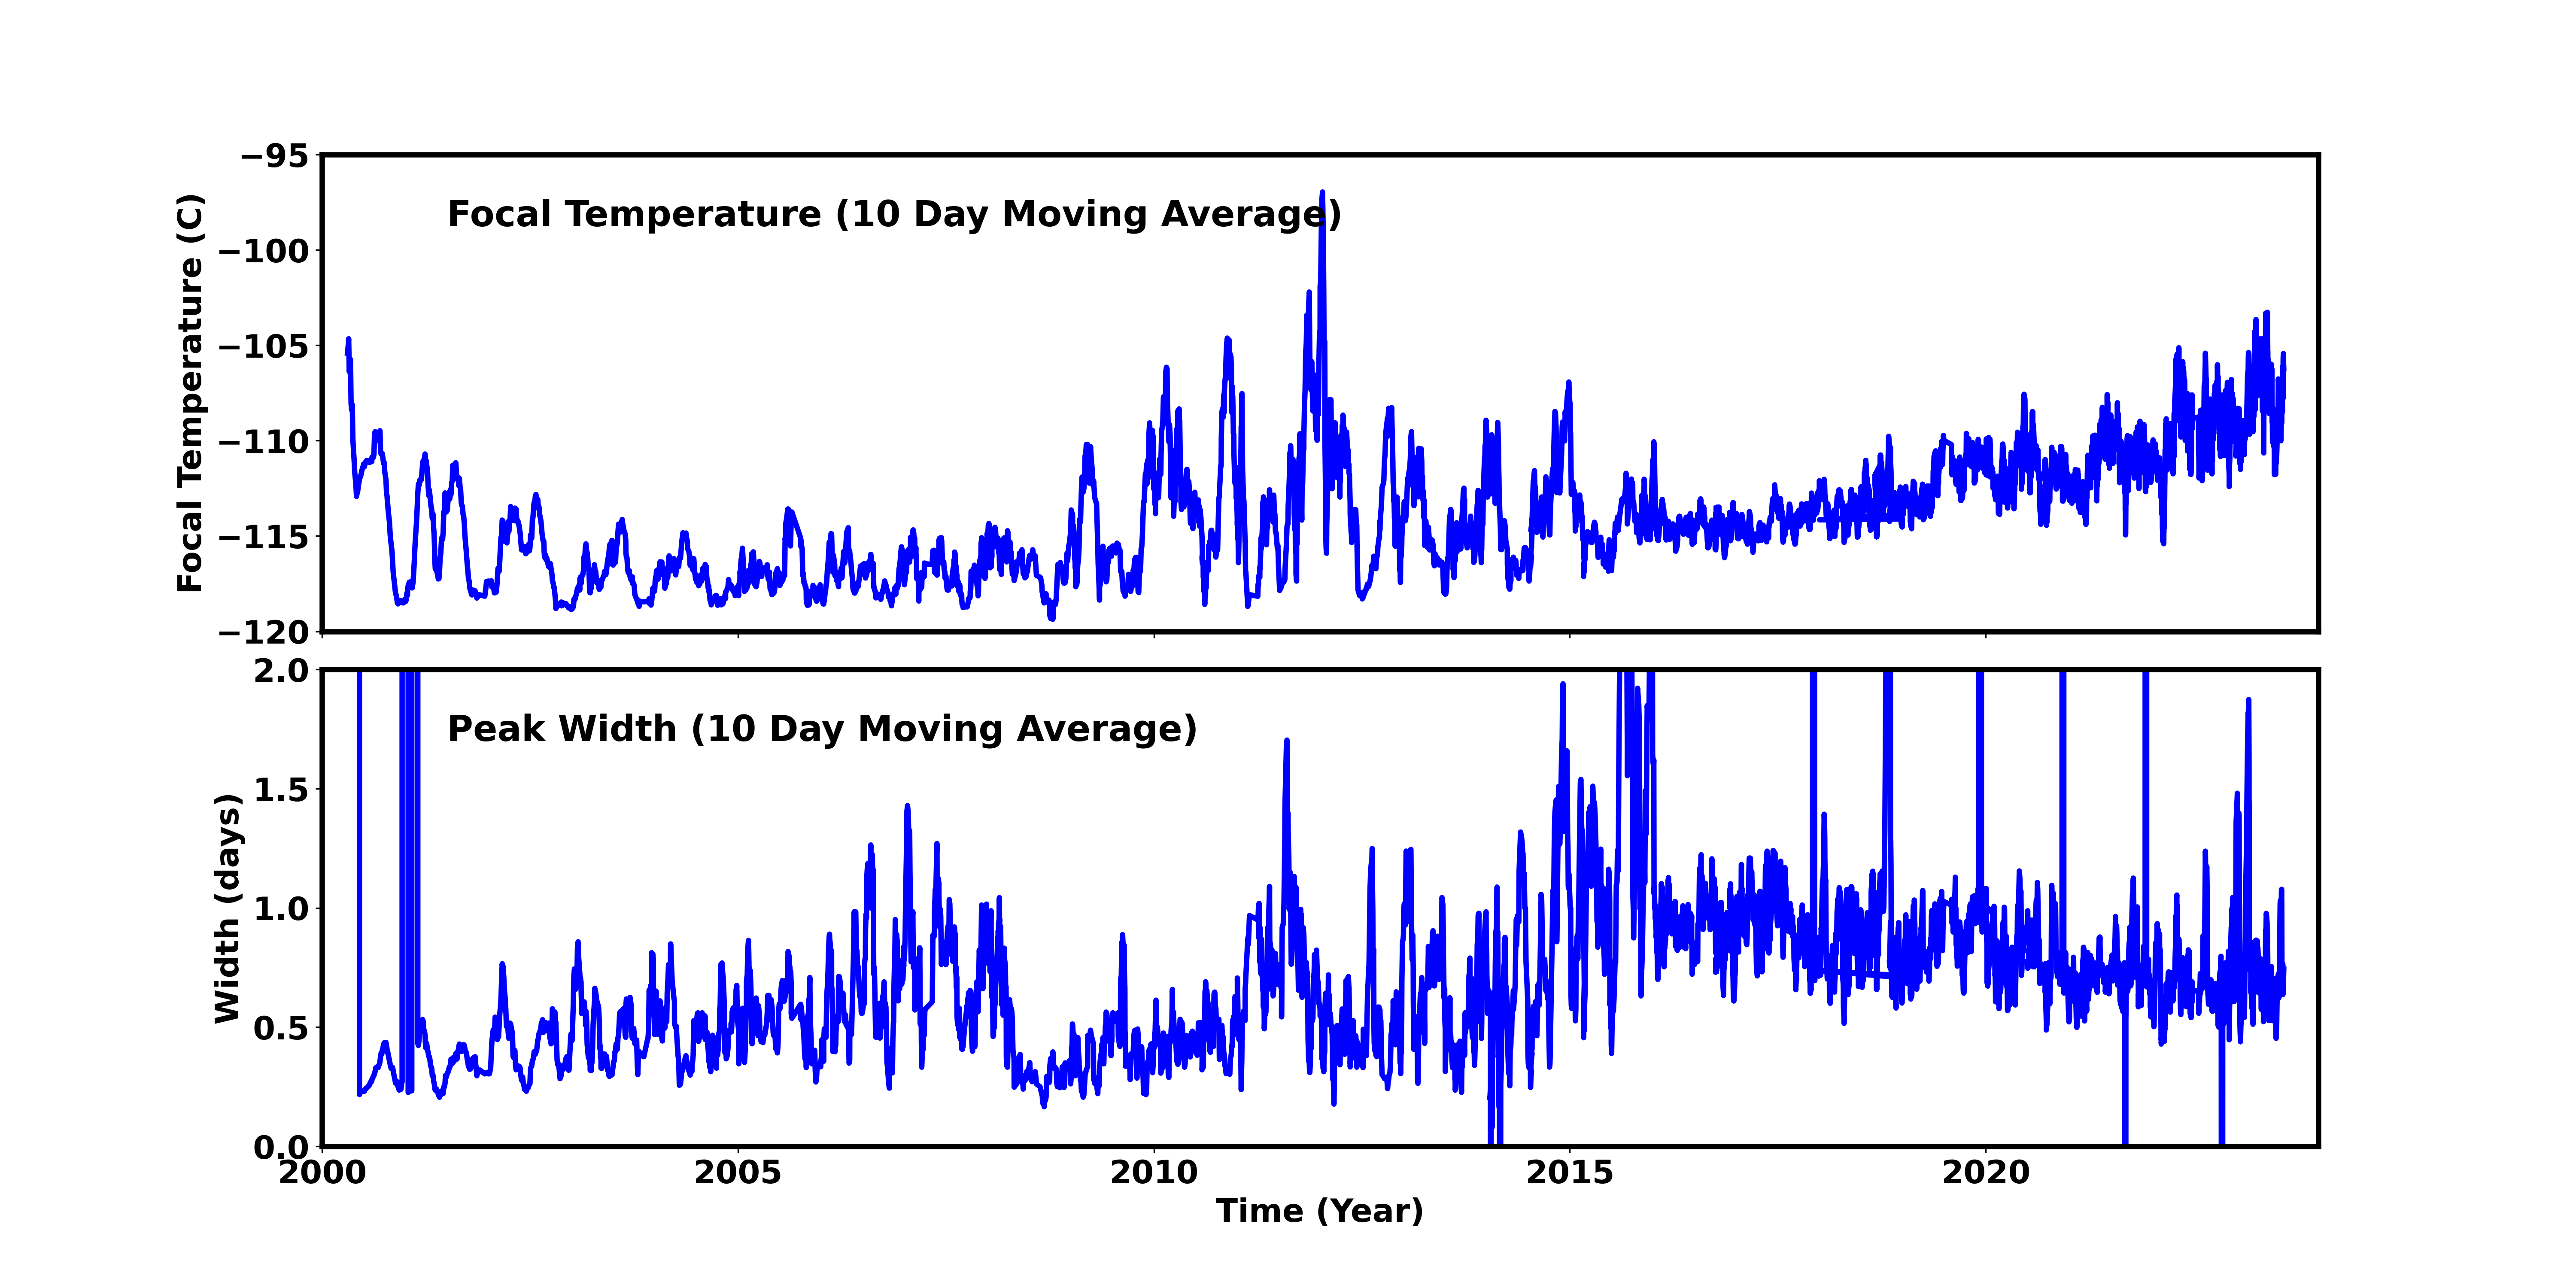
Sep 2023 Focal Temperature
| The Mean (max) FPT: | |
|---|---|
| -107.53 | +/- 7.69 C |
| Mean Width: | |
| 0.8 | +/- 0.58 days |
Averaged Focal Plane Temperature
We are using 10 period moving averages to show trends of peak temperatures and peak widths. Note, the gaps in the width plot are due to missing/corrupted data.
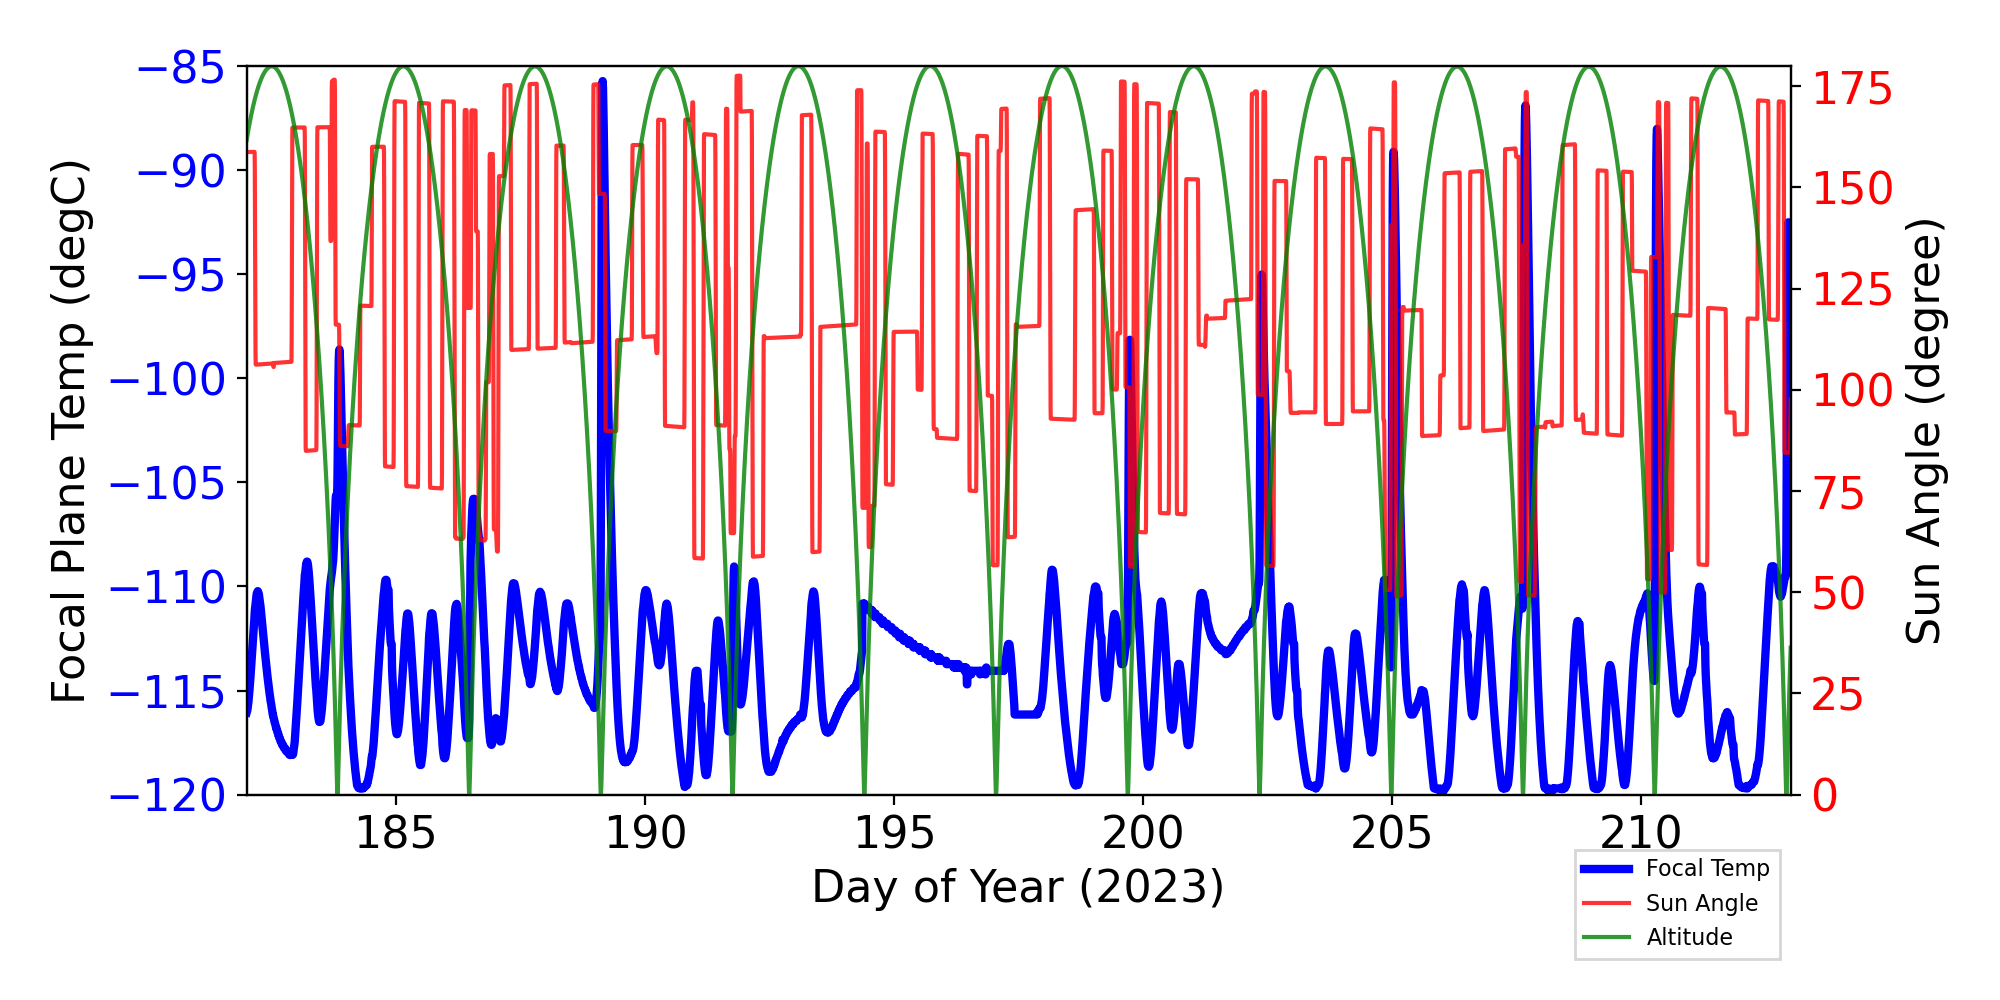
Focal Plane Temperature, Sun Angle and Altitude
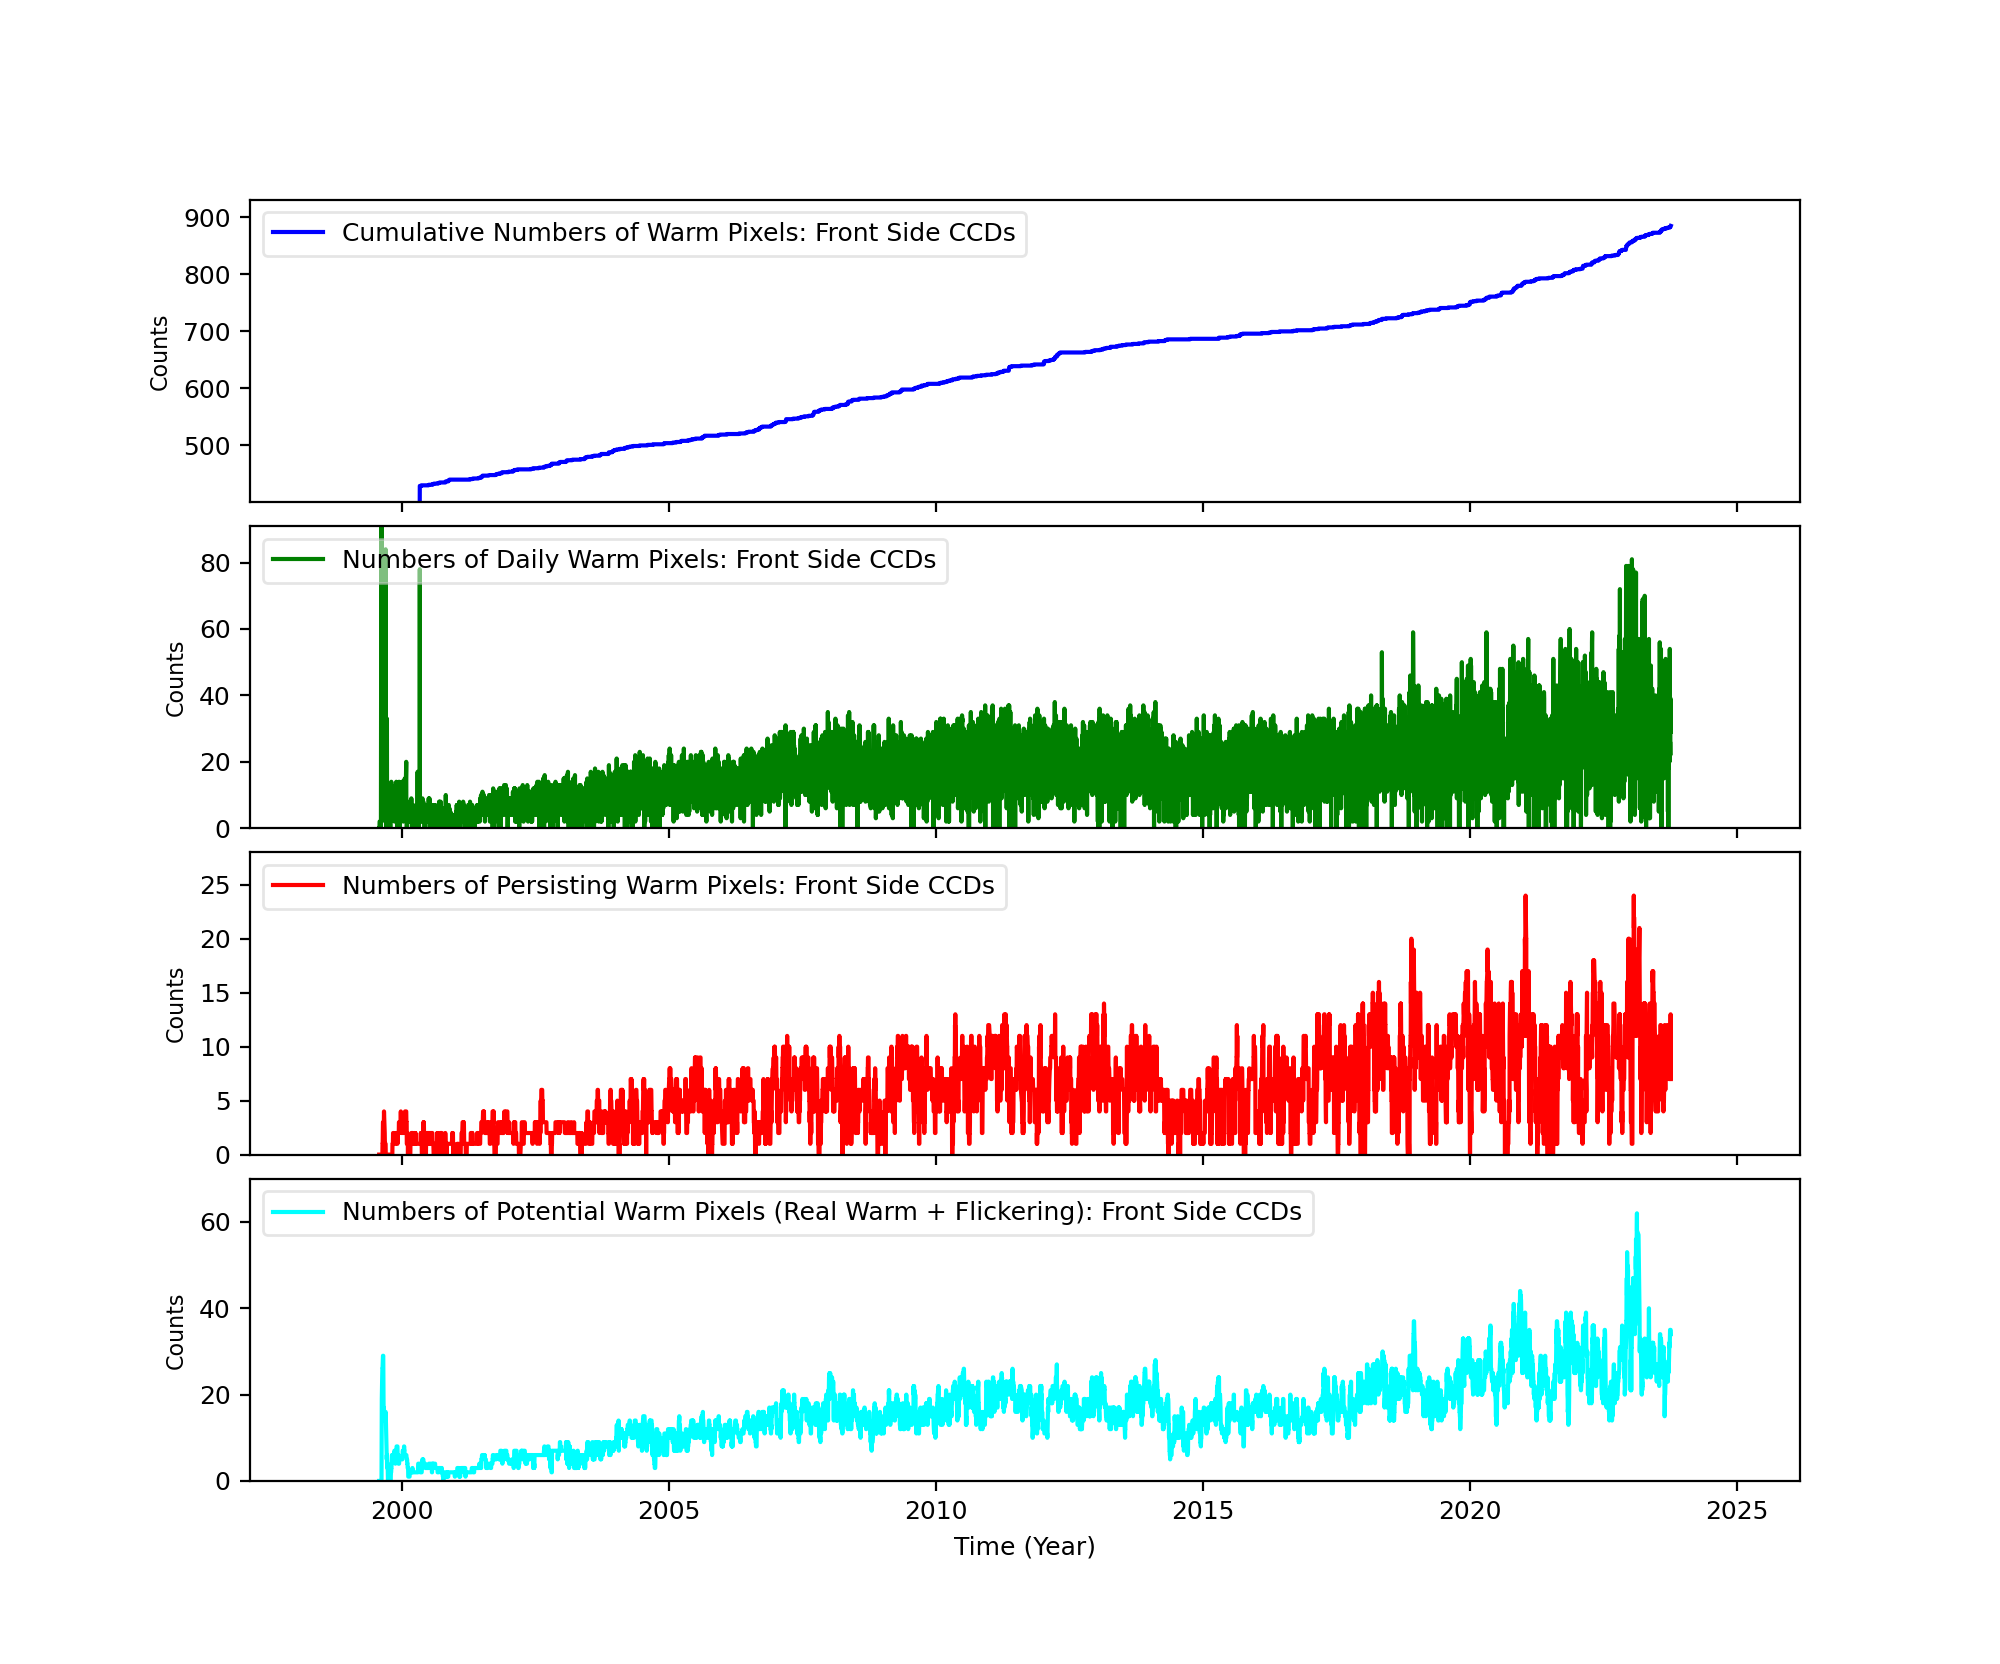
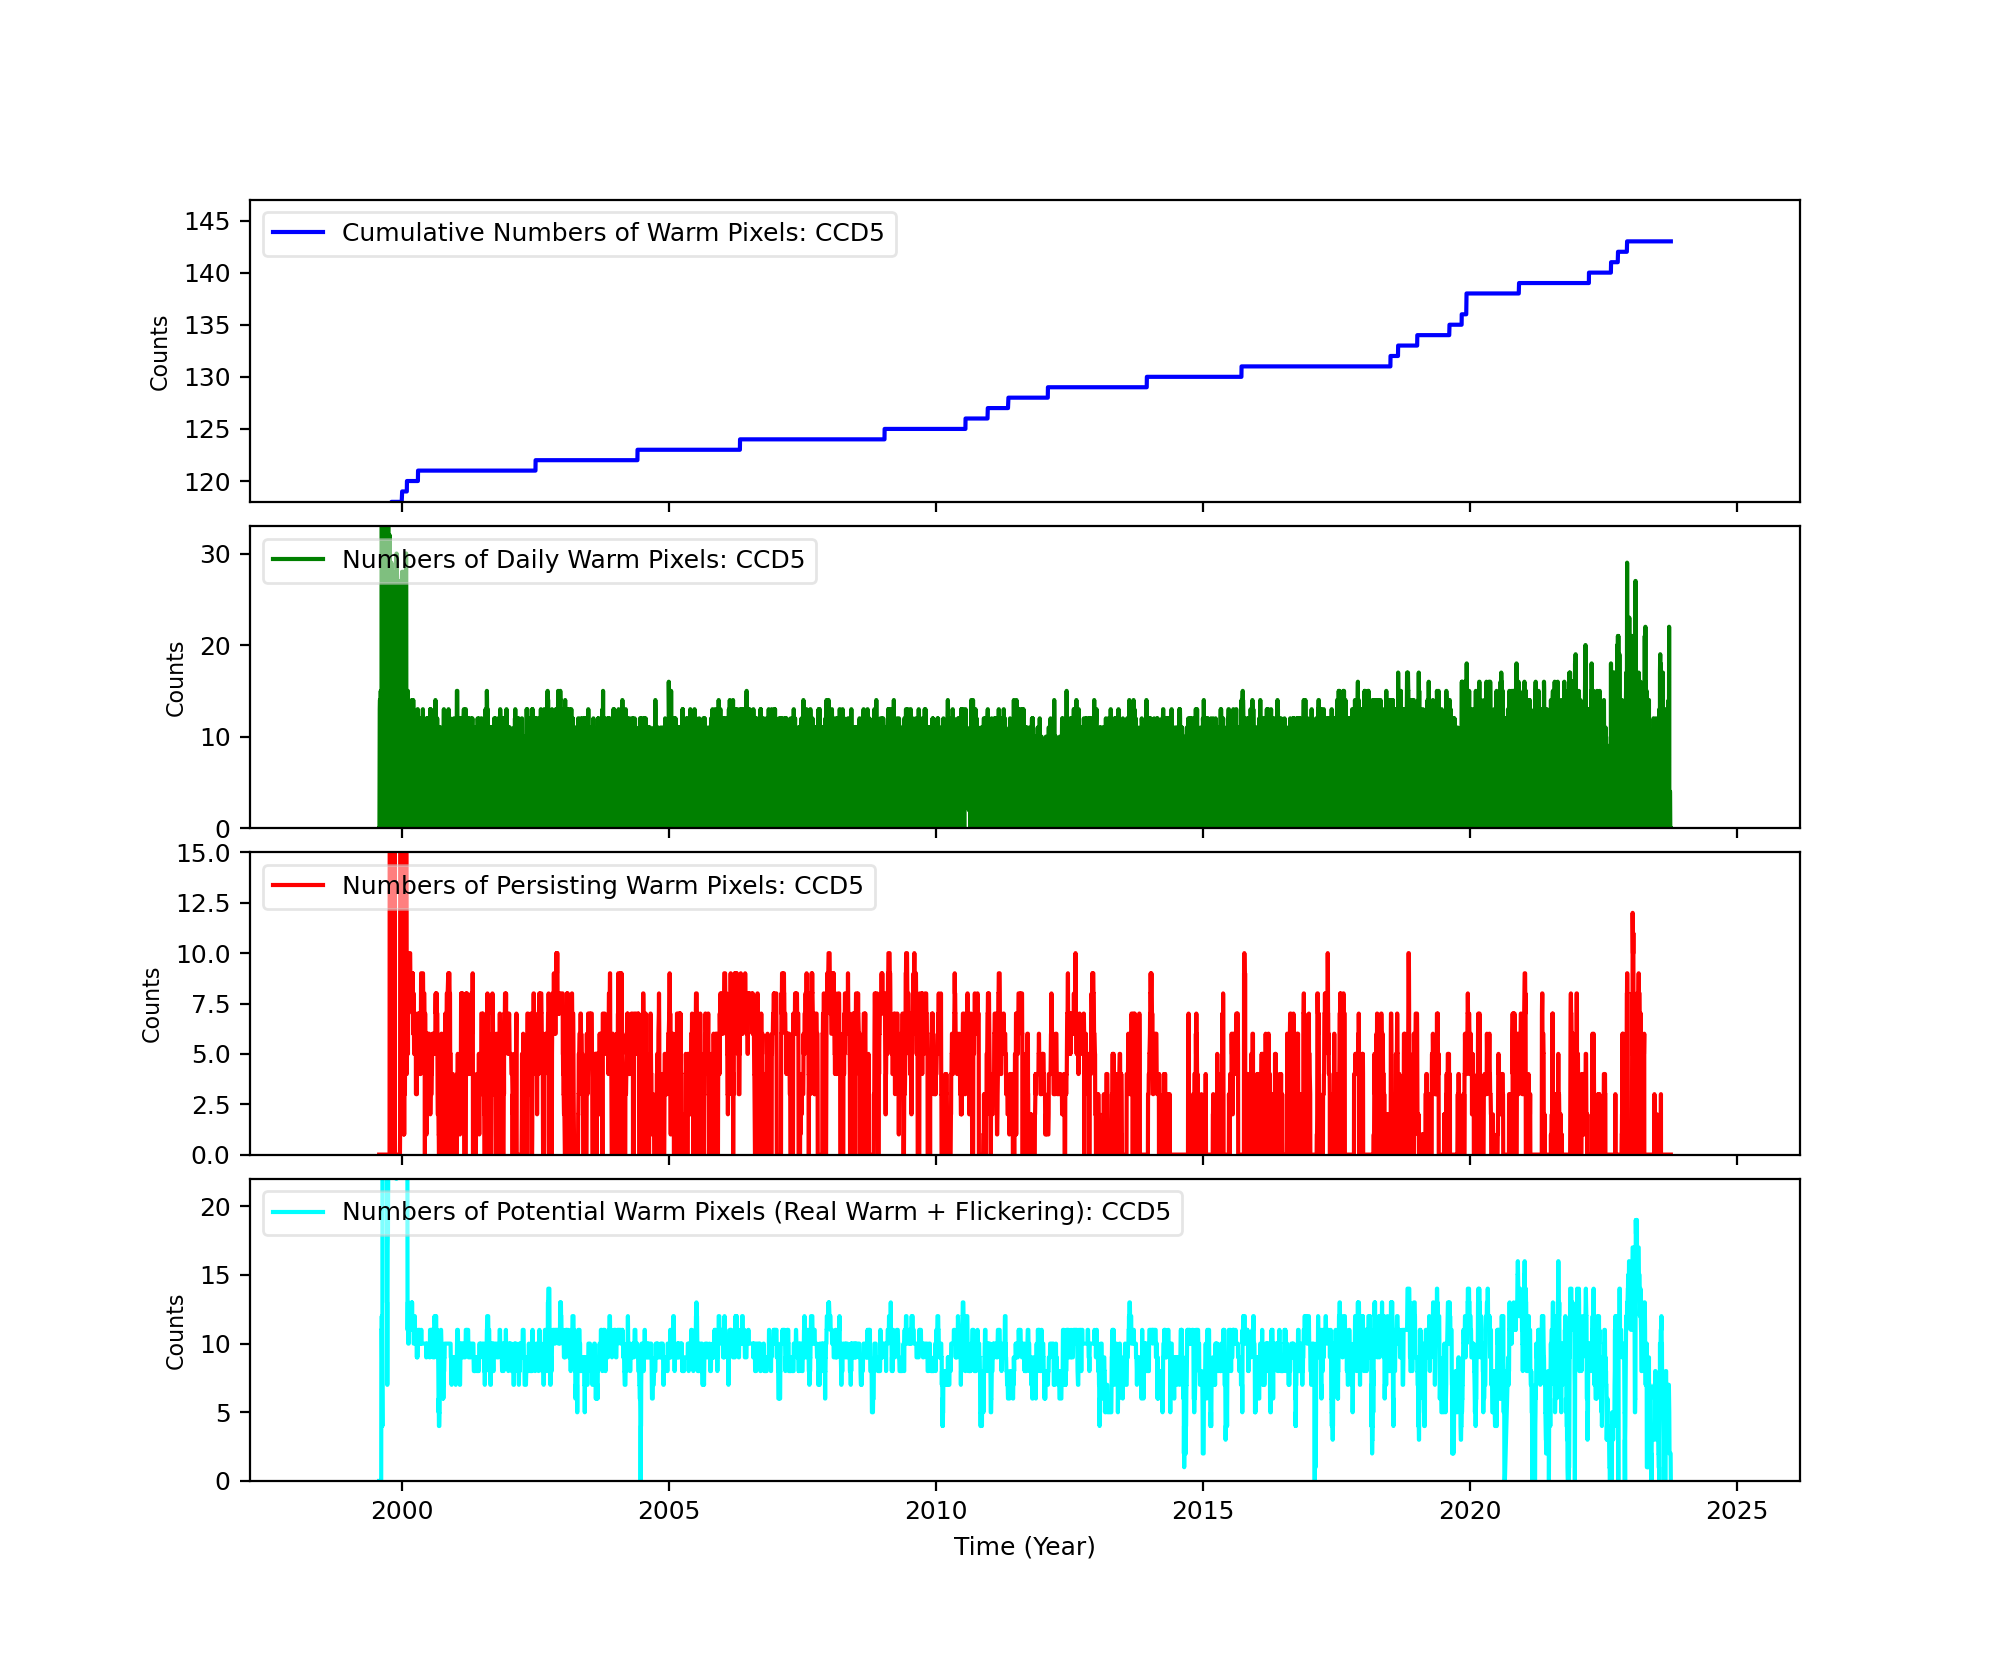
Bad Pixels
The plots below were generated with a new warm pixel finding script. Please see Acis Bad Pixel Page for details.
Front Side CCDs
Back Side CCD (CCD5)
Science Instrument Background Rates
| Name | Low (keV) | High(KeV) | Description |
|---|---|---|---|
| SSoft | 0.00 | 0.50 | Super soft photons |
| Soft | 0.50 | 1.00 | Soft photons |
| Med | 1.00 | 3.00 | Moderate energy photons |
| Hard | 3.00 | 5.00 | Hard Photons |
| Harder | 5.00 | 10.00 | Very Hard photons |
| Hardest | 10.00 | Beyond 10 keV |


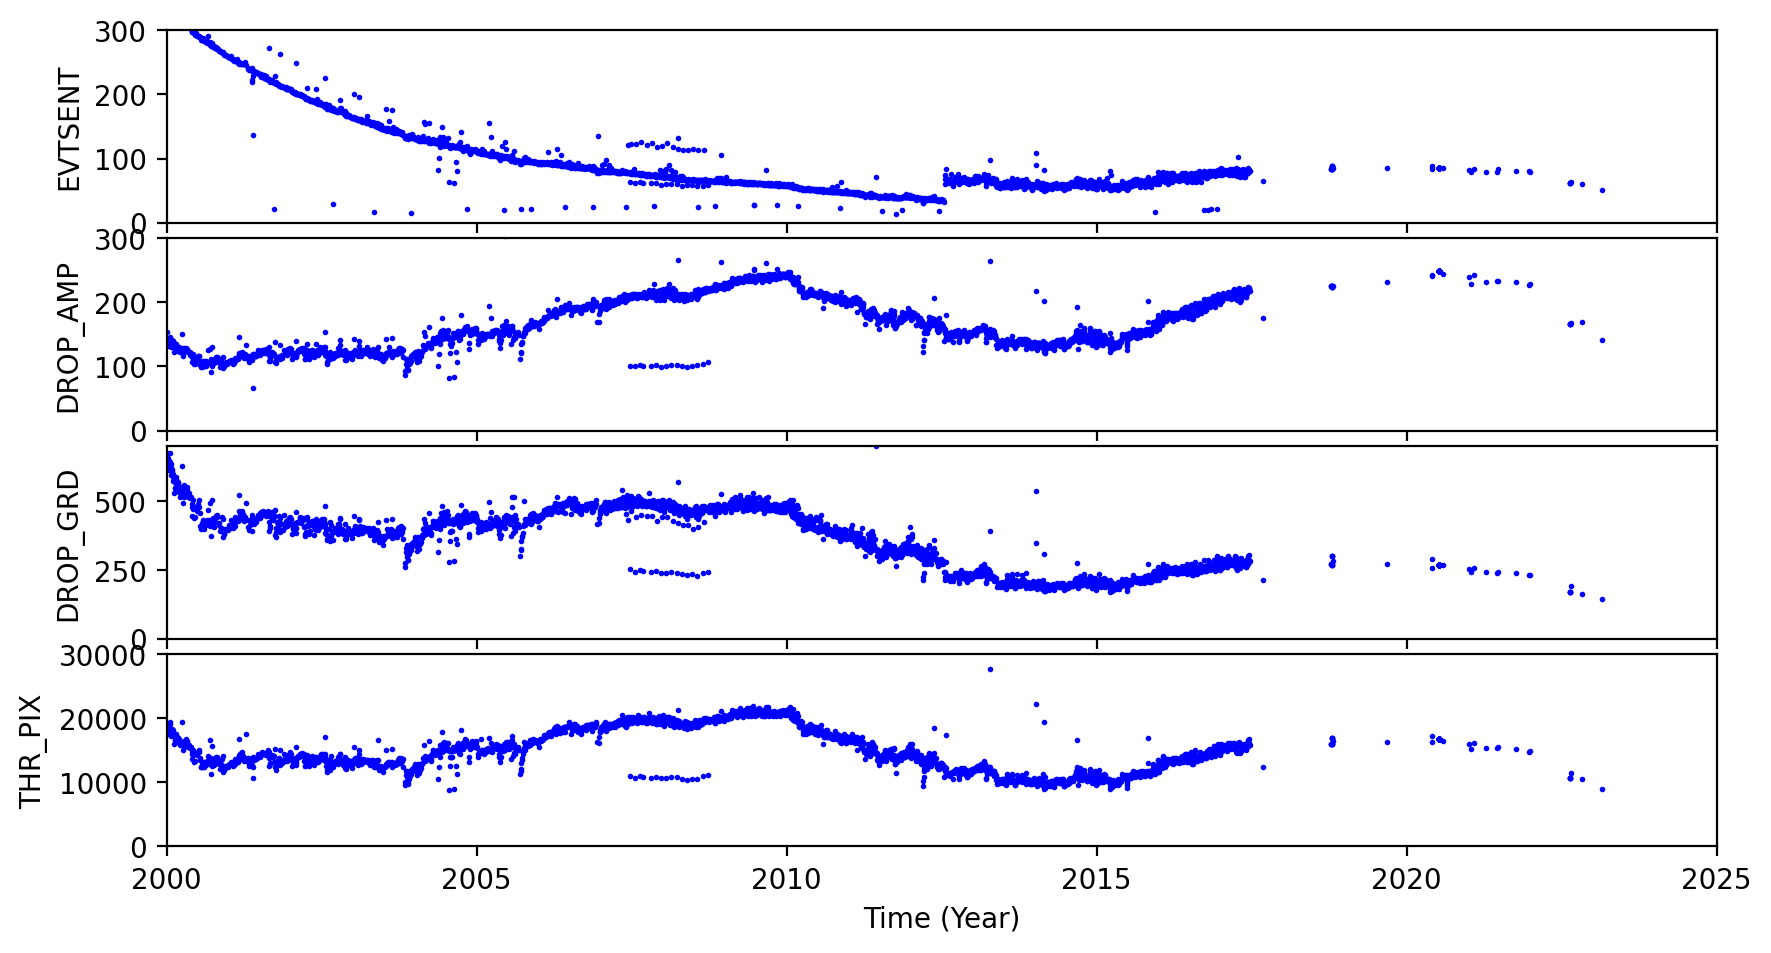
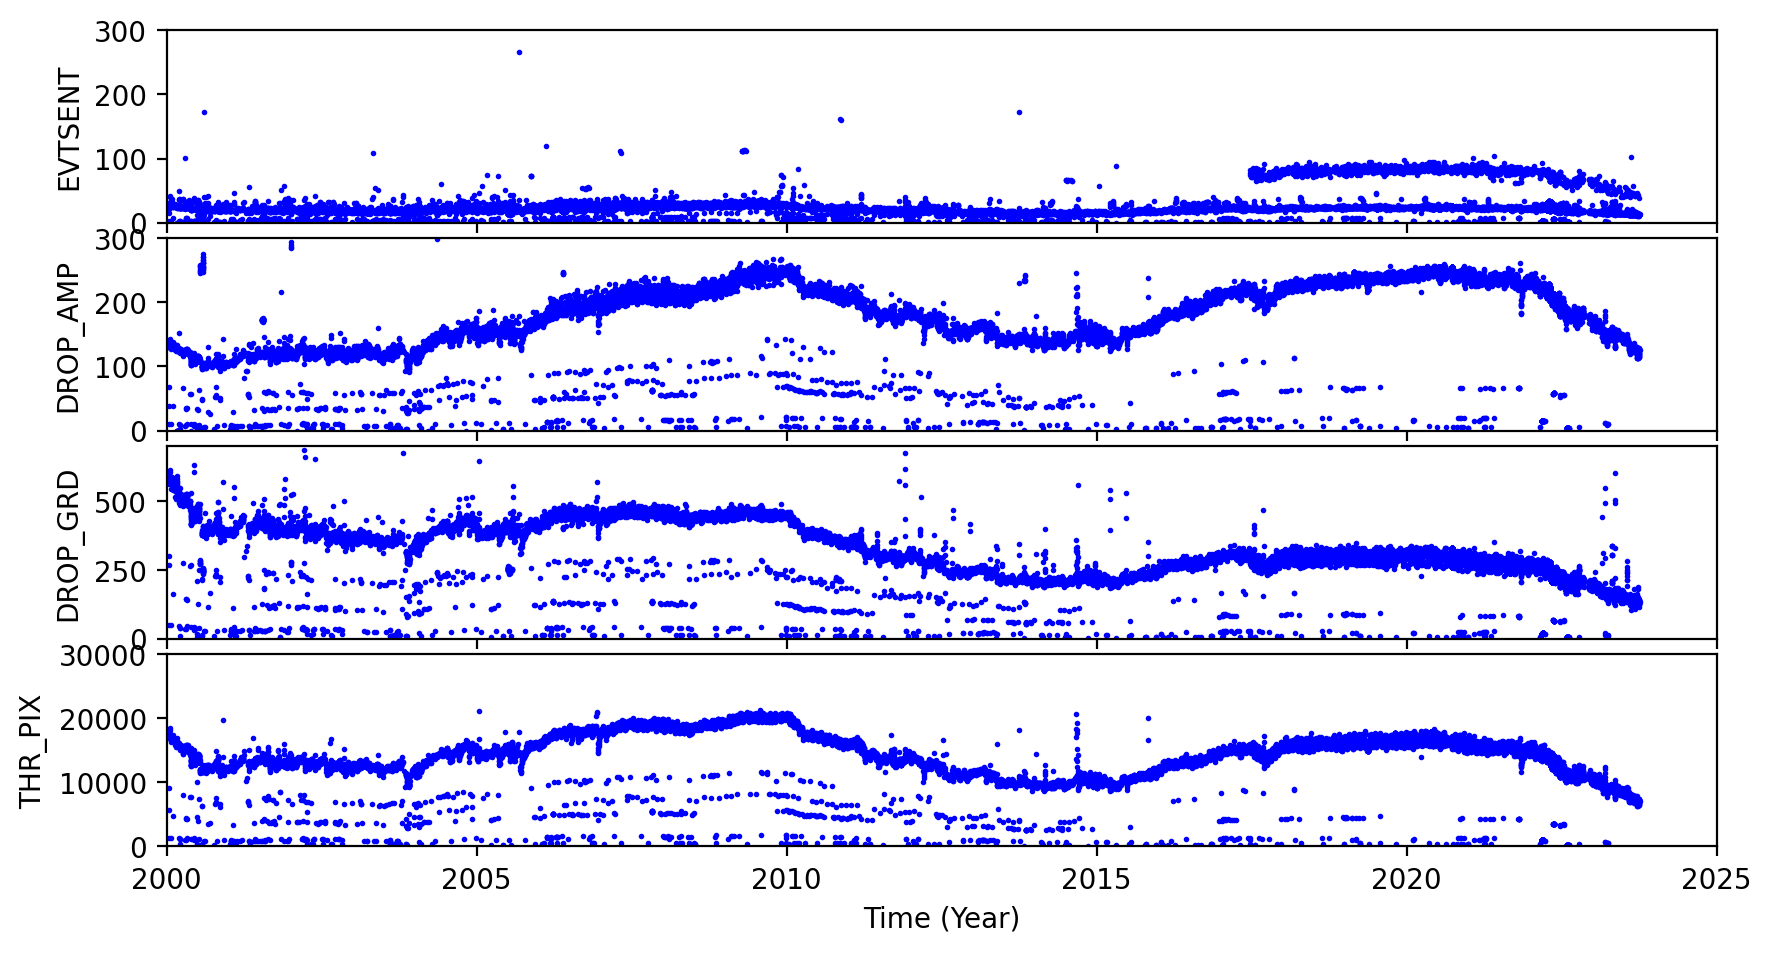
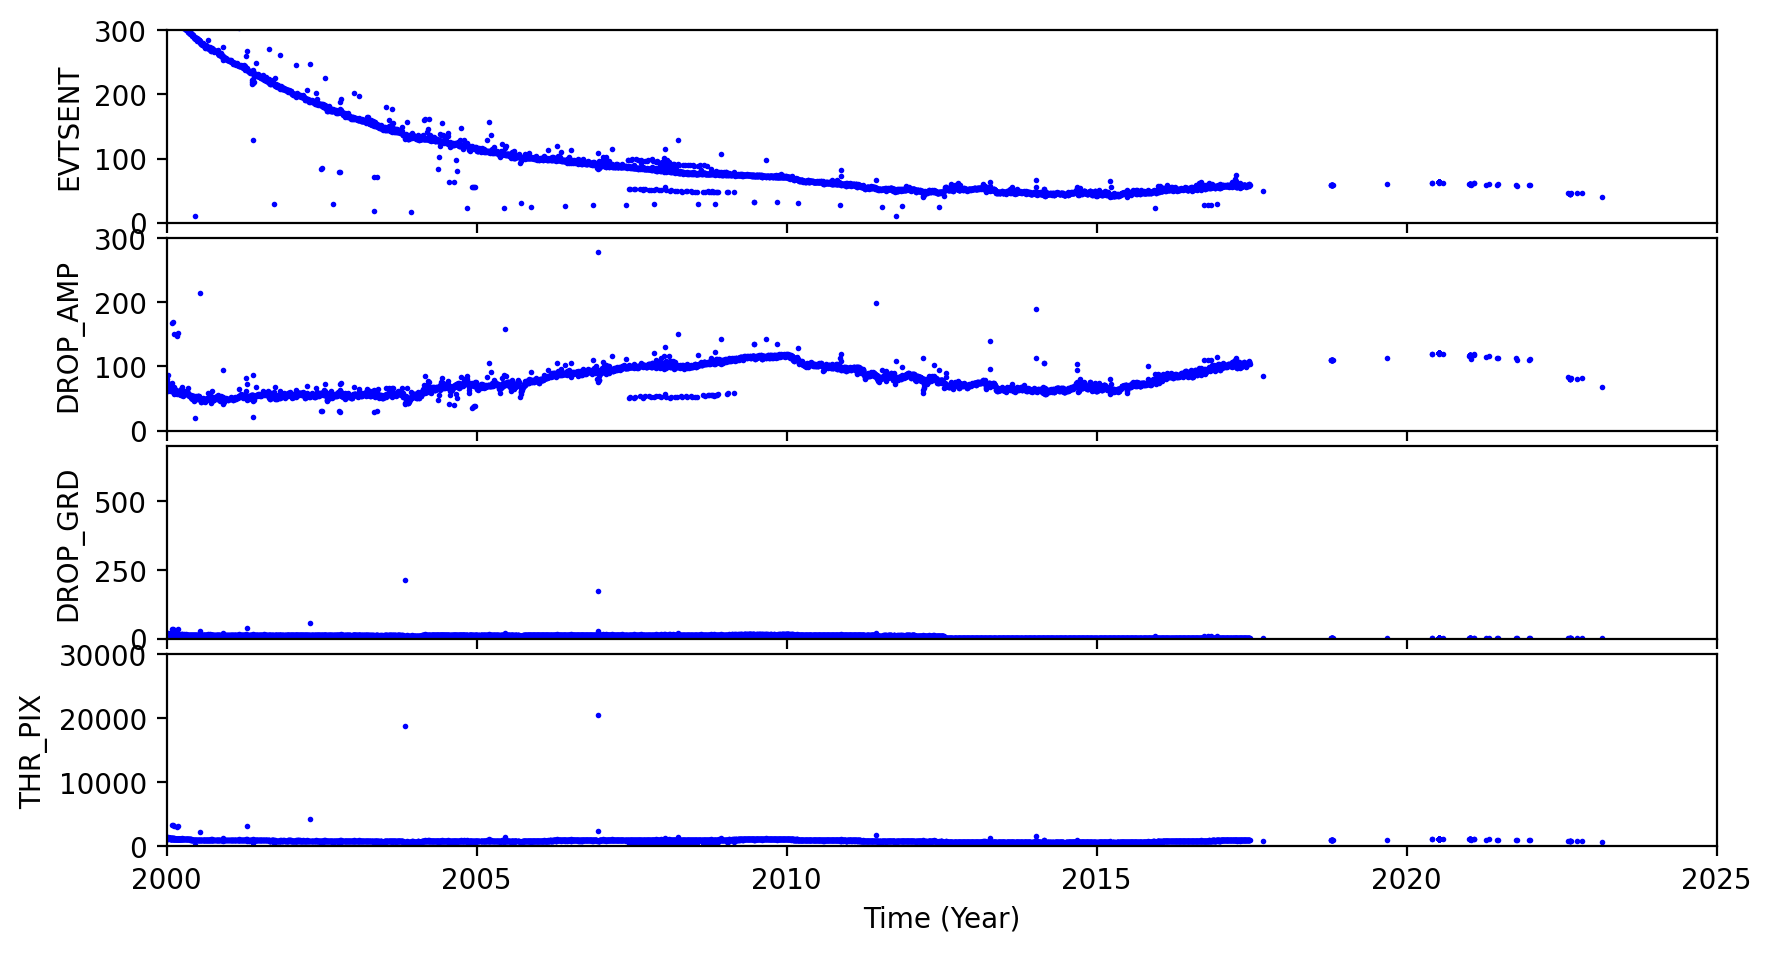
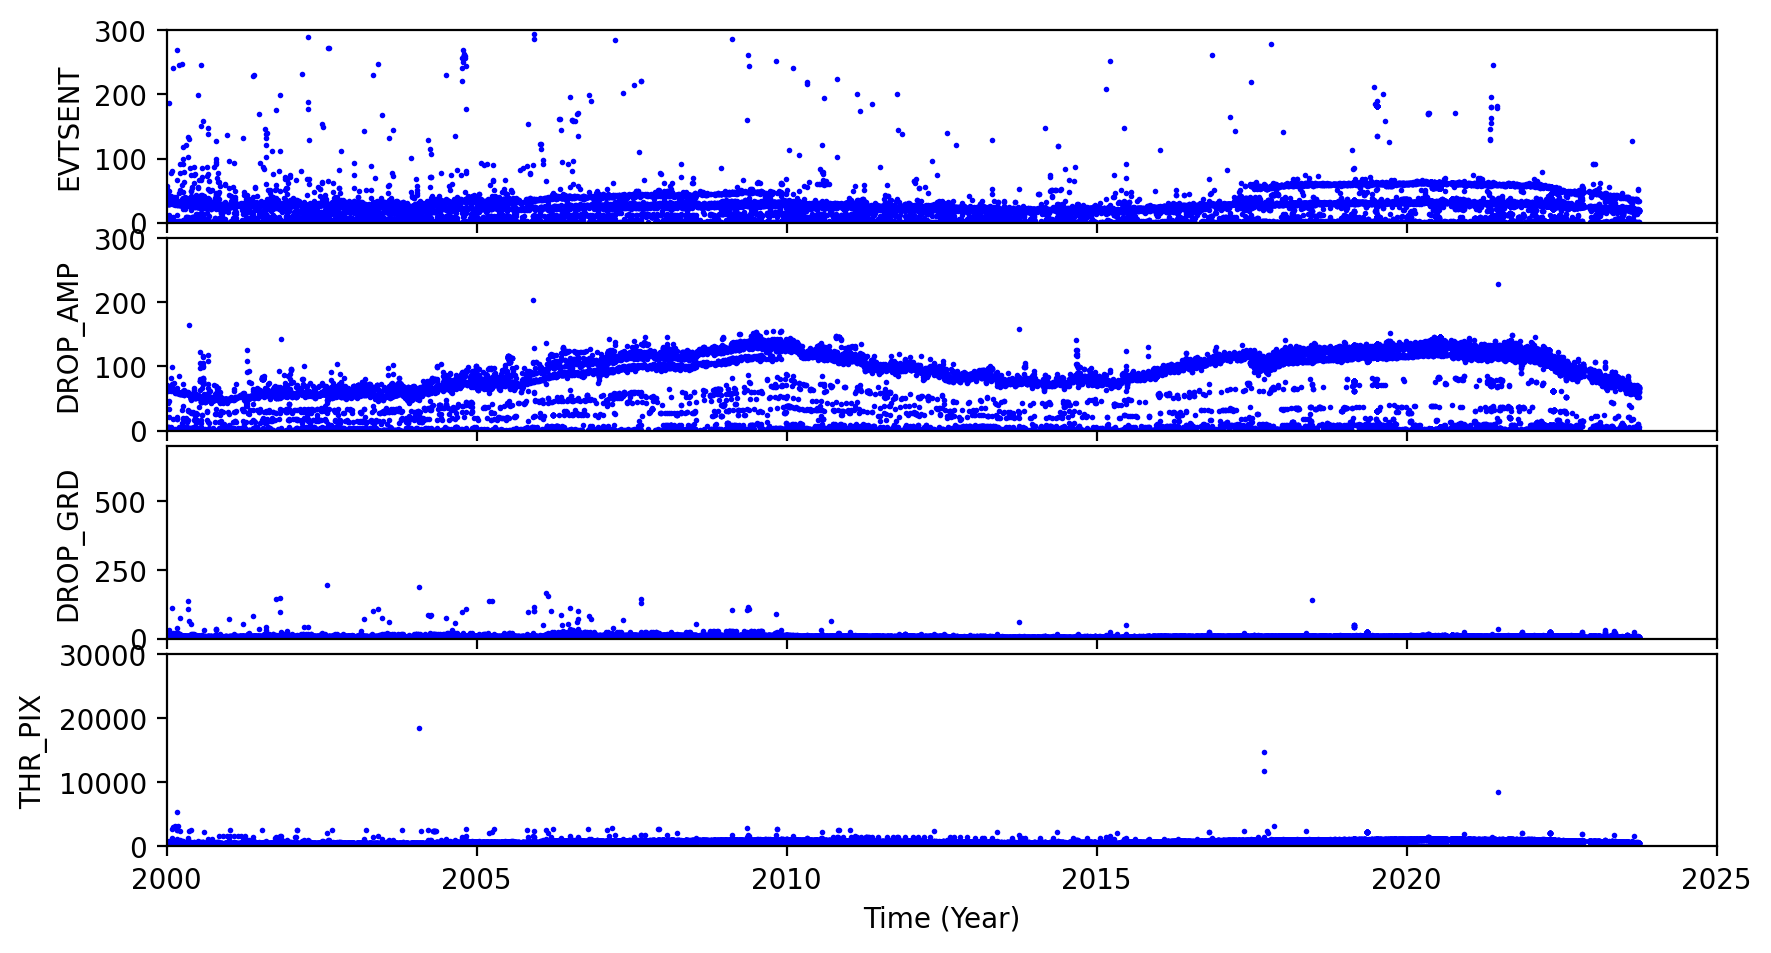
ACIS Rejected Events
The links below are plots of stat1 quantities, showing on-board rejected events. The average EVTSENT, DROP_AMP, DROP_POS, DROP_GRD, THR_PIX, and maximum BERR_SUM obtained from L1 acis*stat1.fits files are plotted for each observation. CTI observations are plotted separately from regular science observations.
Column definitions:
- EVTSENT - number of events sent in data record
- DROP_AMP - number of discarded events due to corrected amplitude
- DROP_POS - number of discarded events due to CCD position
- DROP_GRD - number of discarded events due to grade code
- THR_PIX - number of pixels above respective threshold level
- BERR_SUM - number of pixel bias errors so far in science run
Note the half-life decline of the CTI source is clearly evidenced in the steady janline of EVTSENT.
CCD3 Observations
| CTI | Science |
|
|
|---|
CCD7 Observations
| CTI | Science |
|
|
|---|
ACIS Gain Trends
We computed ACIS gain and offset from ACIS event1 files used in CTI computation, following the step described by C. Grant ACIS gain @ -120C page.
Instead computing gains and offsets from individual observations, we combined all data from each month and computed an monthly averaged gain and offset.
The following plots show CCD3 and CCD5 gains and offset trends.
| CCD 3 | |
)
|
)
|
| CCD 5 | |
)
|
)
|
[an error occurred while processing this directive]
HRC
DOSE of Central 4K Pore-Pairs
Please refer to Maximum Dose Trends for more details.
)
|
|---|
IMAGE                NPIX      MEAN    STDDEV      MIN       MAX
HRCI_09_2023.fits  16777216	0.064 	0.255 	0.000 	7.000
)
IMAGE                       NPIX      MEAN    STDDEV      MIN       MAX
HRCI_08_1999_09_2023.fits  16777216	na	na	na	na
)
|
|---|
IMAGE                NPIX      MEAN    STDDEV      MIN       MAX
HRCS_09_2023.fits  16777216	0.041 	0.213 	0.000 	7.000
)
IMAGE                       NPIX      MEAN    STDDEV      MIN       MAX
HRCS_08_1999_09_2023.fits  16777216	na	na	na	na
|
|
Max dose trend plots corrected for events that "pile-up"
in the center of the taps due to bad position information.
|
)
|
)
|
)
|
)
|
| Jun 2023 | Mar 2023 | Dec 2022 | Sep 2022 |
|---|
)
|
)
|
)
|
)
|
| Jun 2023 | Mar 2023 | Dec 2022 | Sep 2022 |
|---|
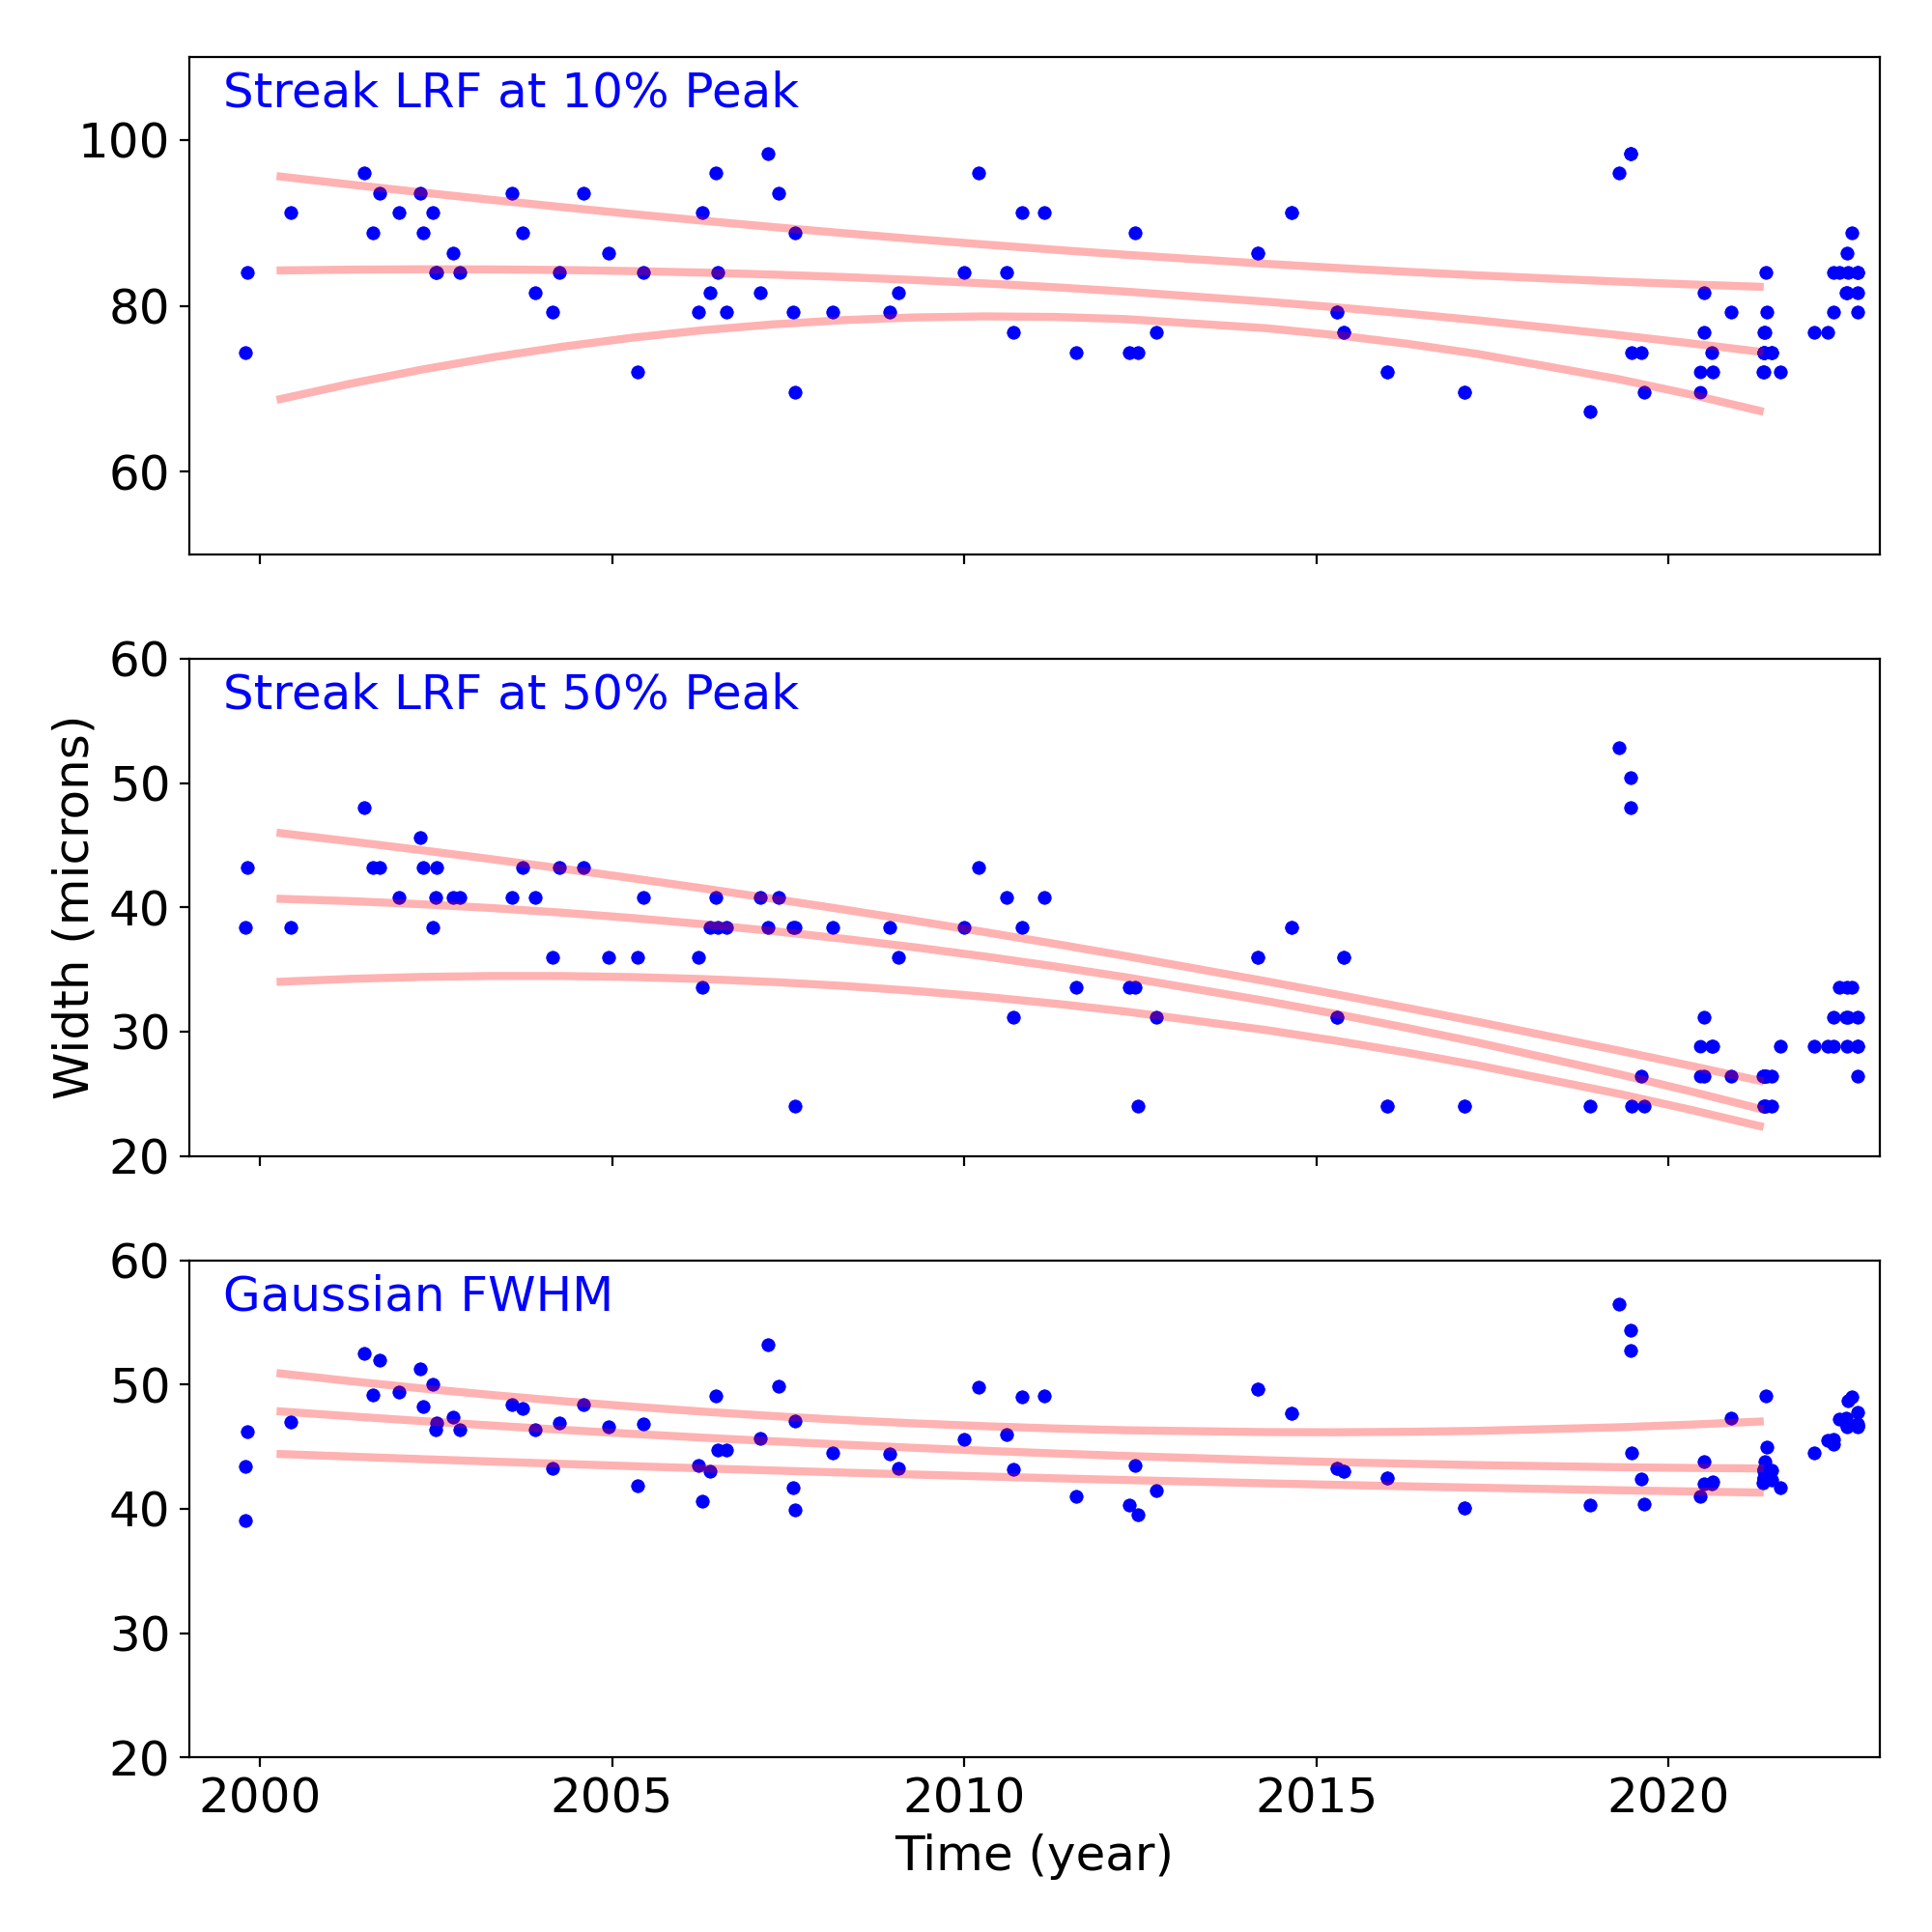
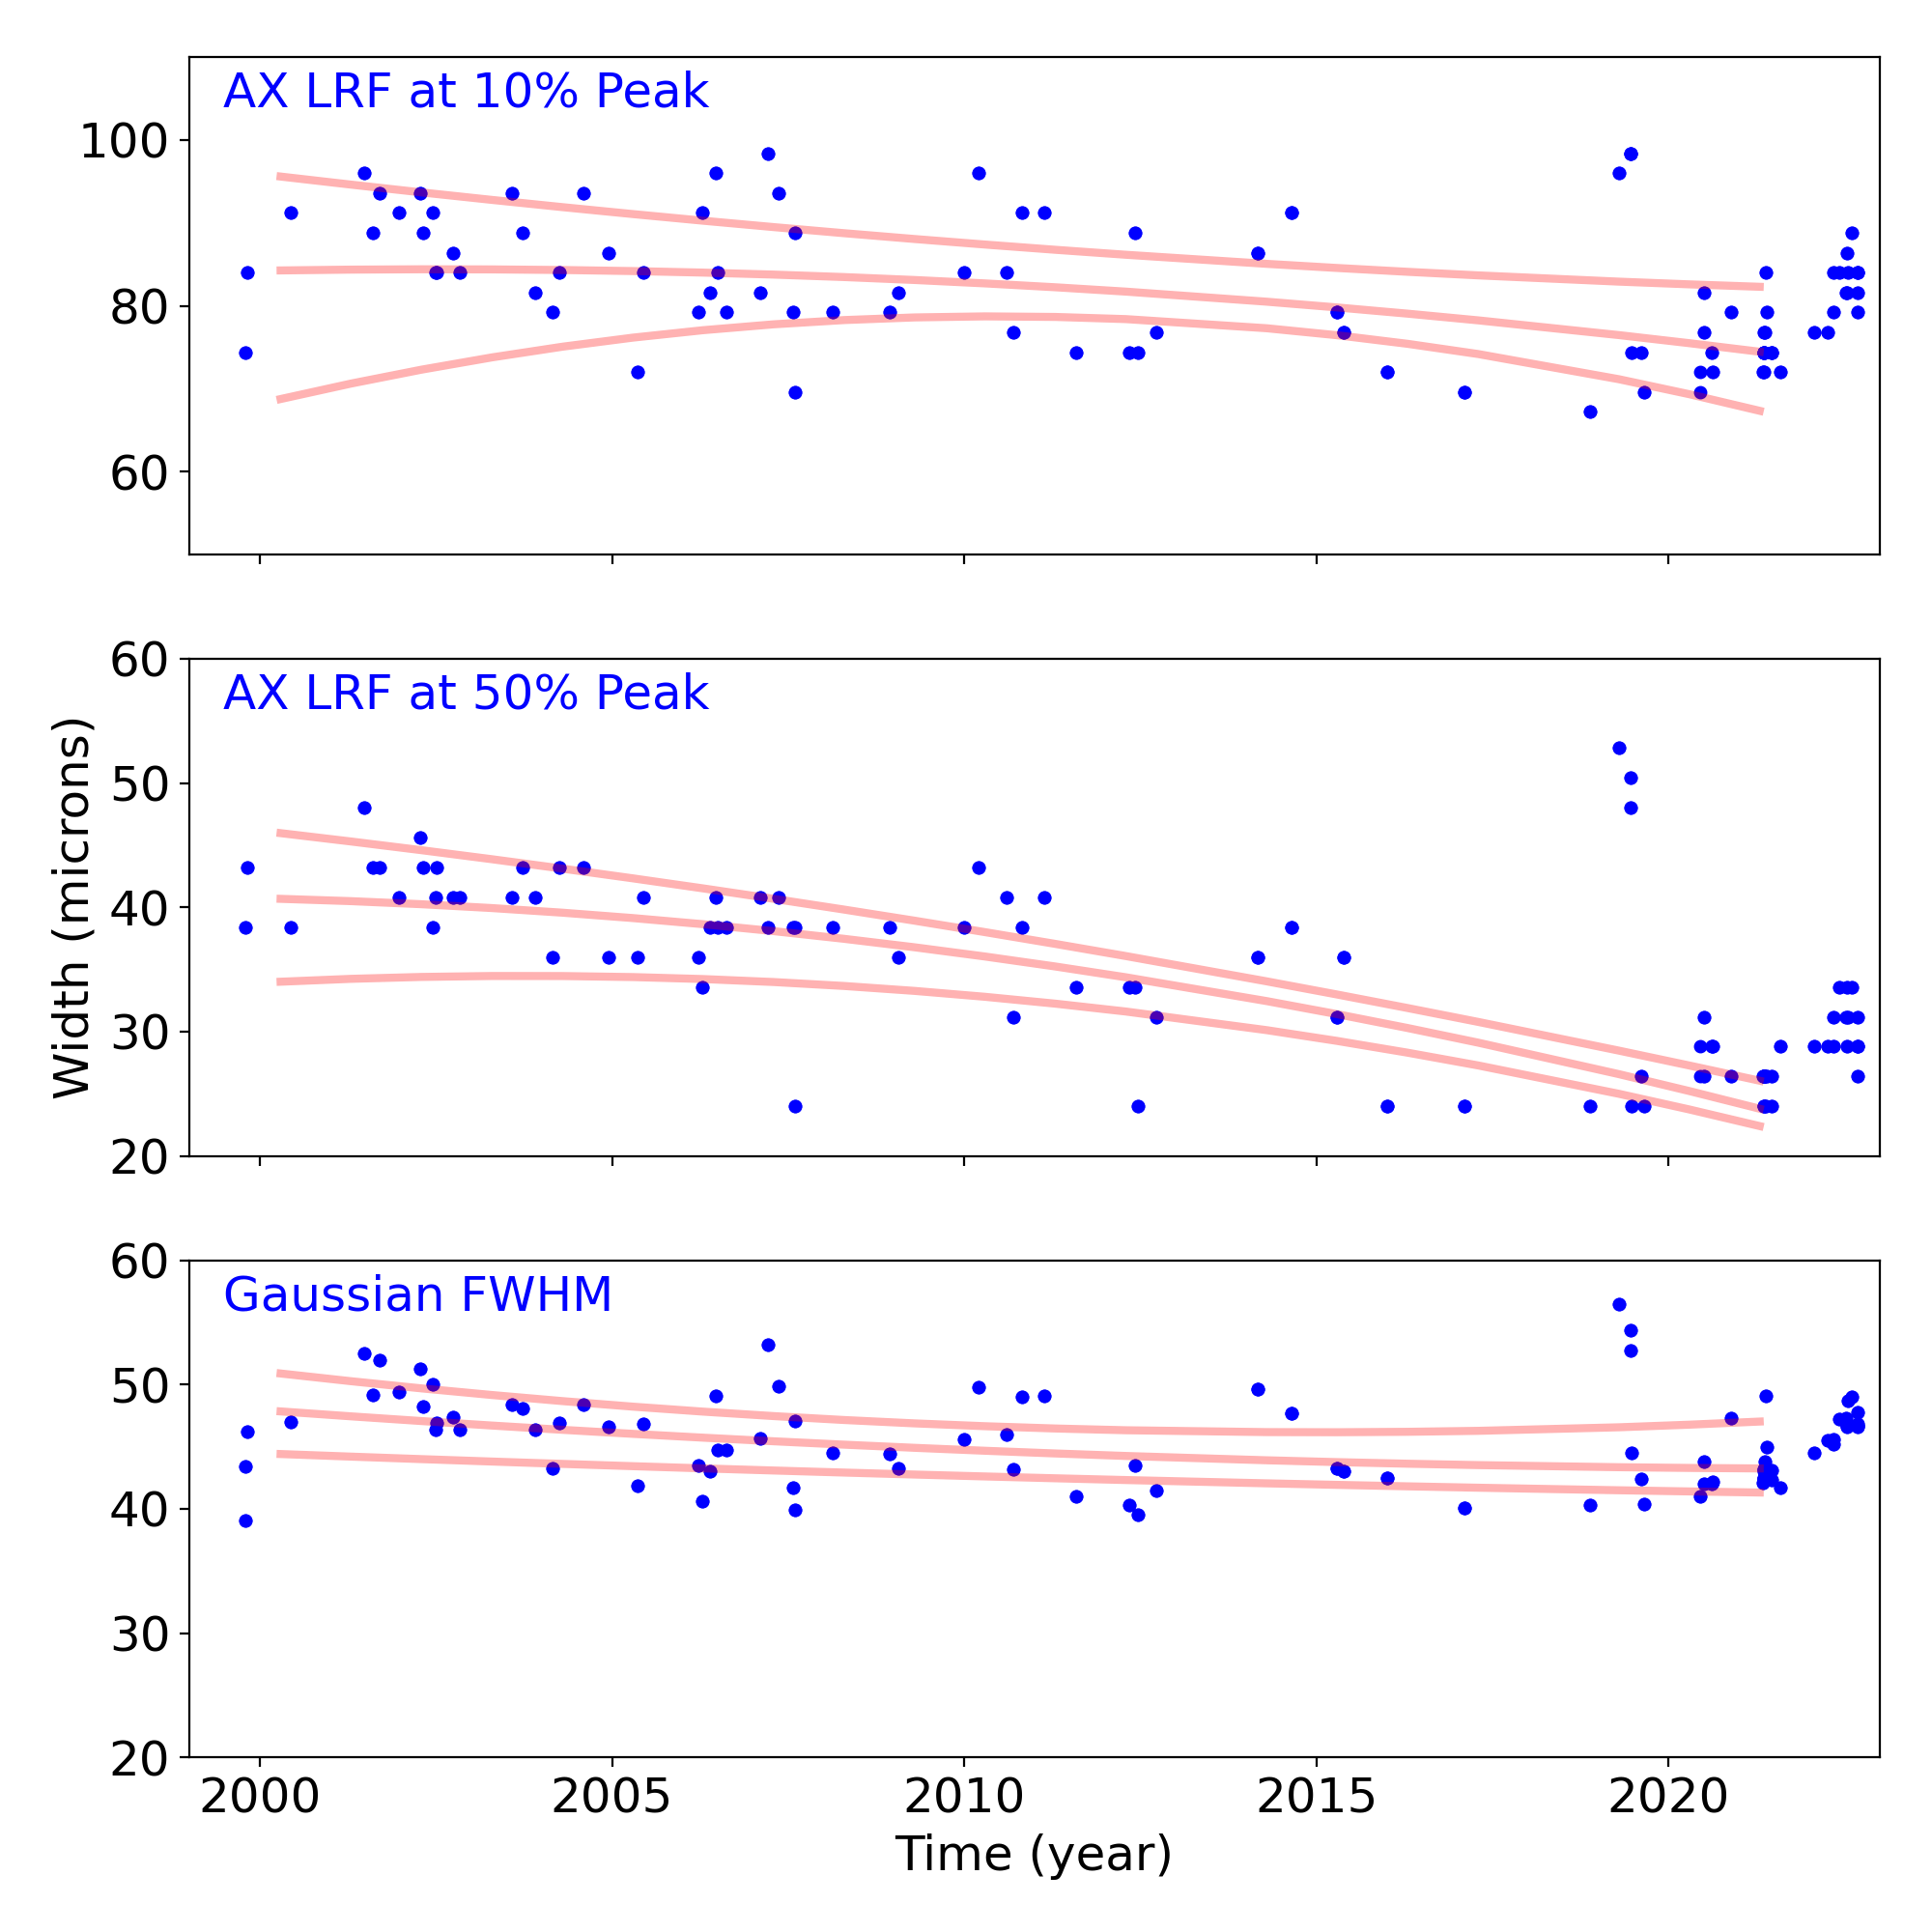
Gratings
Grating Trends/Focus
We plot the width of the zero order streak of ACIS/HETG observations and the width of the zero order image for HRC/LETG observations of point sources. No significant defocusing trend is seen at this time. See Gratings Trends pages.
PCAD
ACA Trending
| ACIS |
)
|
)
|
)
|
|
|---|---|---|---|---|
)
|
)
|
)
| ||
| HRCI |
)
|
)
|
)
|
)
|
| HRCI |
)
|
)
|
)
|
)
|
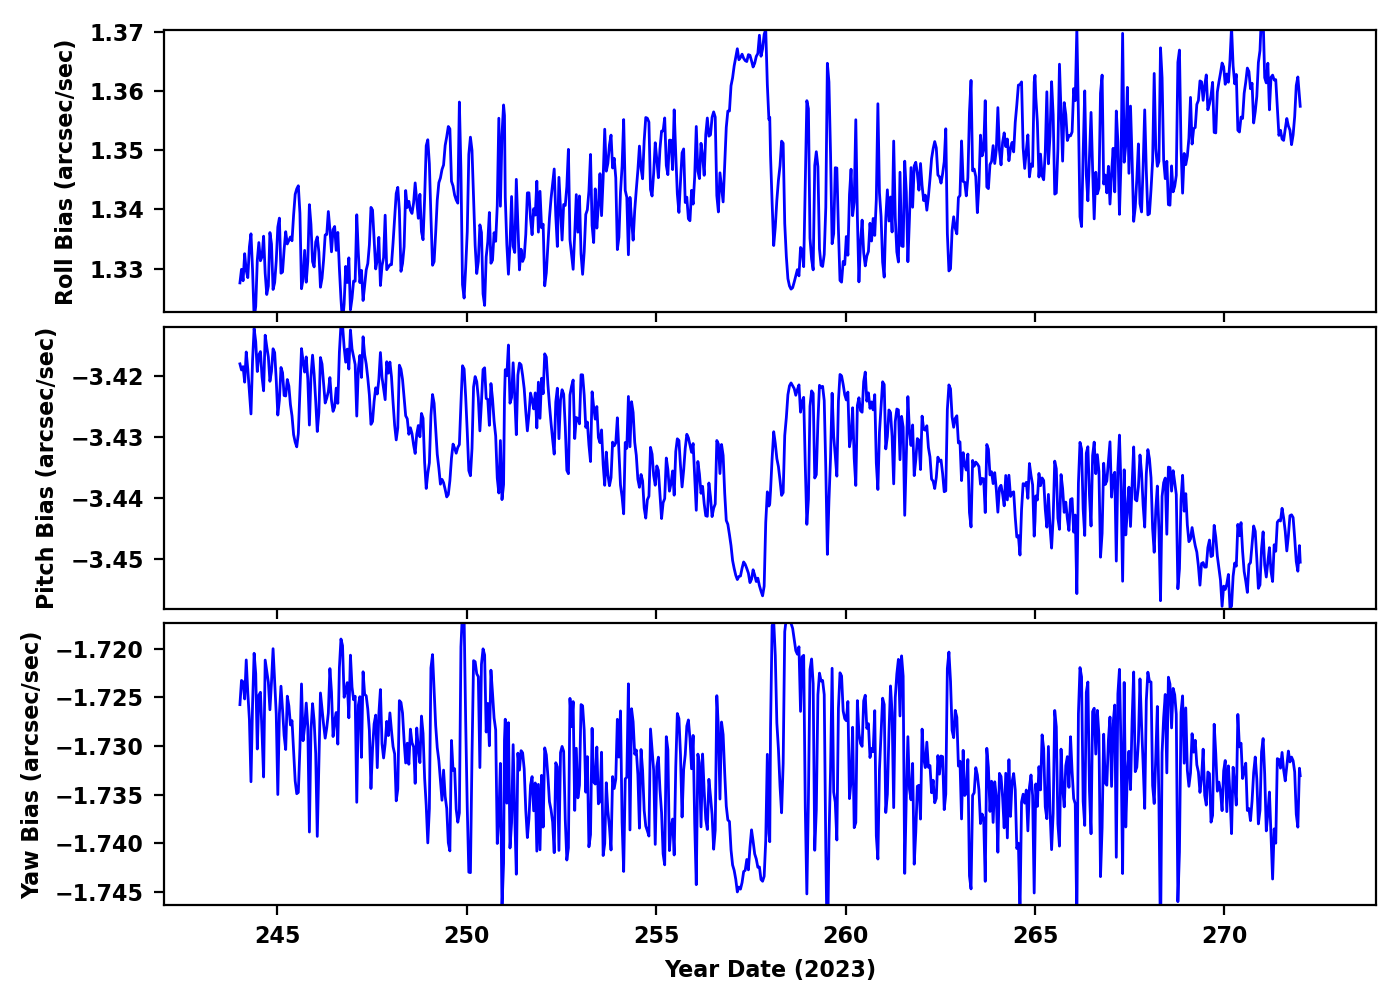
Gyro Bias Drift
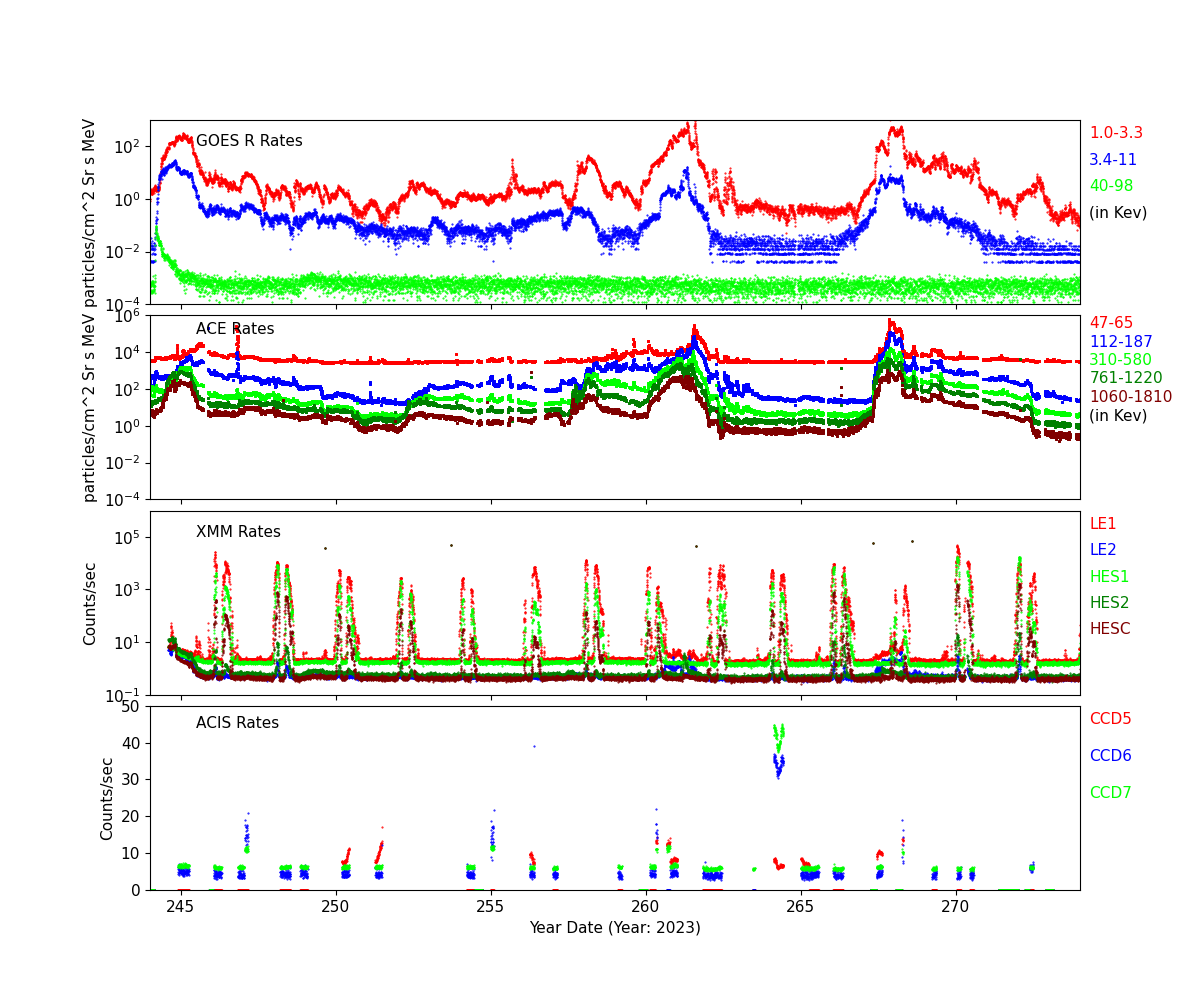
Radiation History
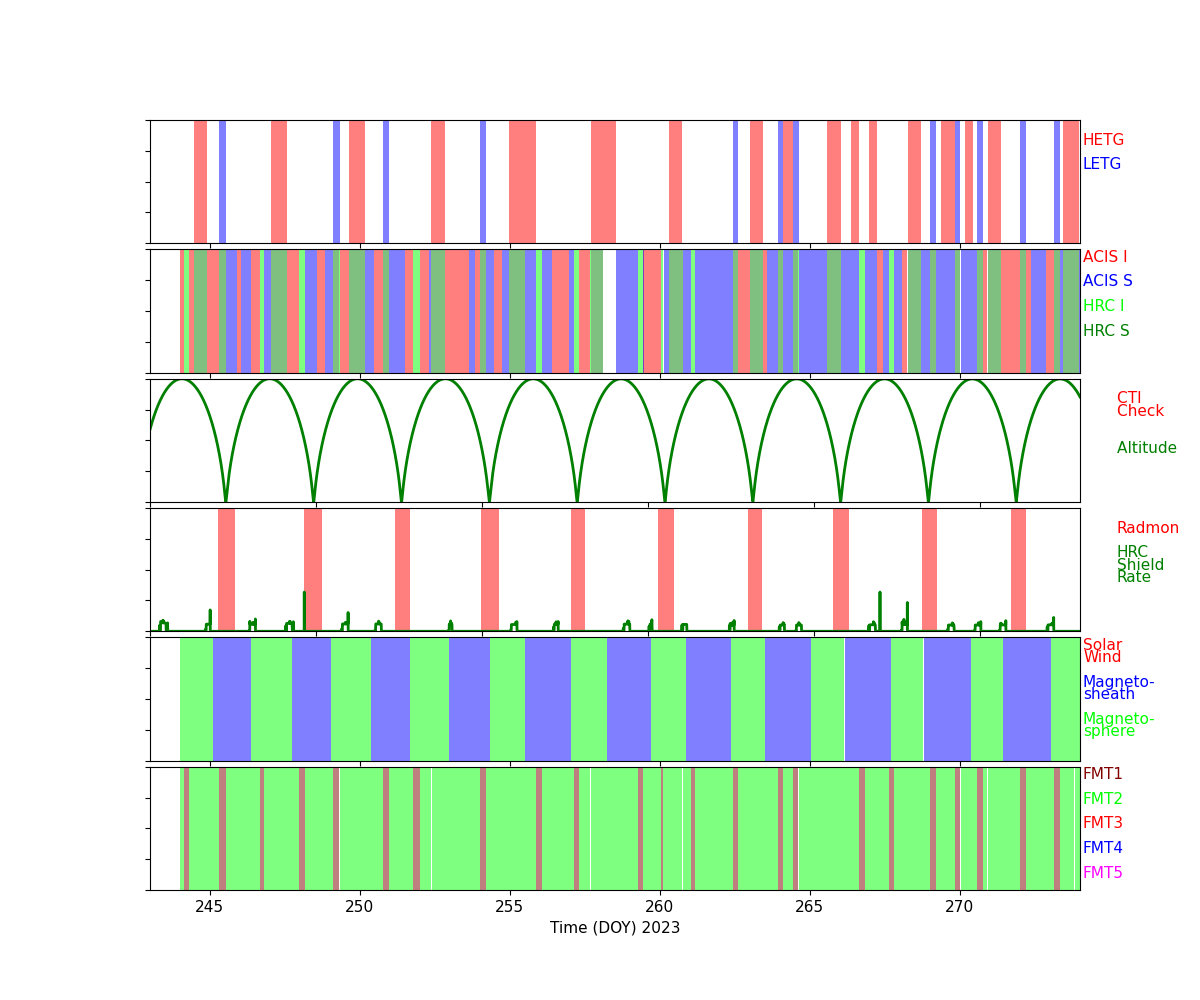
Radiation Count Rates of Sep 2023
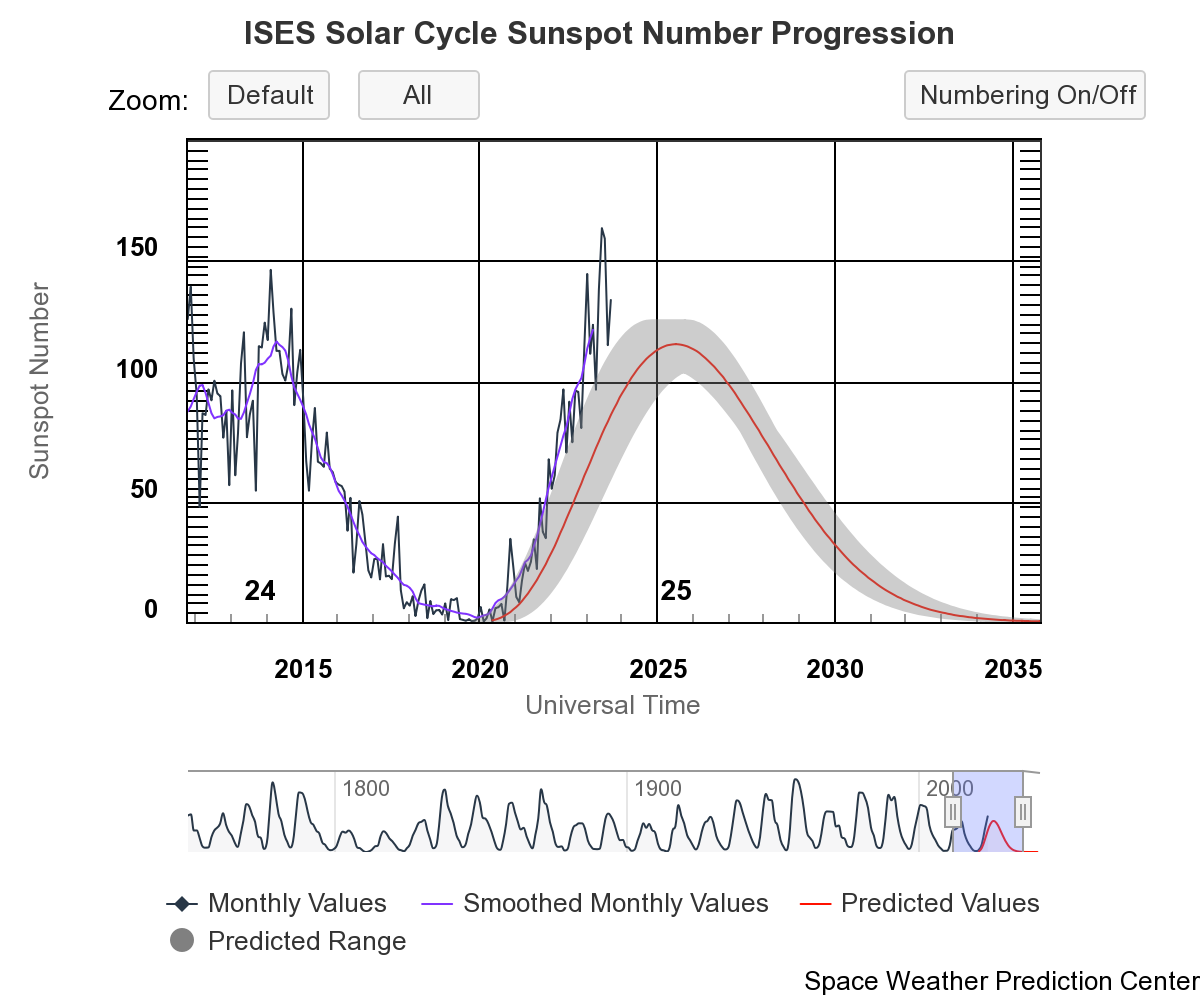
Sun Spot History (See:NOAA Page)
-->
Trending
Critical Trends
| ACIS Temperatures - Daily Maximums | |||||||
|---|---|---|---|---|---|---|---|
| MSID | MEAN | RMS | DELTA/YR | DELTA/YR/YR | UNITS | DESCRIPTION | |
| 1pdeaat | 0.001 | 0.002 | (2.99+/-0.04)e2 | 1.24 +/- 1.33 | K | PSMC DEA PS A TEMP | |
| HRMA Computed Averages - Daily Maximums | |||||||
|---|---|---|---|---|---|---|---|
| MSID | MEAN | RMS | DELTA/YR | DELTA/YR/YR | UNITS | DESCRIPTION | |
| obaavg | -0.014 | 0.001 | (2.98+/-0.02)e2 | -1.27 +/- 0.65 | TEMP | OBA/TFTE | |
| EPHIN Temperatures - Daily Maximums | |||||||
|---|---|---|---|---|---|---|---|
| MSID | MEAN | RMS | DELTA/YR | DELTA/YR/YR | UNITS | DESCRIPTION | |
| teio | 0.026 | 0.009 | (3.30+/-0.22)e2 | 2.97 +/- 3.64 | K | EPHIN ELECTRONICS HOUSING TEMP | |
| tephin | 0.008 | 0.003 | (3.39+/-0.08)e2 | 2.15 +/- 2.13 | K | EPHIN SENSOR HOUSING TEMP | |
| S/C Main Temperatures - Daily Maximums | |||||||
|---|---|---|---|---|---|---|---|
| MSID | MEAN | RMS | DELTA/YR | DELTA/YR/YR | UNITS | DESCRIPTION | |
| tcylfmzm | 0.020 | 0.004 | (3.13+/-0.10)e2 | 1.24 +/- 1.91 | K | CNT CYL TEMP:-Z SIDE UNDER LAE-1 | |
| tcylfmzp | 0.020 | 0.004 | (3.16+/-0.09)e2 | 1.12 +/- 1.75 | K | CNT CYL TEMP:-Z SIDE UNDER LAE-2 | |
| S/C Ancillary Temperatures - Daily Maximums | |||||||
|---|---|---|---|---|---|---|---|
| MSID | MEAN | RMS | DELTA/YR | DELTA/YR/YR | UNITS | DESCRIPTION | |
| tfssbkt1 | 0.015 | 0.012 | (3.50+/-0.29)e2 | 3.75 +/- 4.12 | K | FSS BRAC | |
| tfssbkt2 | 0.017 | 0.013 | (3.45+/-0.29)e2 | 3.80 +/- 4.17 | K | FSS BRAC | |
| tsctsf1 | 0.004 | 0.002 | (3.24+/-0.05)e2 | 0.53 +/- 1.31 | K | SC-TS FITTING -1 TEMP | |
| tsctsf6 | 0.003 | 0.002 | (3.24+/-0.05)e2 | 0.36 +/- 1.36 | K | SC-TS FITTING -6 TEMP | |
| MUPS - Daily Maximums | |||||||
|---|---|---|---|---|---|---|---|
| MSID | MEAN | RMS | DELTA/YR | DELTA/YR/YR | UNITS | DESCRIPTION | |
| pm1thv1t | 0.016 | 0.007 | (3.52+/-0.16)e2 | -1.18 +/- 2.51 | K | MUPS 1 THRUSTER VALVE 01 TEMP | |
| pm2thv1t | 0.063 | 0.022 | (3.18+/-0.51)e2 | 0.41 +/- 7.55 | K | MUPS 2 THRUSTER VALVE 01 TEMP | |
| pm1thv2t | 0.015 | 0.007 | (3.54+/-0.16)e2 | -0.79 +/- 2.65 | K | MUPS 1 THRUSTER VALVE 02 TEMP | |
| pm2thv2t | 0.059 | 0.023 | (3.16+/-0.55)e2 | 1.27 +/- 8.00 | K | MUPS 2 THRUSTER VALVE 02 TEMP | |
| pline02t | 0.023 | 0.005 | (3.36+/-0.12)e2 | 0.78 +/- 2.28 | K | PROP LINE TEMP 02 | |
| pline03t | 0.025 | 0.006 | (3.29+/-0.14)e2 | 0.57 +/- 2.15 | K | PROP LINE TEMP 03 | |
| pline04t | 0.023 | 0.005 | (3.17+/-0.11)e2 | 2.82 +/- 2.29 | K | PROP LINE TEMP 04 | |
Quarterly Trends
- PCAD FTS Temperature and Gradient
| Previous Quarter | |||||||
| MSID | MEAN | RMS | DELTA/YR | DELTA/YR/YR | UNITS | DESCRIPTION | |
| ohrthr27 | 4.531e-04 | 6.225e-05 | (2.97+/-0.00)e2 | -0.00 +/- 0.02 | K | RT 20 : PERISCOPE | |
|---|---|---|---|---|---|---|---|
| ohrthr42 | 0.003 | 3.019e-04 | (2.97+/-0.01)e2 | 0.51 +/- 0.12 | K | RT 133: PERISCOPE | |
| ohrthr43 | 0.003 | 3.296e-04 | (2.97+/-0.01)e2 | 0.43 +/- 0.16 | K | RT 134: PERISCOPE | |
| oobagrd3 | -2.965e-04 | 5.231e-05 | -0.33 +/- 0.12 | 0.02 +/- 0.04 | K | RT 505 TO RT 504: PERISCOPE GRADIENT MONITOR | |
| oobagrd6 | 4.743e-05 | 5.770e-06 | 0.13 +/- 0.01 | 0.01 +/- 0.00 | K | RT 507 TO RT 506: PERISCOPE GRADIENT MONITOR | |
- SIM Temperature
| Previous Quarter | |||||||
| MSID | MEAN | RMS | DELTA/YR | DELTA/YR/YR | UNITS | DESCRIPTION | |
| 3btu_bpt | -0.010 | 0.002 | (2.66+/-0.04)e2 | 0.02 +/- 1.27 | K | BTU BASEPLATE (+X)), ABORT HTR TSC2 | |
|---|---|---|---|---|---|---|---|
| 3tsmxcet | -0.046 | 0.018 | (2.41+/-0.41)e2 | 0.66 +/- 5.09 | K | -X TURTLE SHELL NR HRC CEA | |
| 3tsmxspt | -0.332 | 0.081 | (4.39+/-1.91)e2 | 20.84 +/- 25.54 | K | -X TURTLE SHELL NR ACIS SS | |
- SIIM Electronics
| Previous Quarter | |||||||
| MSID | MEAN | RMS | DELTA/YR | DELTA/YR/YR | UNITS | DESCRIPTION | |
| agrndadc | -3.242e-06 | 5.164e-07 | -(3.83+/-0.93)e-4 | (3.81+/-1.50)e-4 | V | Analog fround A/D convert reading | |
|---|---|---|---|---|---|---|---|
| fatabadc | -2.463e-05 | 2.878e-05 | 4.99 +/- 0.08 | 0.01 +/- 0.00 | V | FA Tab Position Sensor A/D Converter | |
| n15vadc | 4.888e-07 | 1.280e-07 | -15.02 +/- 0.00 | -(2.92+/-7.56)e-5 | V | -15V Power Supply A/D Converter Reading | |
| p15vadc | -3.171e-07 | 1.174e-07 | 14.96 +/- 0.00 | -(4.74+/-10.21)e-5 | V | +15V Power Supply A/D Converter Reading | |
| p5vadc | 3.783e-06 | 7.379e-07 | 4.94 +/- 0.00 | (7.42+/-5.60)e-4 | V | +5V Power Supply A/D Converter Reading | |
| tsctabadc | -1.713e-04 | 0.001 | 4.97 +/- 0.17 | 0.14 +/- 0.17 | V | TSC Tab Position Sensor A/D converter | |
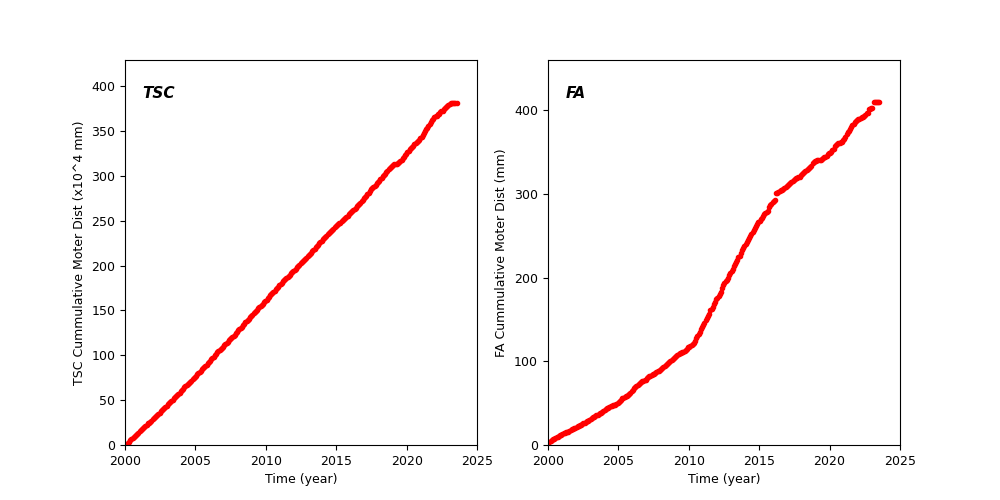
Spacecraft Motions
TSC and FA Cummulative Moter Distance
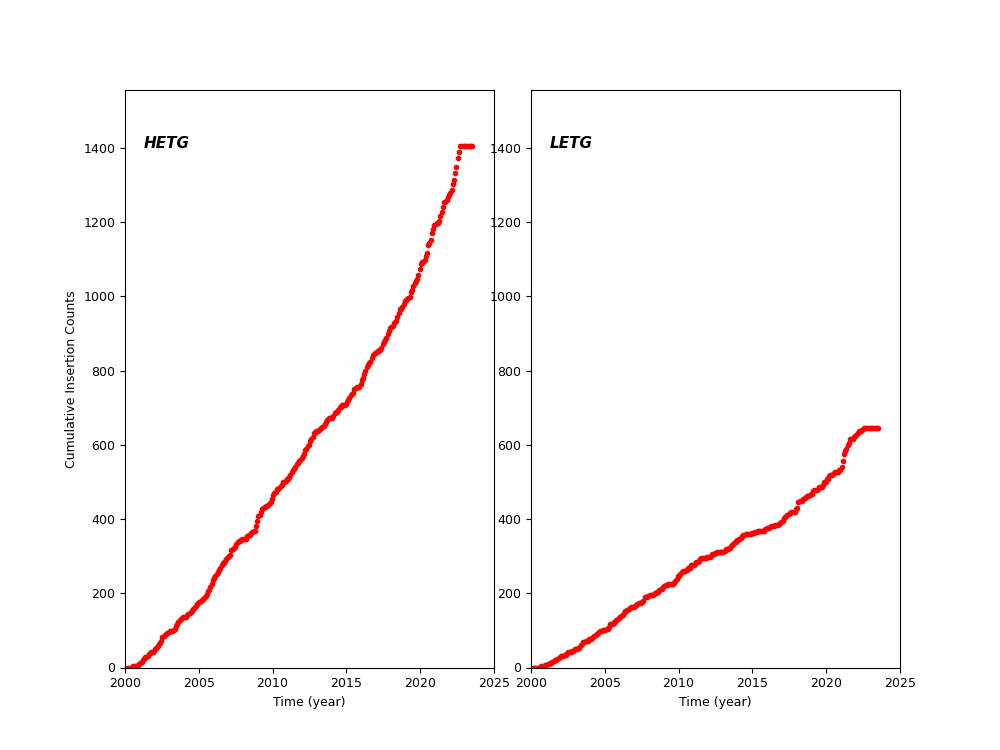
HETG and LETG Cummulative Insertion Counts
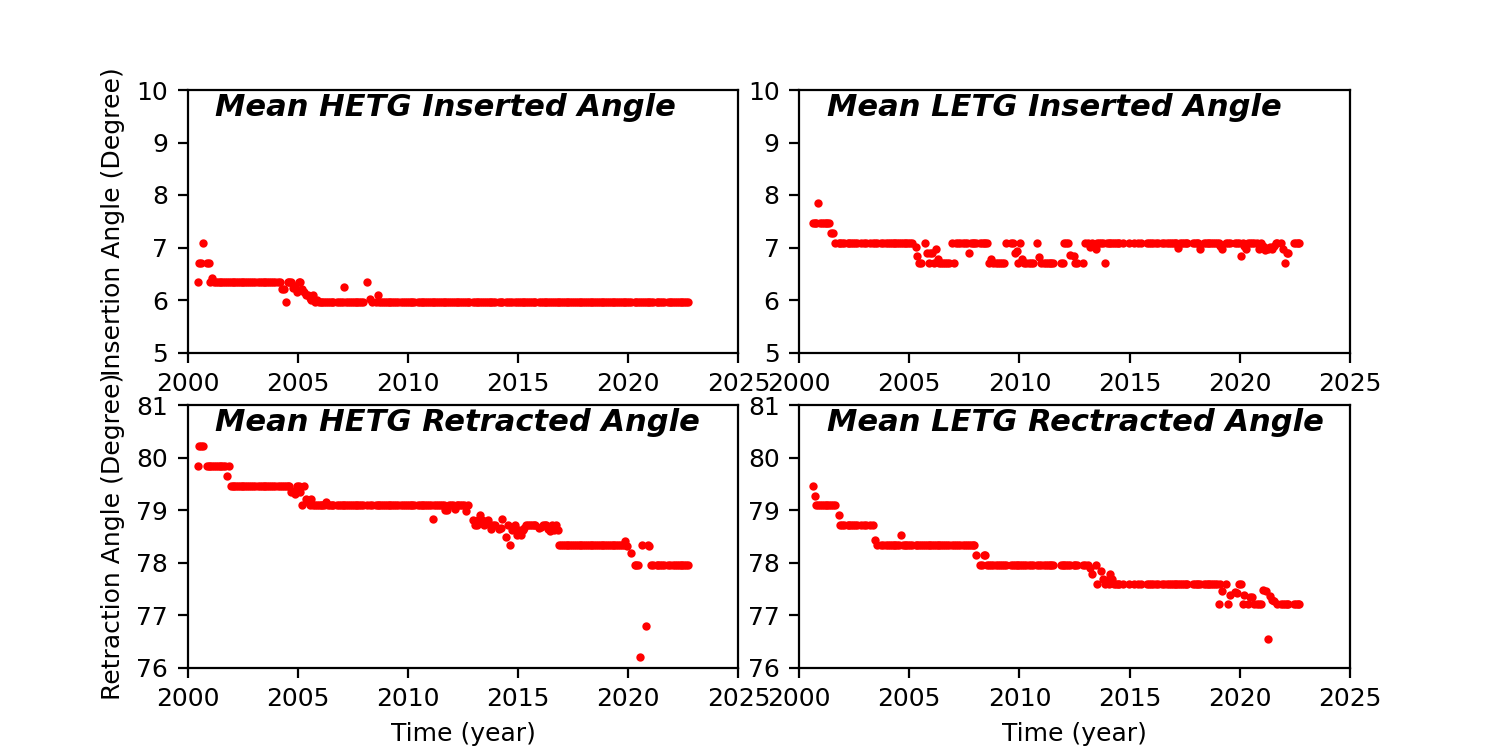
HETG/LETG Insertion/Retraction Angle
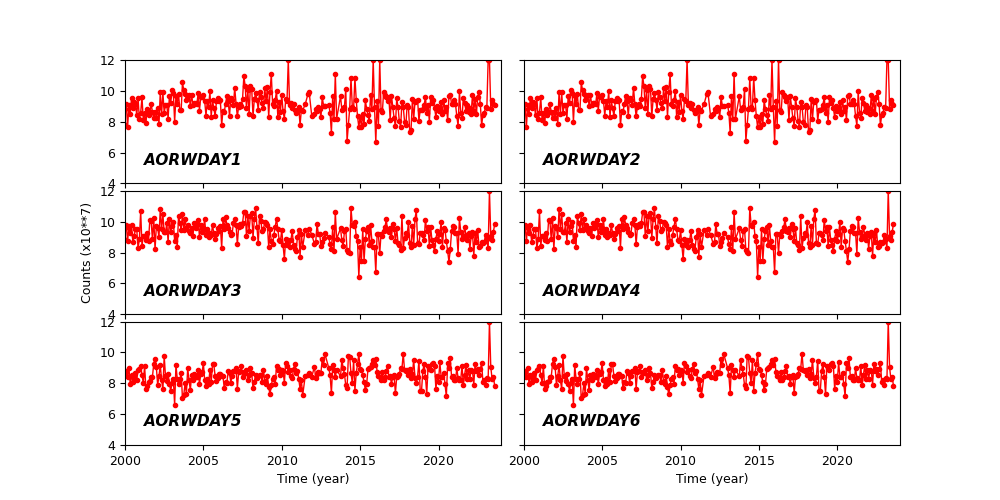
Reaction Wheel Rotations