ACIS
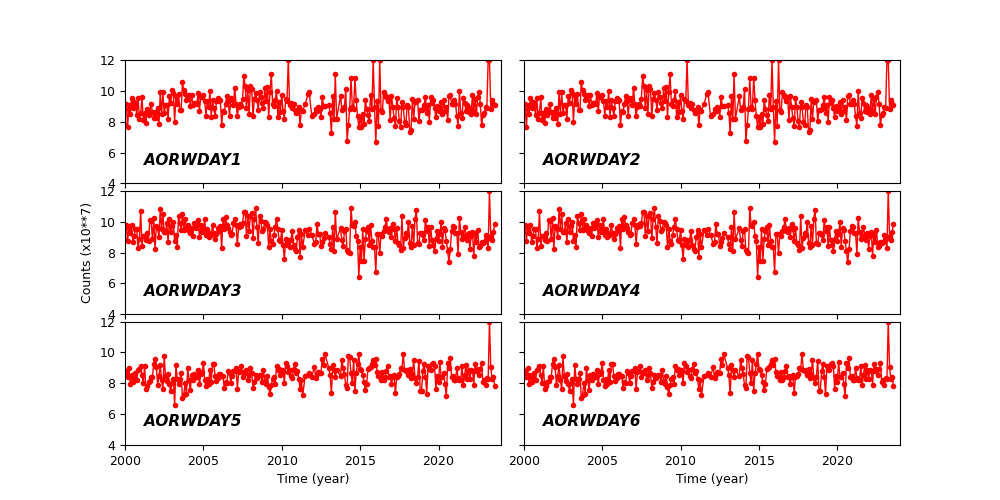
ACIS DOSE Registered-Photon-Map
The steps we took to compute the dose map are;
- Level 1 Event files for a specified month are obtained from archive.
- Image data including I2, I3, S2, S3 CCDs are extracted from all event files.
- All the extracted image data were merged to create a month long exposure map for the month.
- The exposure map is opened with ds9, and check a distribution of count rates against energy. From this, estimate the upper threshold value. Any events beyond this upper threshold are assumed erroneous events such as bad pixels.
- Using this upper threshold, the data is filtered, and create a cleaned exposure map for the month.
- The exposure map from each month from the Sep 1999 is added up to create a cumulative exposure map for each month.
- Using fimgstatistic, we compute count rate statistics for each CCDs.
- For observations with high data drop rates (e.g., Crab nebula, Cas A), we corrected the observations by adding events.
Please check more detail plots at Telemetered Photon Dose Trend page.
)
)
)
Statistics:
# IMAGE     NPIX     MEAN        RMS        MIN     MAX
ACIS_dec23 6004901       3.758         5.026           0.0     2531


I2 node 0  262654	2.797315	1.875569	0.0	 43.0
I2 node 1  262654	2.919777	2.209946	0.0	524.0
I2 node 2  262654	2.934033	1.953982	0.0	 65.0
I2 node 3  262654	2.921120	1.996373	0.0	202.0

I3 node 0  262654	3.719830	2.873591	0.0	 83.0
I3 node 1  262654	3.356986	7.391102	0.0	2214.0
I3 node 2  262654	3.178936	1.995119	0.0	 61.0
I3 node 3  262654	3.227786	3.699294	0.0	1584.0

S2 node 0  262654	5.036068	5.815524	0.0	2531.0
S2 node 1  262654	5.237636	2.875946	0.0	285.0
S2 node 2  262654	5.775900	3.673958	0.0	974.0
S2 node 3  262654	6.696969	4.087477	0.0	629.0

S3 node 0  262654	8.933644	5.970094	0.0	110.0
S3 node 1  262654	8.961239	4.104274	0.0	 65.0
S3 node 2  262654	7.709095	2.939874	0.0	 38.0
S3 node 3  262654	6.831186	2.750823	0.0	 42.0
)
)
)
Statistics:
 IMAGE     NPIX      MEAN        RMS           MIN      MAX
ACIS_total   6004901       2670.286         3394.423           0.0   154687


I2 node 0  262654	2317.746900	469.335616	494.0	14728.0
I2 node 1  262654	2441.841227	679.233161	505.0	152681.0
I2 node 2  262654	2470.176645	523.556654	532.0	15874.0
I2 node 3  262654	2474.705048	640.363146	493.0	32435.0

I3 node 0  262654	2664.327373	656.653085	496.0	14509.0
I3 node 1  262654	2746.116740	1749.359310	518.0	55971.0
I3 node 2  262654	2456.413032	459.709808	490.0	14864.0
I3 node 3  262654	2436.331844	494.562299	460.0	35615.0

S2 node 0  262654	3113.838791	502.690407	1685.0	22531.0
S2 node 1  262654	3305.616040	751.953695	1866.0	18066.0
S2 node 2  262654	3664.954871	756.004398	2280.0	32271.0
S2 node 3  262654	3623.200762	610.899903	2005.0	80023.0

S3 node 0  262654	5520.080354	2990.824704	2420.0	54838.0
S3 node 1  262654	6737.577124	2385.036773	0.0	69061.0
S3 node 2  262654	5471.254626	1361.872243	2541.0	27477.0
S3 node 3  262654	4291.775194	768.985348	2589.0	26623.0
)
|
)
|
)
|
)
|
| Sep 2023 | Jun 2023 | Mar 2023 | Dec 2022 |
|---|
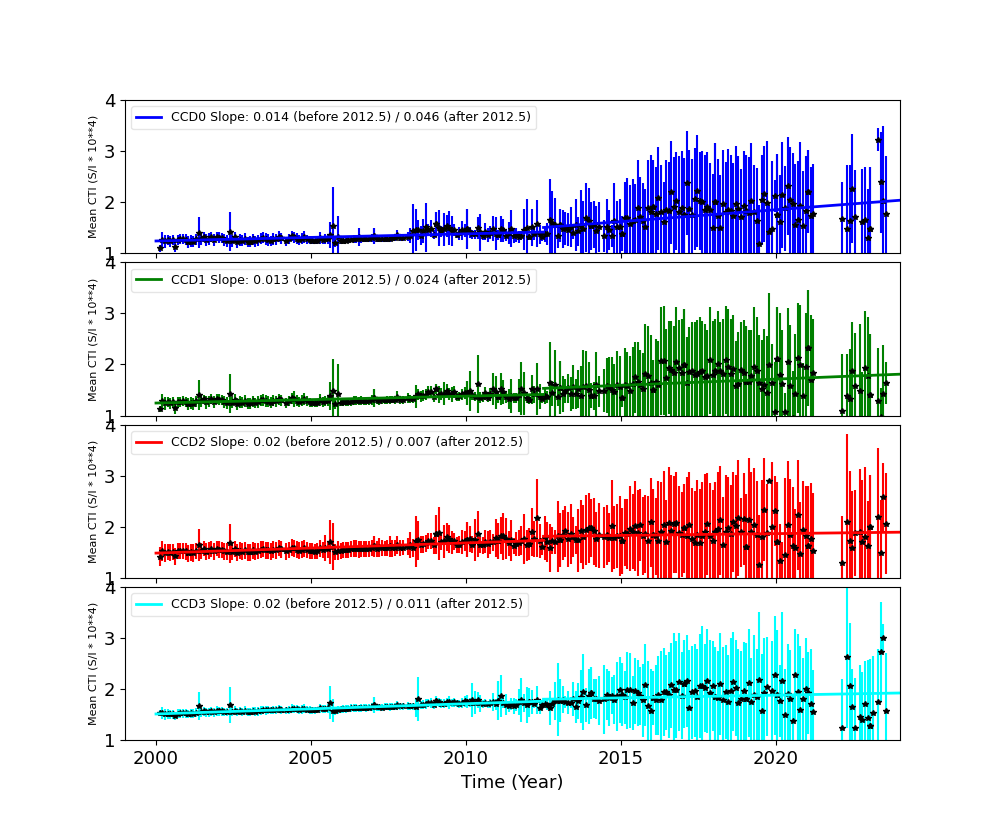
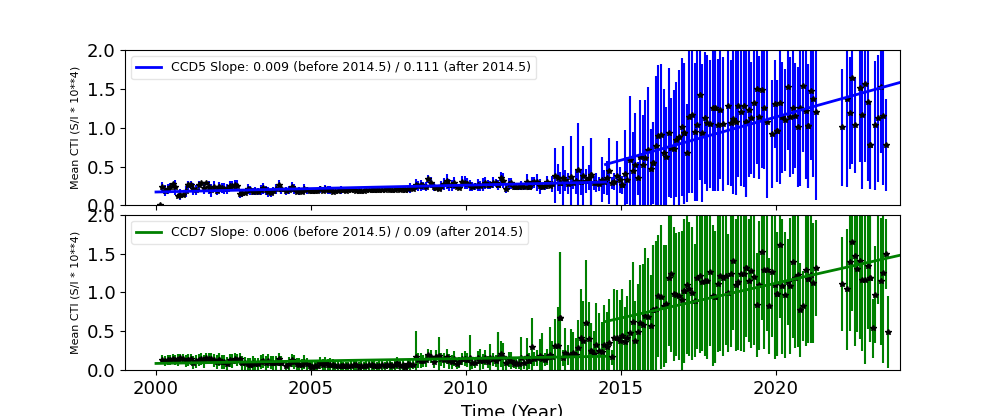
The Mean Detrended CTI
We report CTIs with a refined data definition. CTIs were computed for the temperature dependency corrected data. Please see CTI page for detailed explanation. CTI's are computed for Mn K alpha, and defined as slope/intercept x10^4 of row # vs ADU. Data file: here
Imaging CCDs
Spectral CCDs
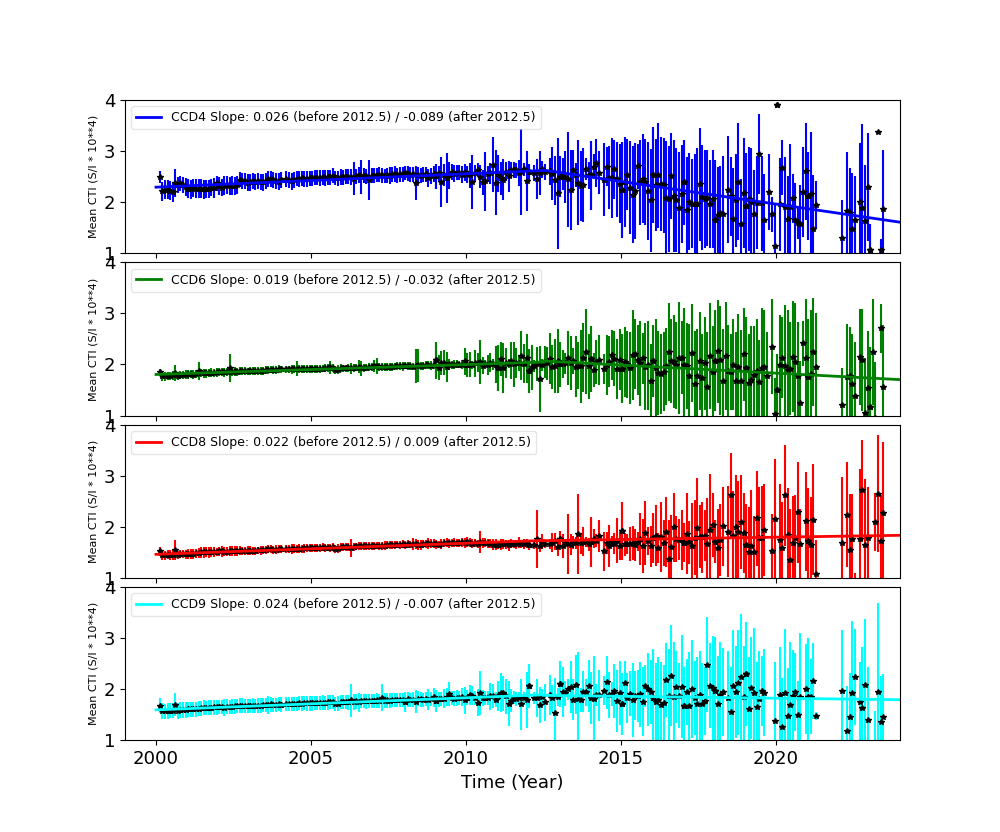
Backside CCDs
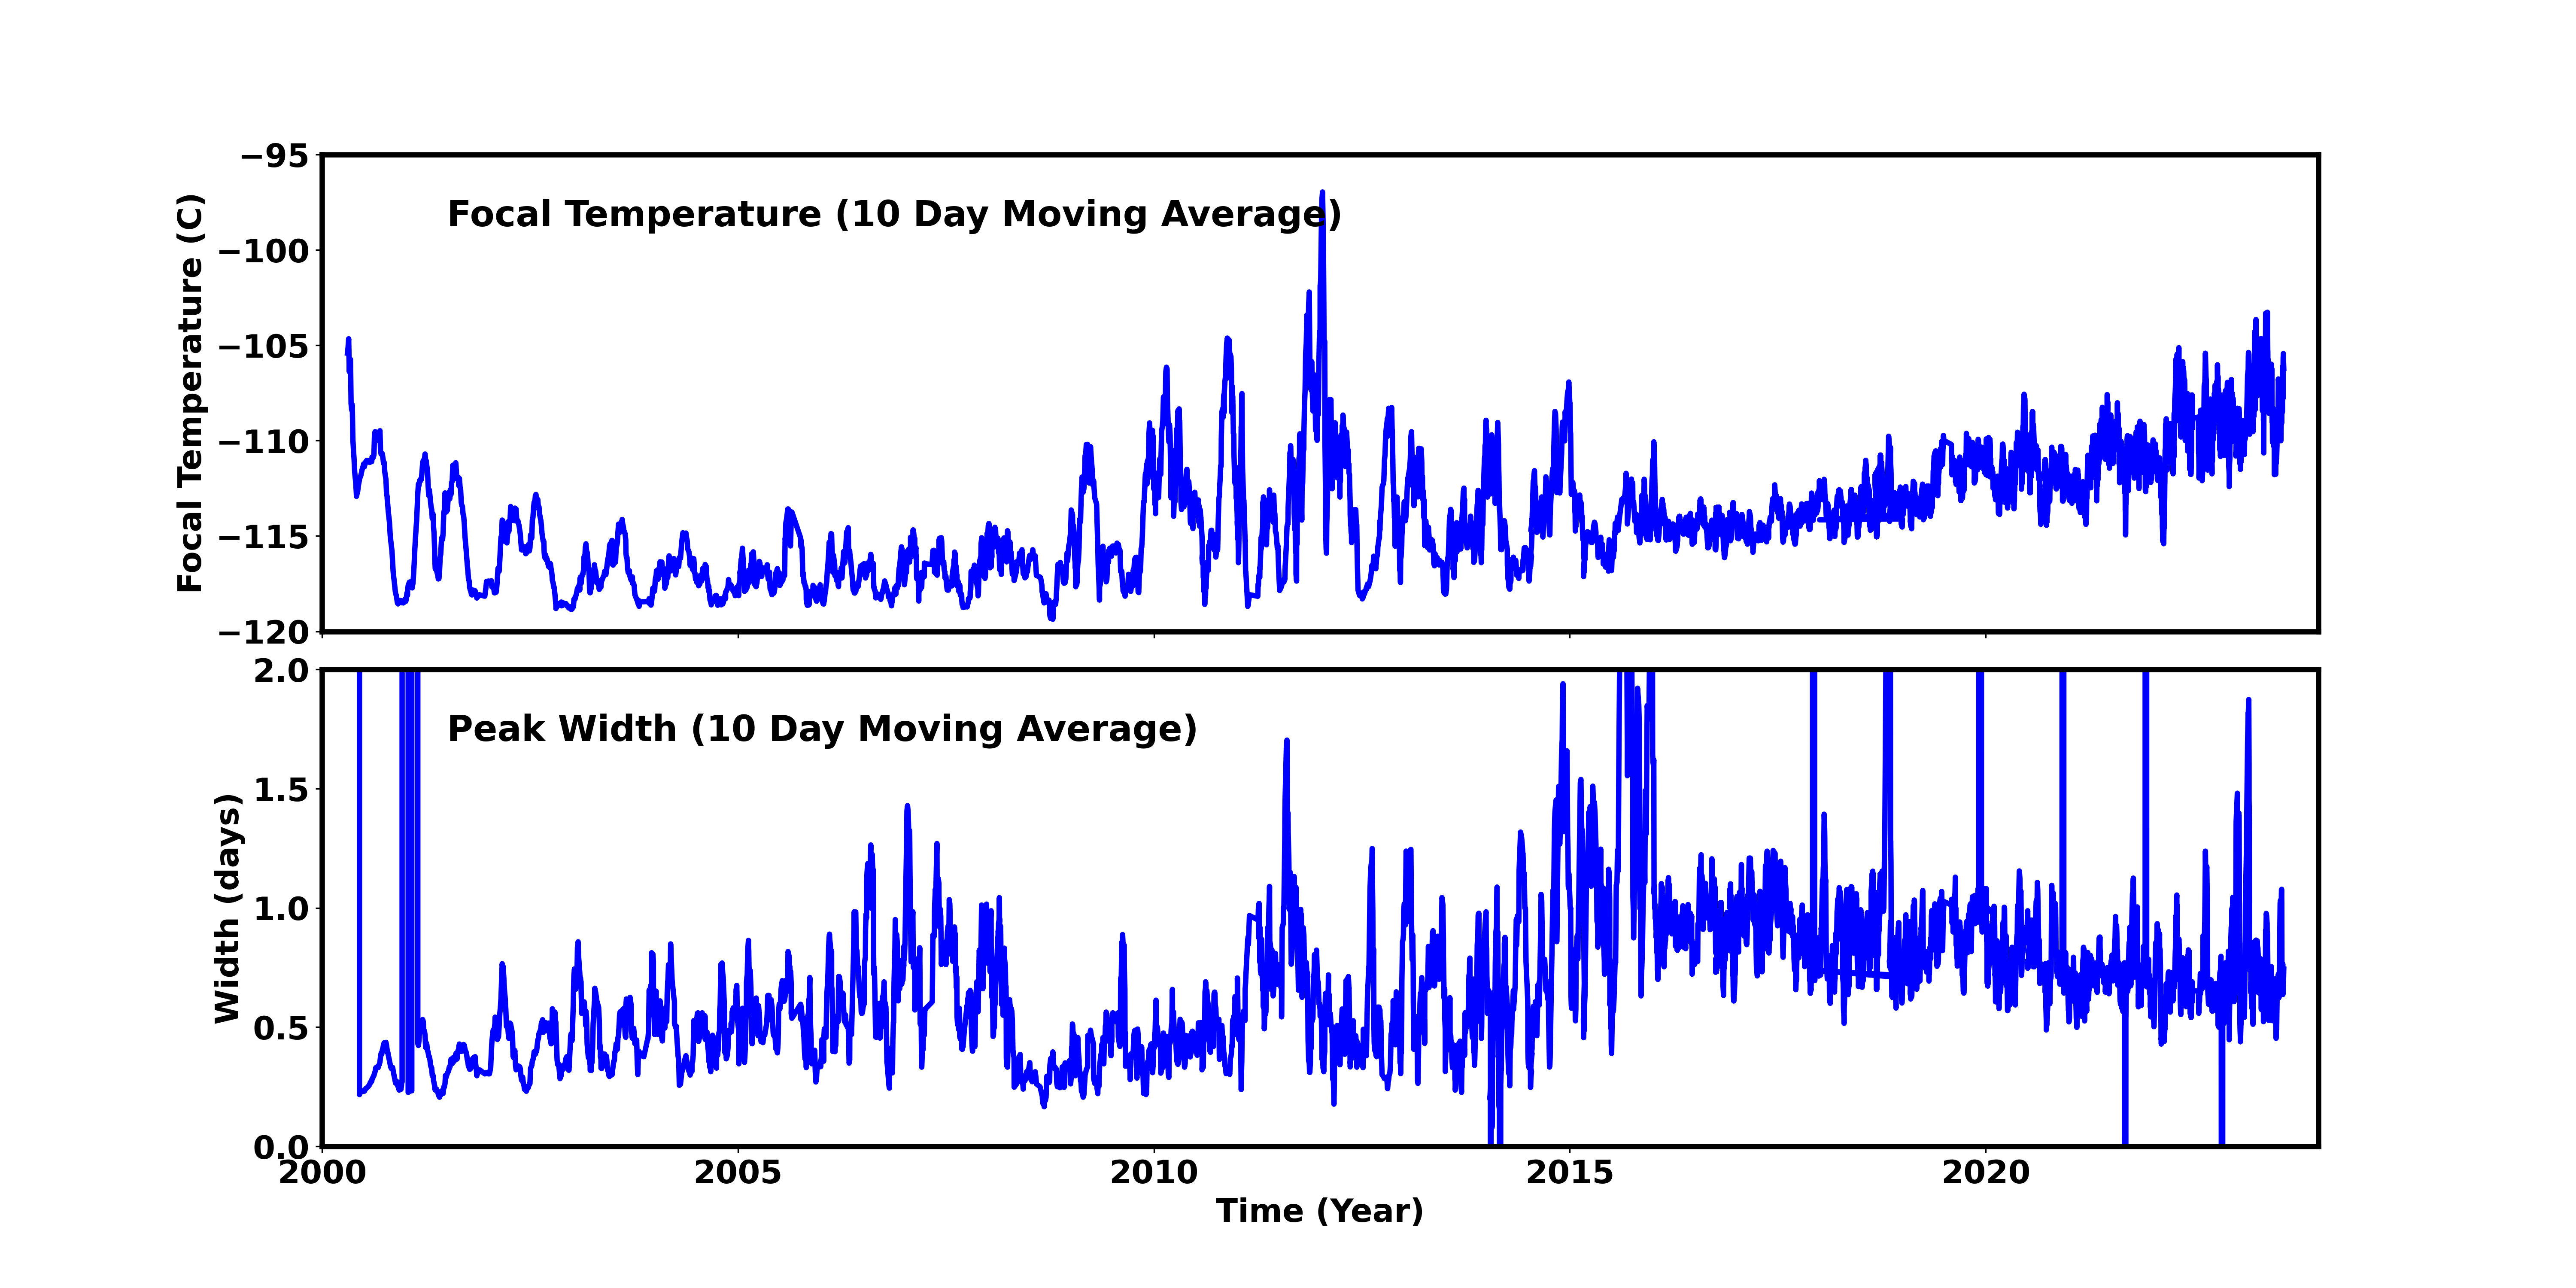
Focal Plane Temperature
Dec 2023 Focal Temperature
| The Mean (max) FPT: | |
|---|---|
| -107.53 | +/- 7.69 C |
| Mean Width: | |
| 0.8 | +/- 0.58 days |
Averaged Focal Plane Temperature
We are using 10 period moving averages to show trends of peak temperatures and peak widths. Note, the gaps in the width plot are due to missing/corrupted data.
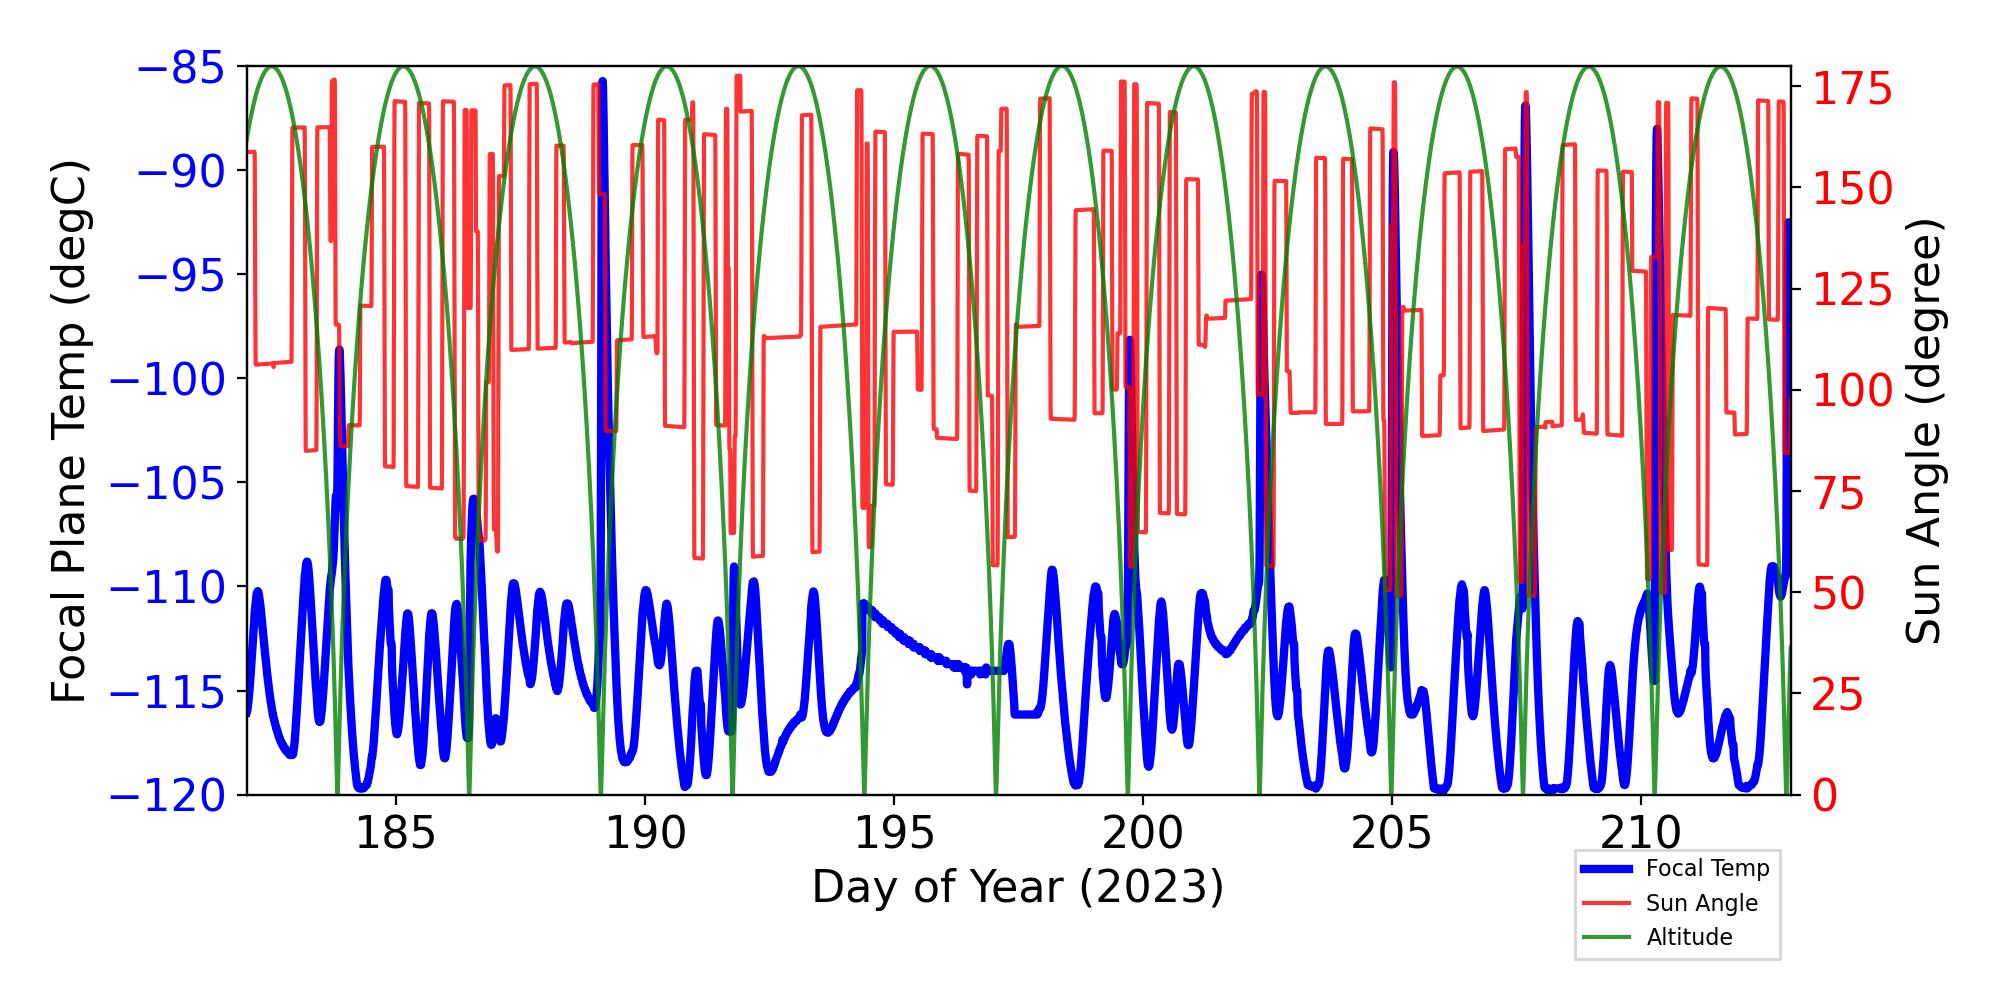
Focal Plane Temperature, Sun Angle and Altitude
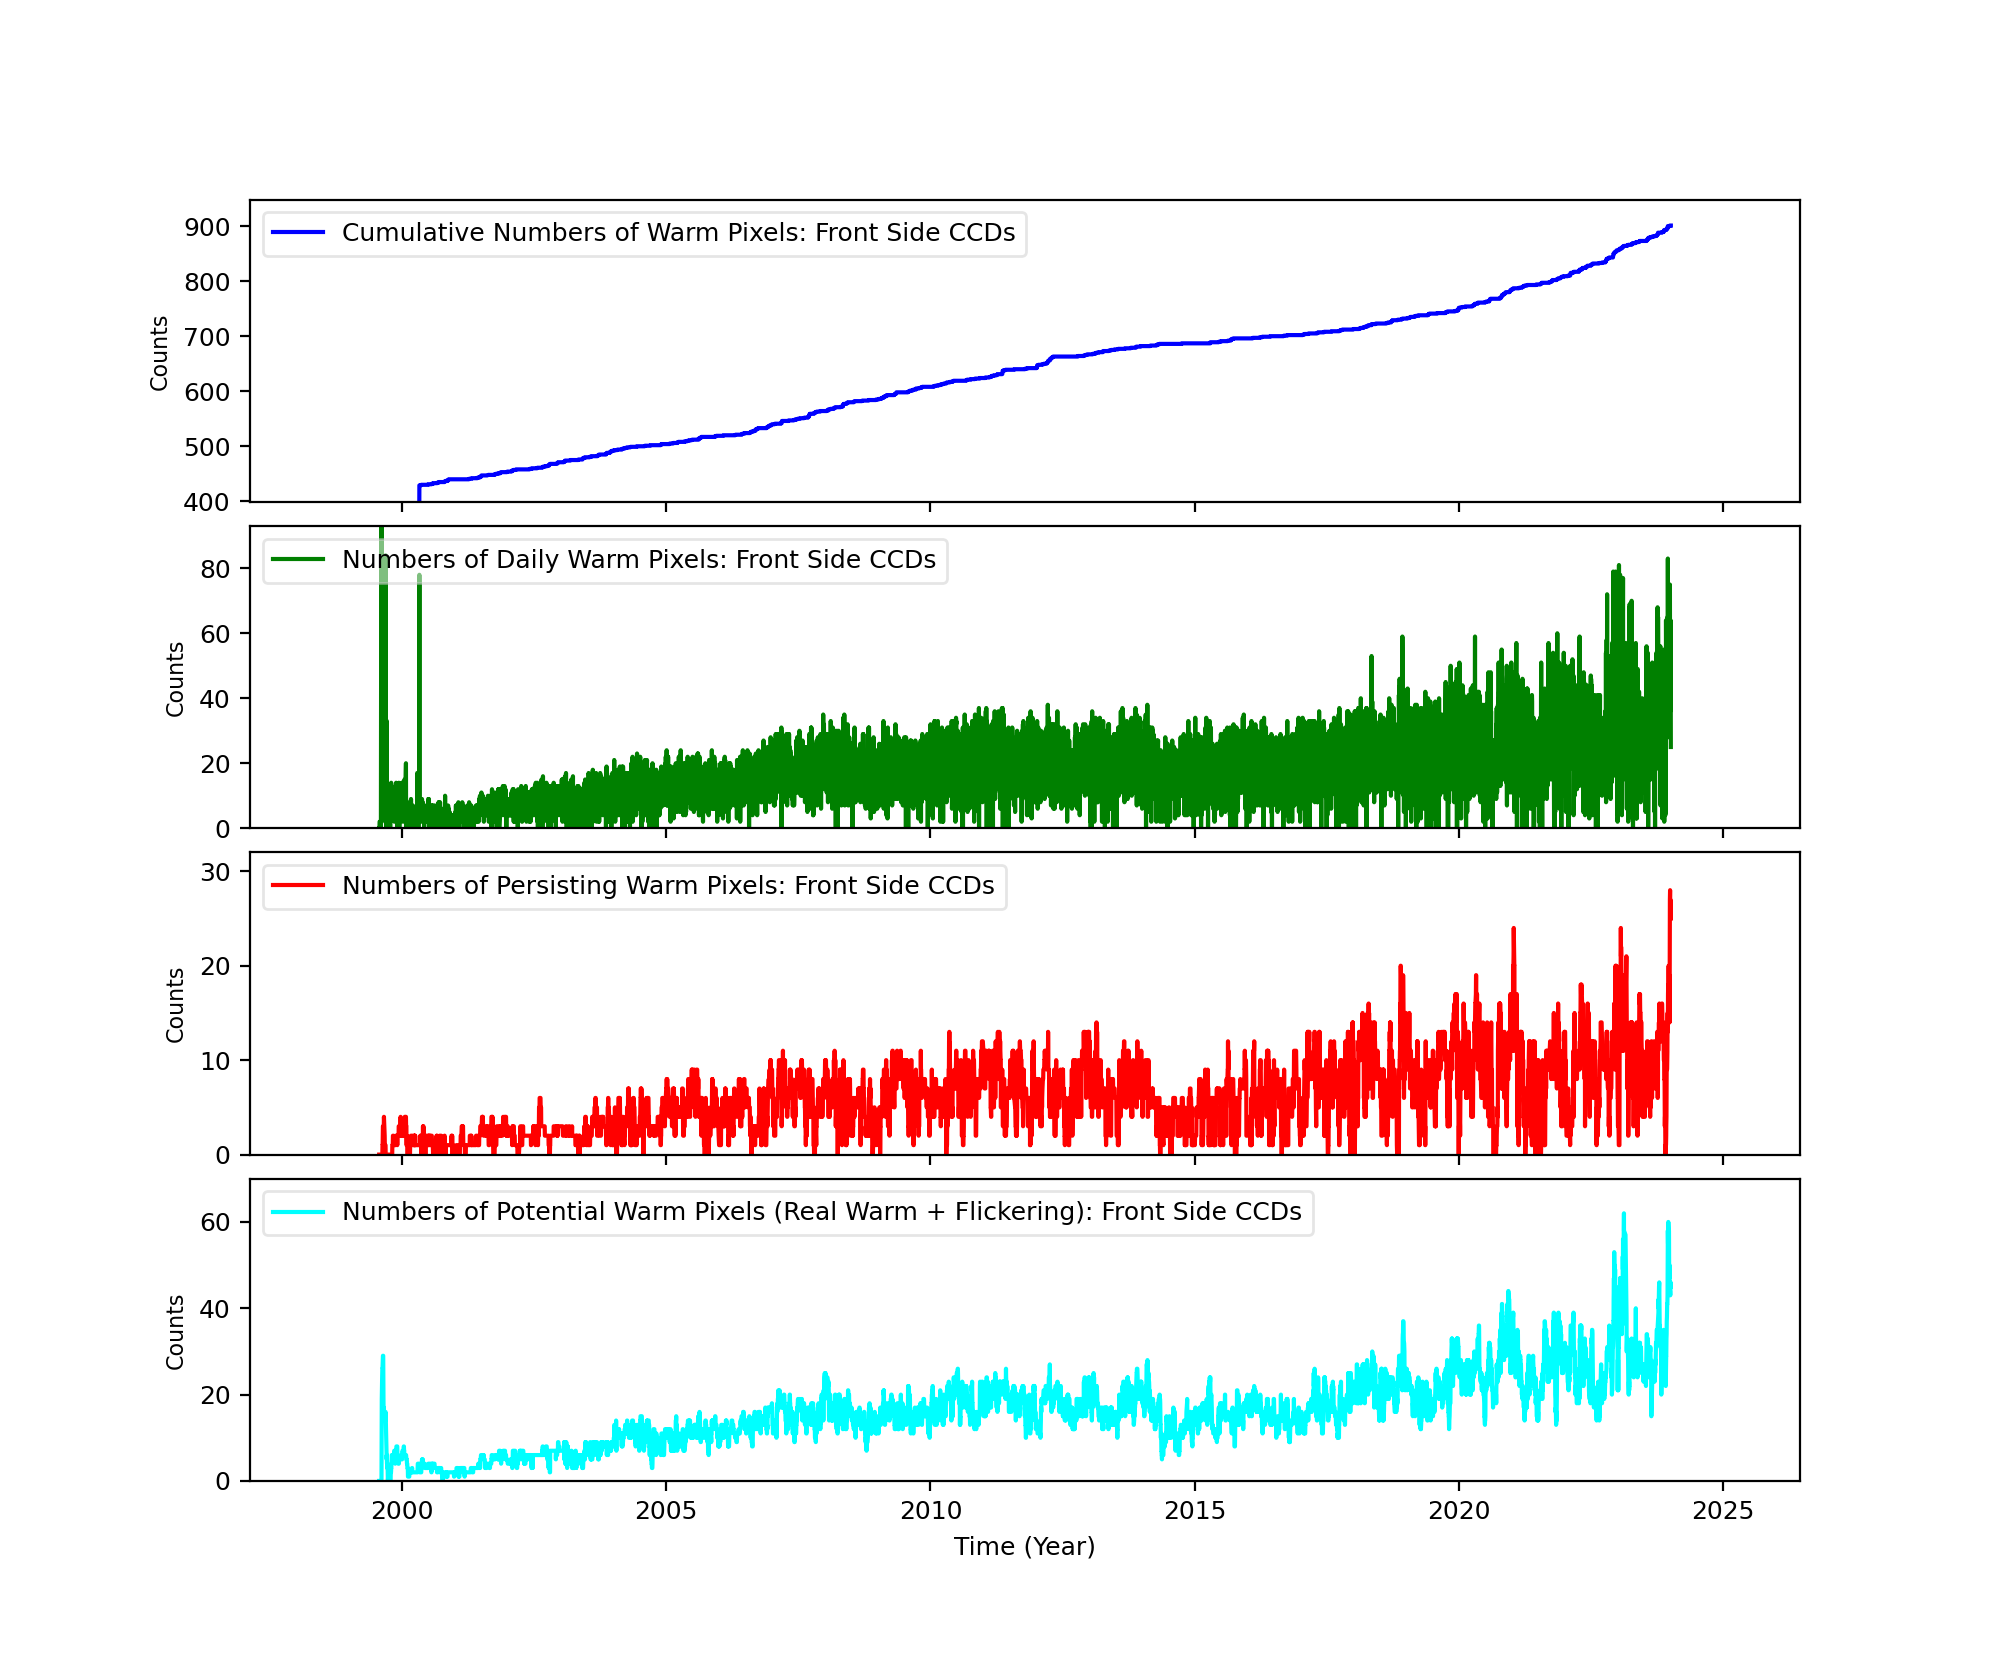
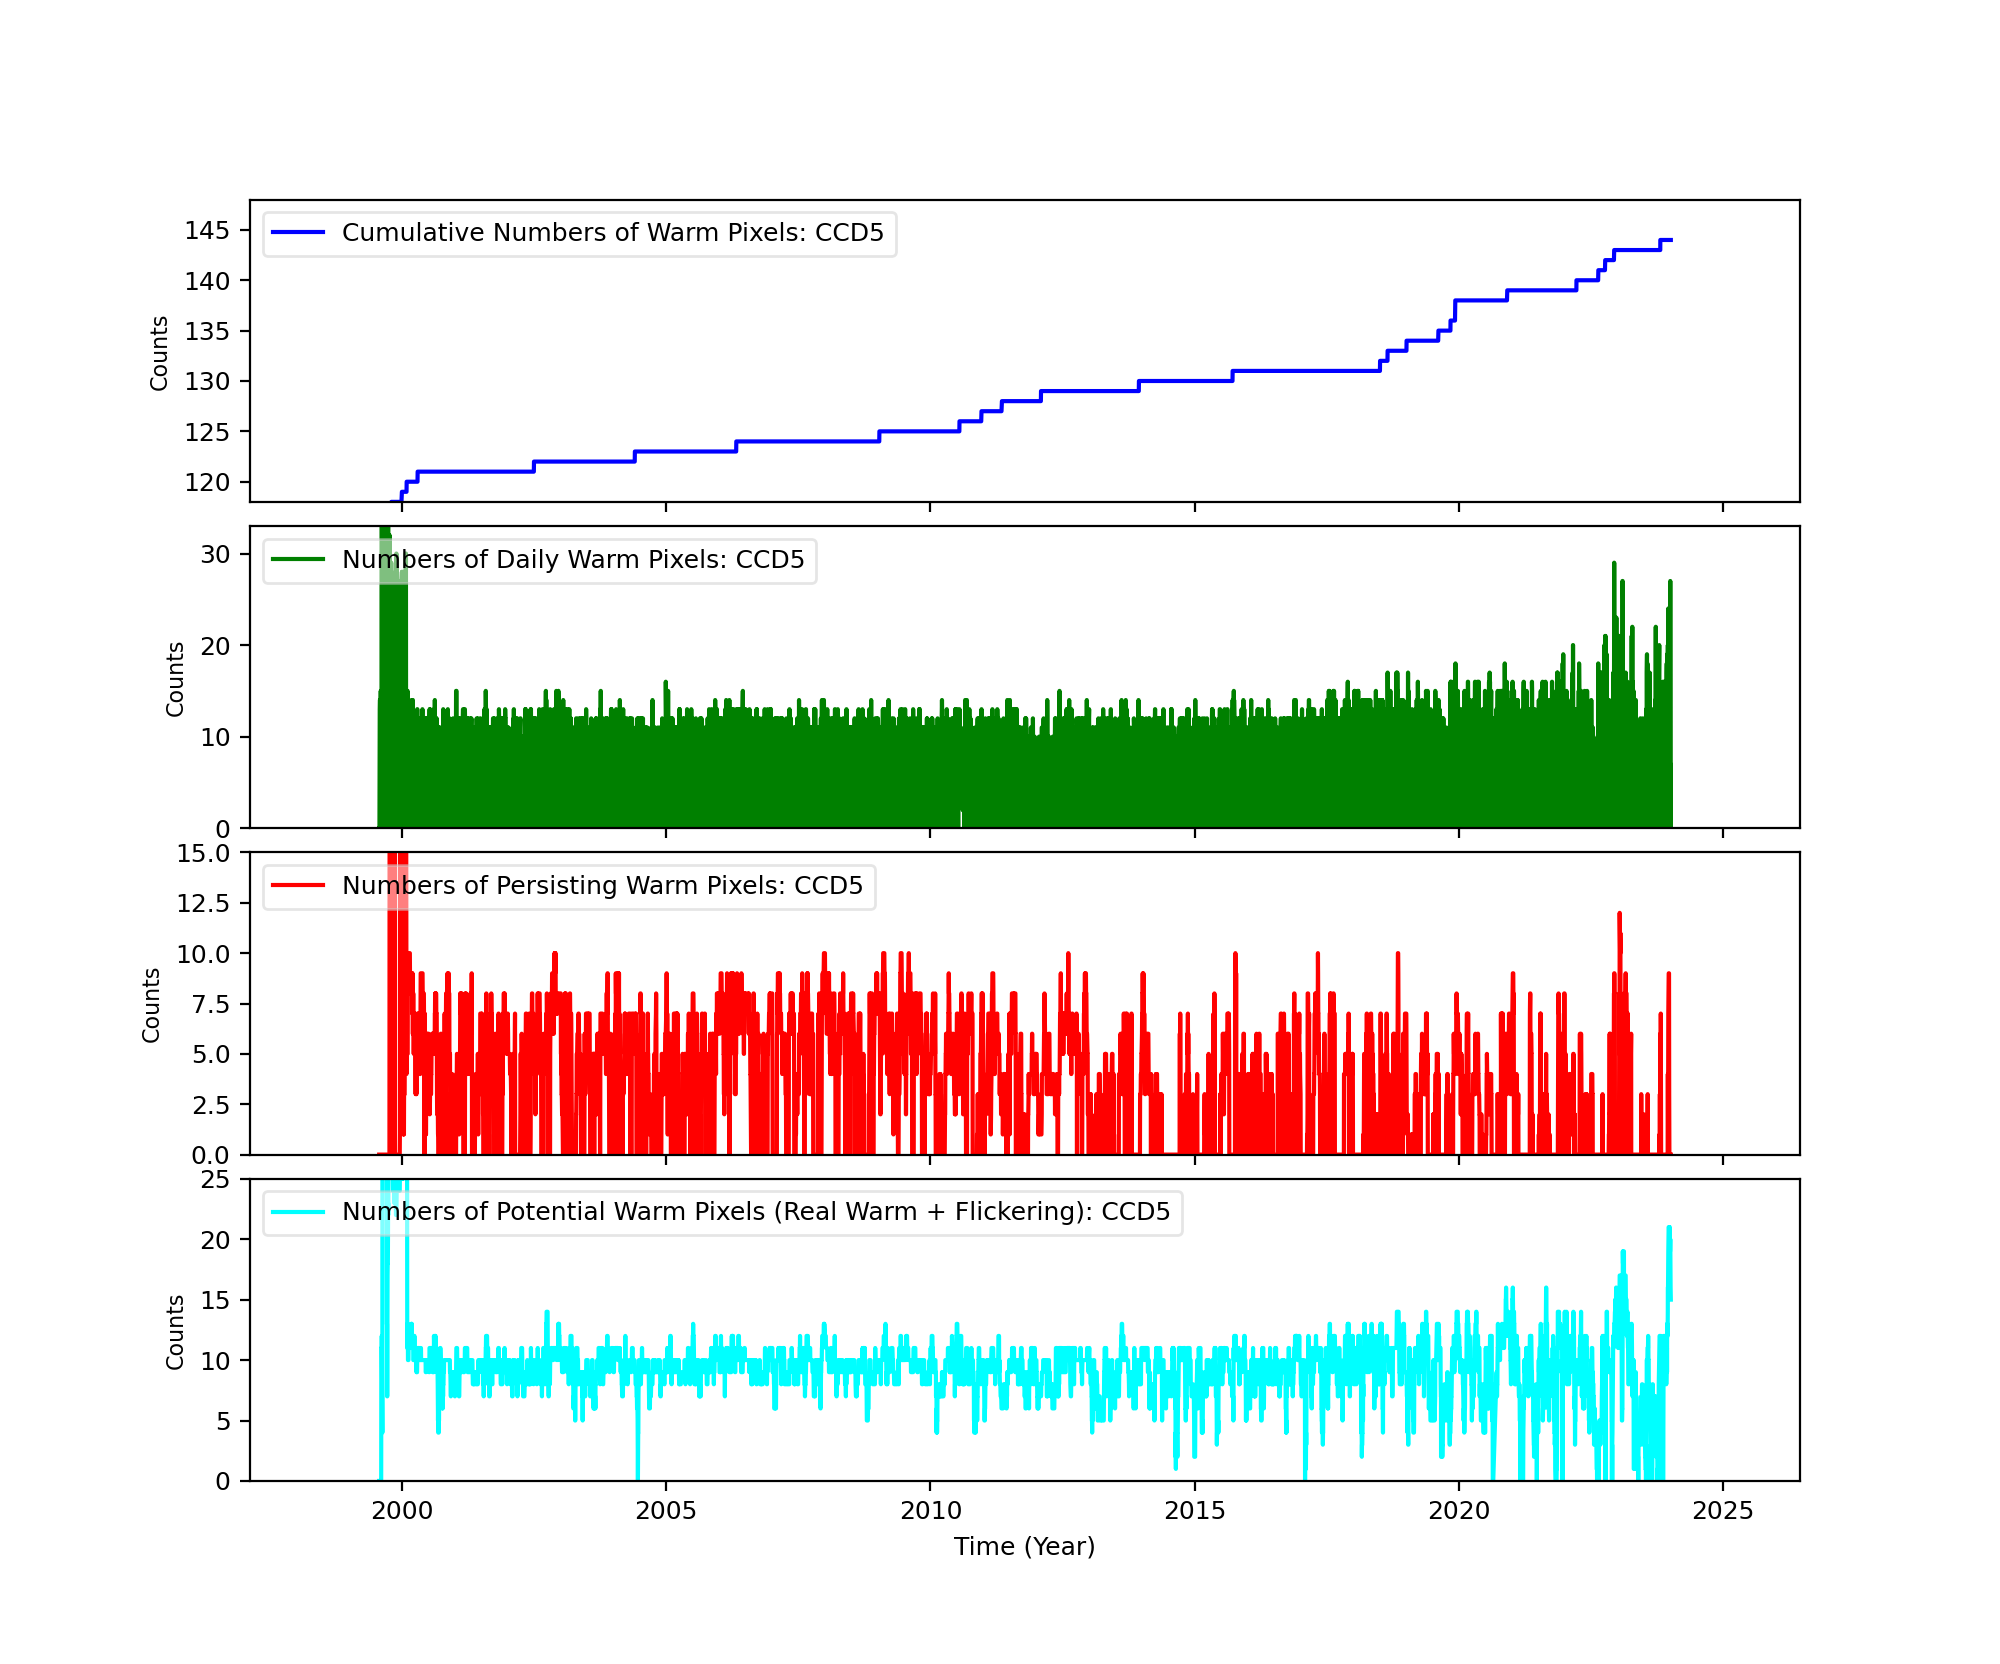
Bad Pixels
The plots below were generated with a new warm pixel finding script. Please see Acis Bad Pixel Page for details.
Front Side CCDs
Back Side CCD (CCD5)
Science Instrument Background Rates
| Name | Low (keV) | High(KeV) | Description |
|---|---|---|---|
| SSoft | 0.00 | 0.50 | Super soft photons |
| Soft | 0.50 | 1.00 | Soft photons |
| Med | 1.00 | 3.00 | Moderate energy photons |
| Hard | 3.00 | 5.00 | Hard Photons |
| Harder | 5.00 | 10.00 | Very Hard photons |
| Hardest | 10.00 | Beyond 10 keV |


HRC
DOSE of Central 4K Pore-Pairs
Please refer to Maximum Dose Trends for more details.
)
|
|---|
IMAGE                NPIX      MEAN    STDDEV      MIN       MAX
HRCI_12_2023.fits  16777216	0.047 	0.222 	0.000 	11.000
)
IMAGE                       NPIX      MEAN    STDDEV      MIN       MAX
HRCI_08_1999_12_2023.fits  16777216	na	na	na	na
No Data
)
IMAGE                       NPIX      MEAN    STDDEV      MIN       MAX
HRCS_08_1999_12_2023.fits  16777216	na	na	na	na
|
|
Max dose trend plots corrected for events that "pile-up"
in the center of the taps due to bad position information.
|
)
|
)
|
)
|
)
|
| Sep 2023 | Jun 2023 | Mar 2023 | Dec 2022 |
|---|
)
|
)
|
)
|
)
|
| Sep 2023 | Jun 2023 | Mar 2023 | Dec 2022 |
|---|
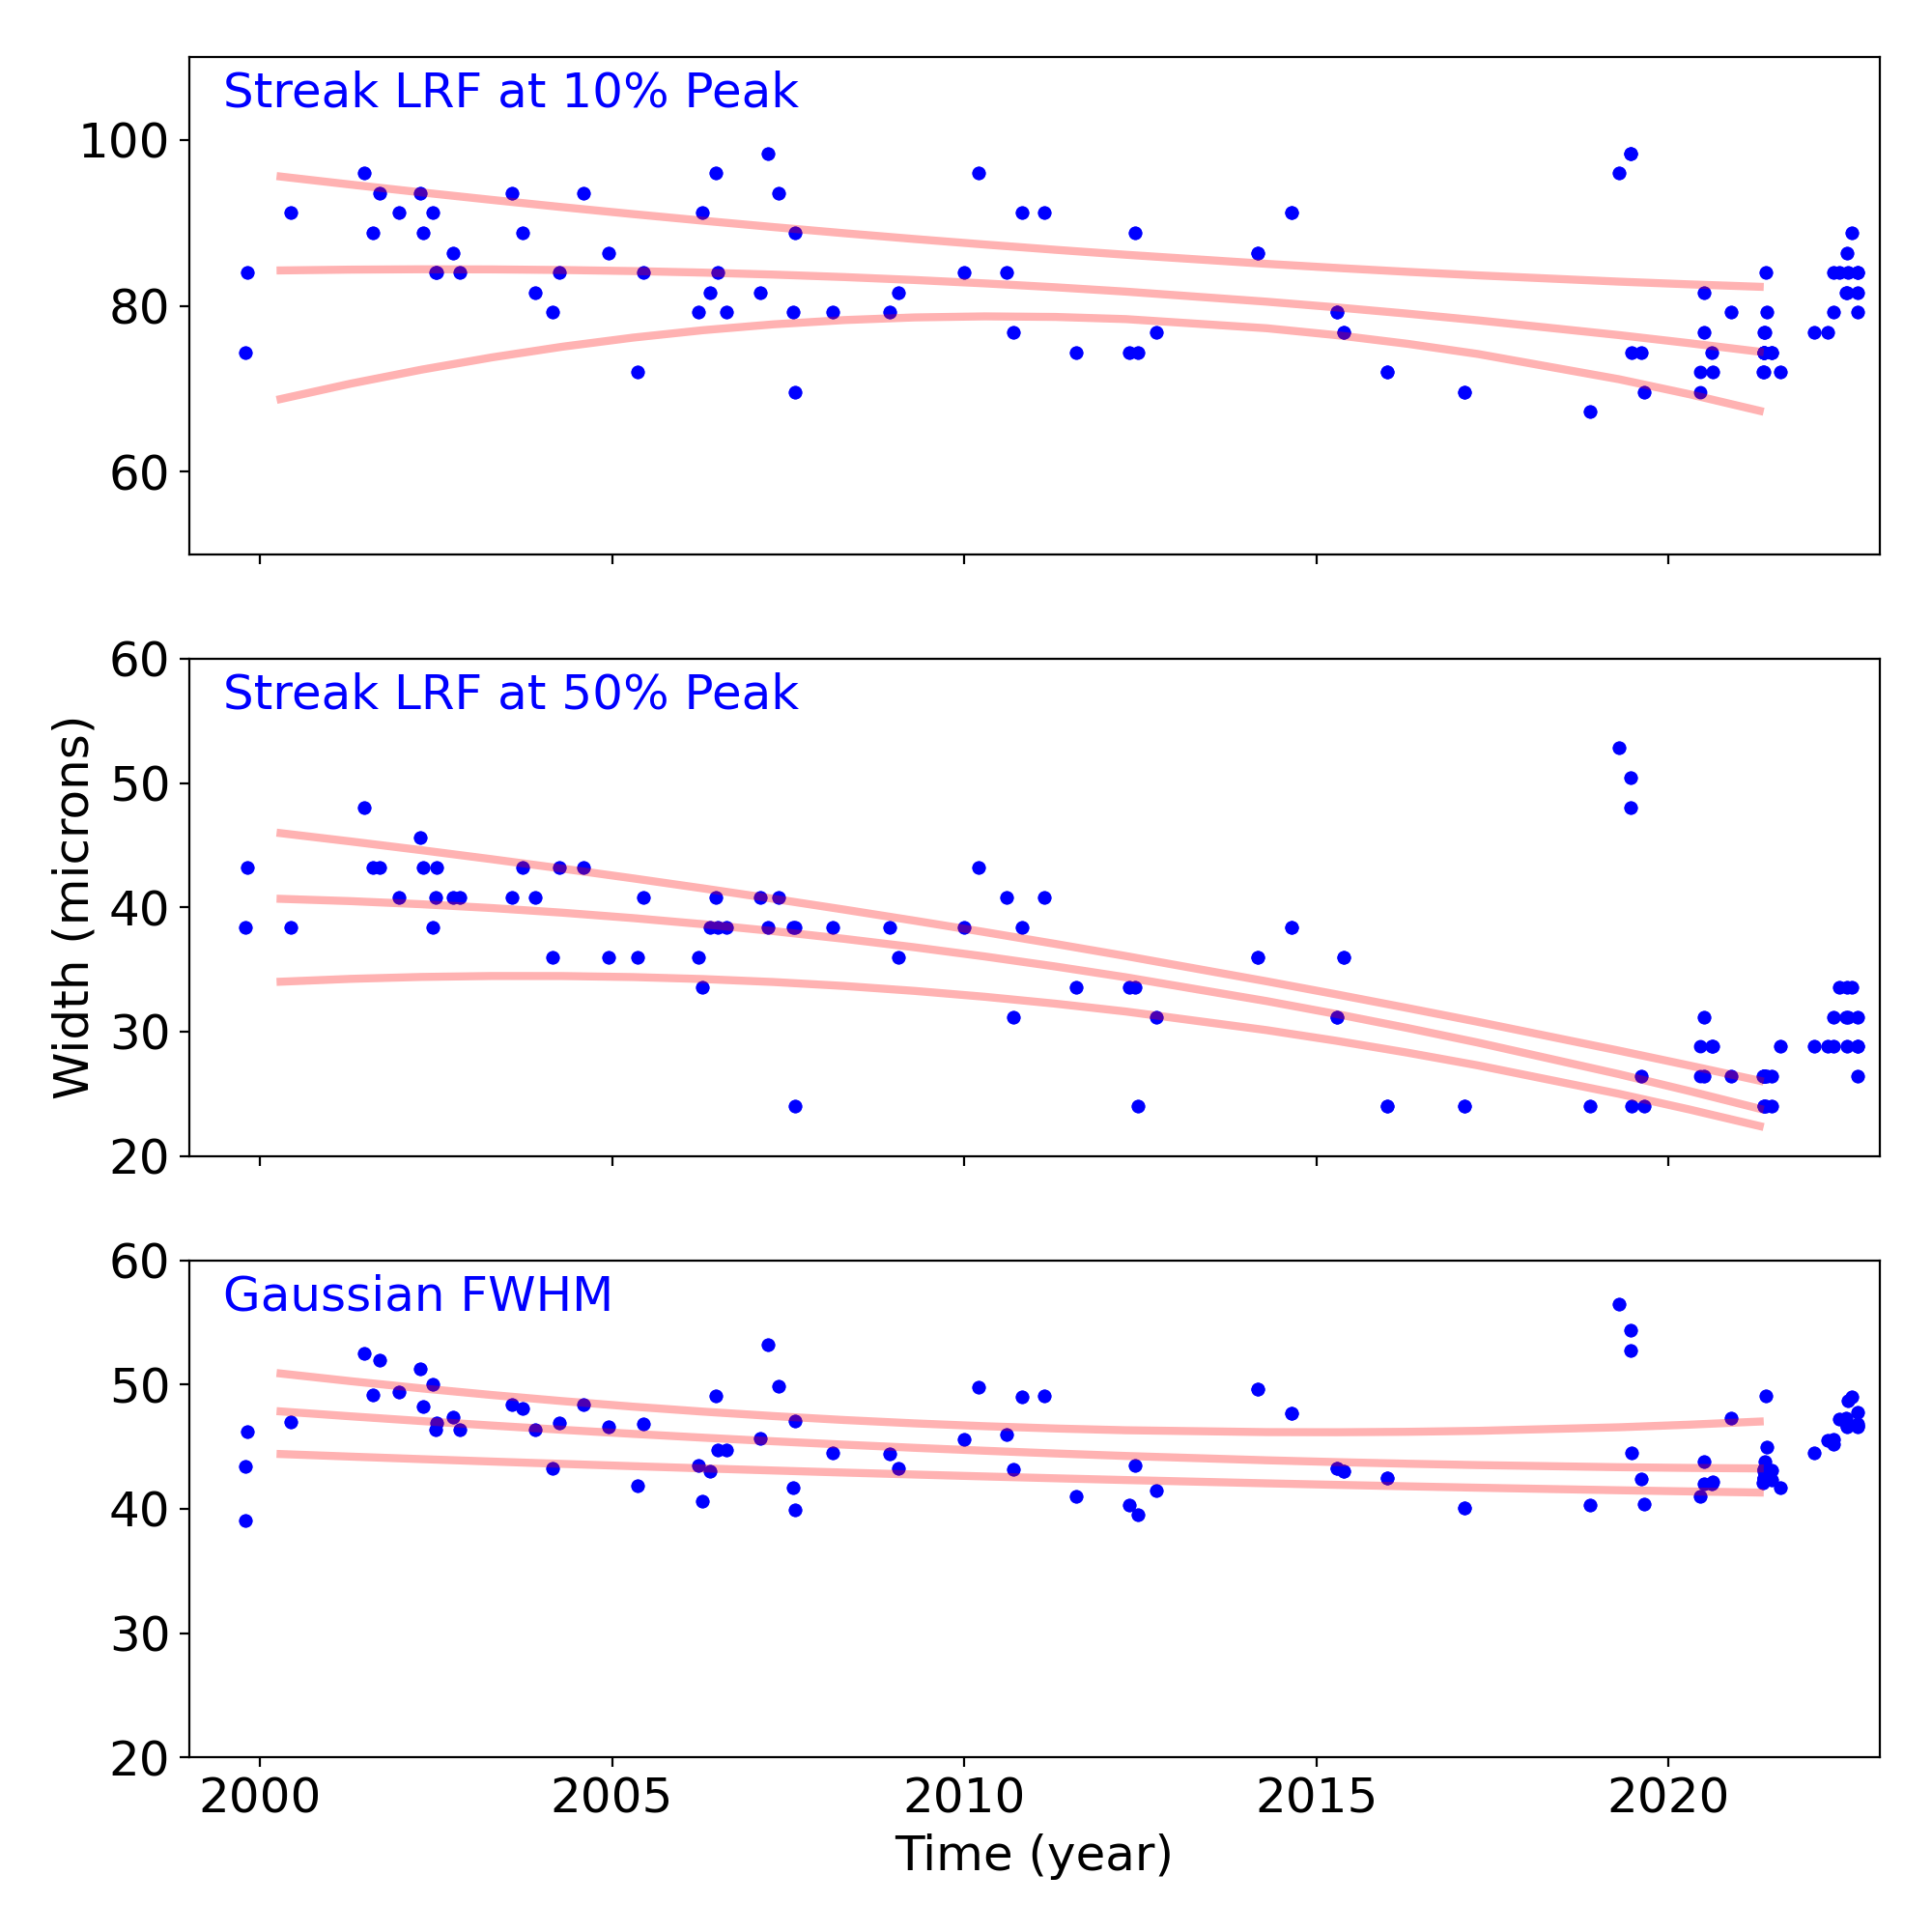
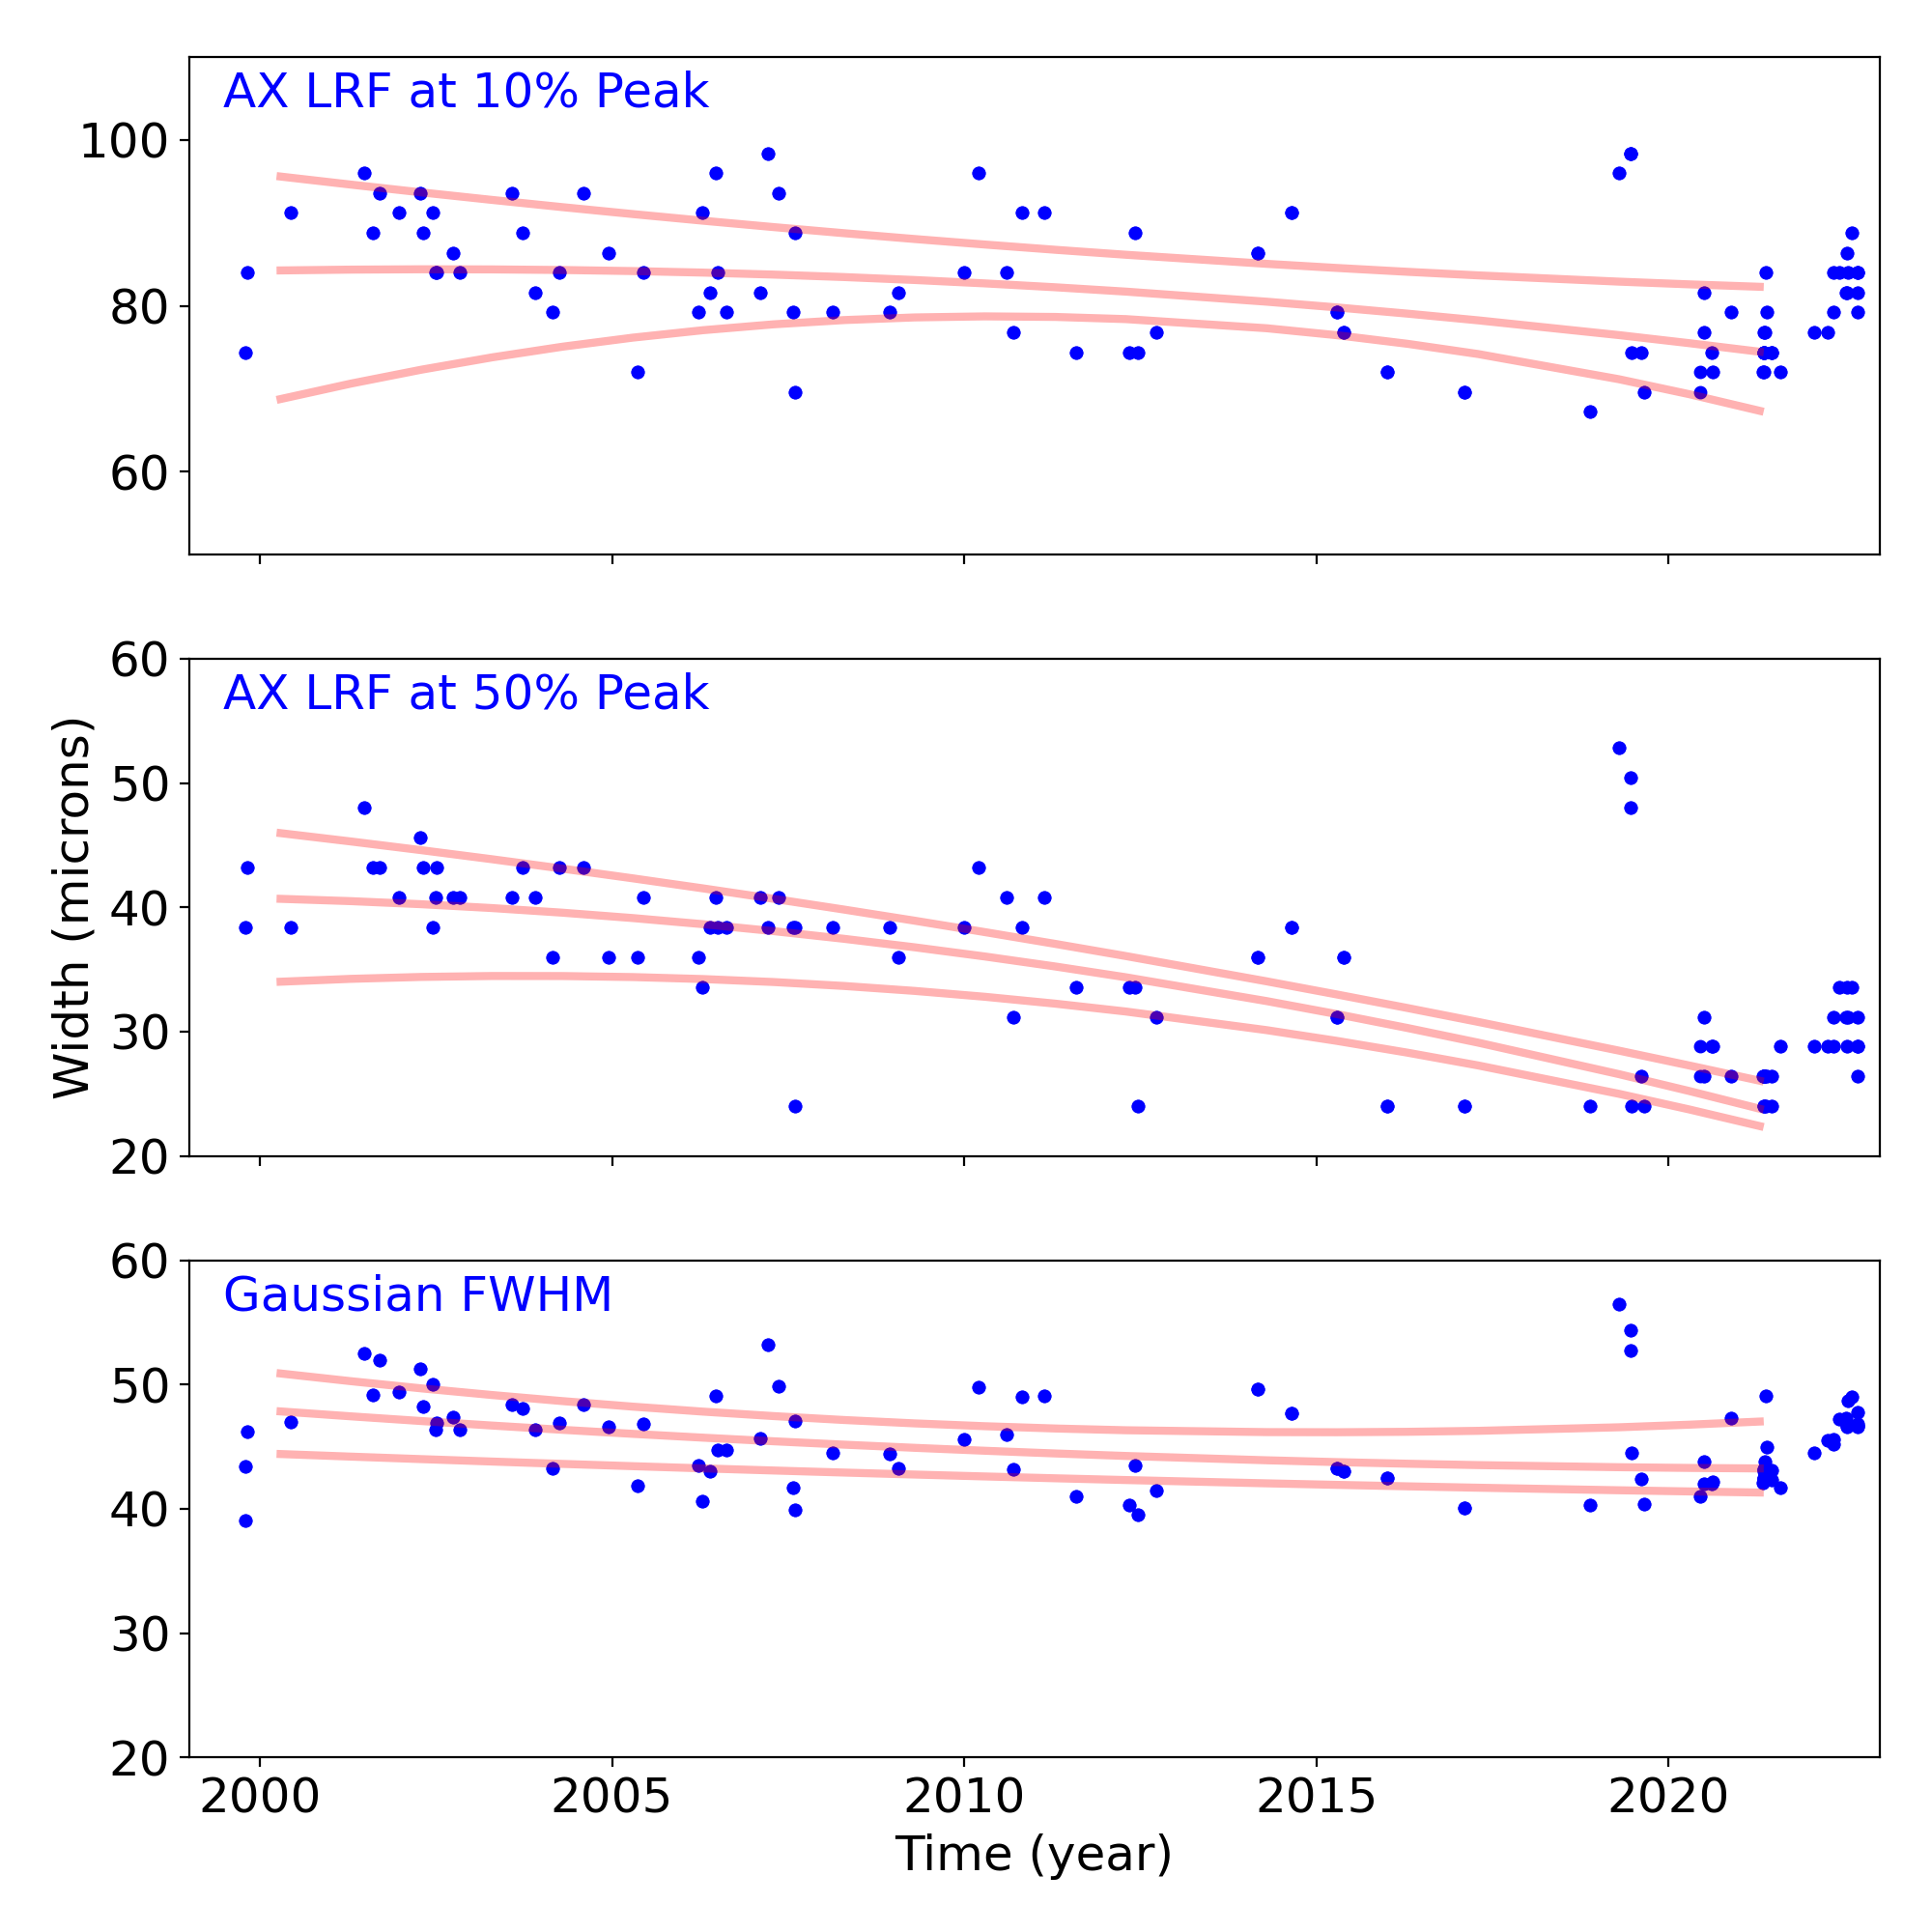
Gratings
Grating Trends/Focus
We plot the width of the zero order streak of ACIS/HETG observations and the width of the zero order image for HRC/LETG observations of point sources. No significant defocusing trend is seen at this time. See Gratings Trends pages.
PCAD
ACA Trending
| ACIS |
)
|
)
|
)
|
|
|---|---|---|---|---|
)
|
)
|
)
| ||
| HRCI |
)
|
)
|
)
|
)
|
| HRCI |
)
|
)
|
)
|
)
|
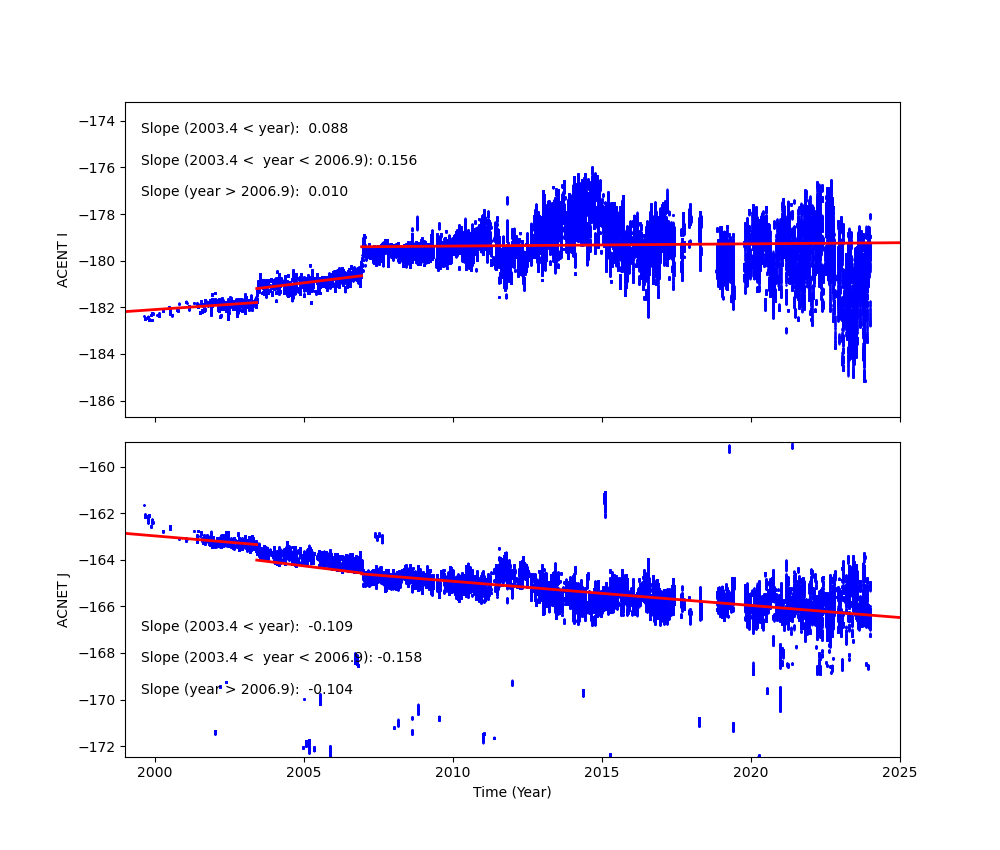
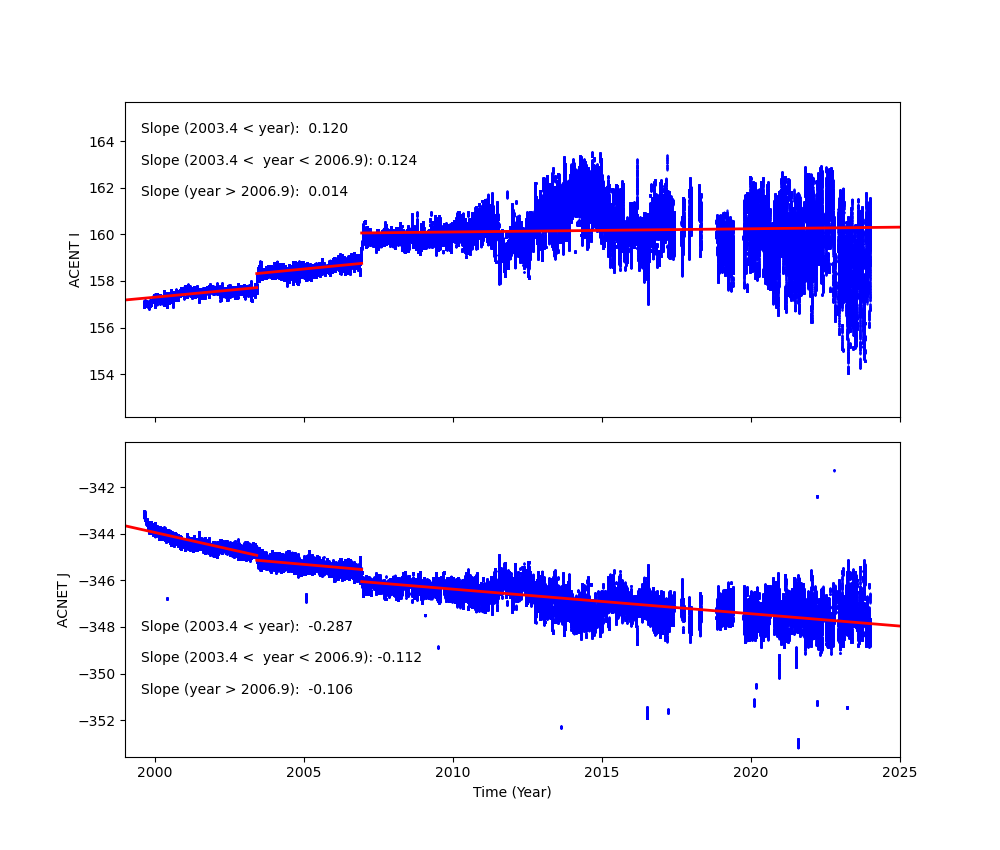
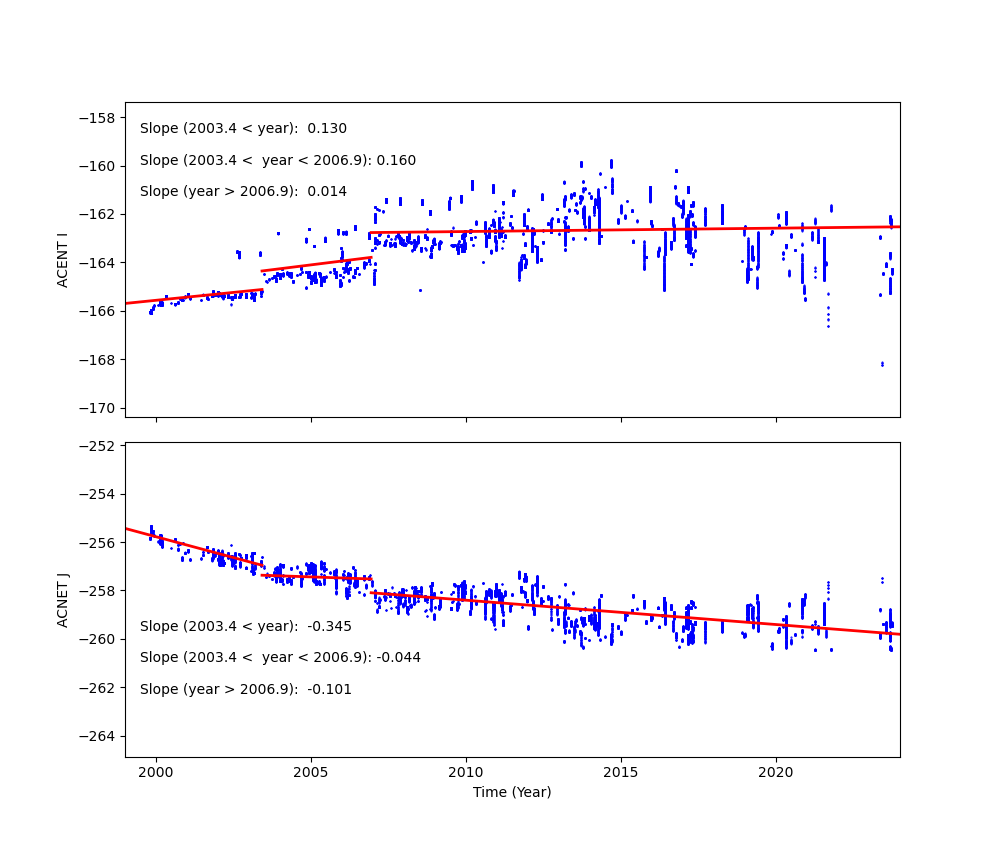
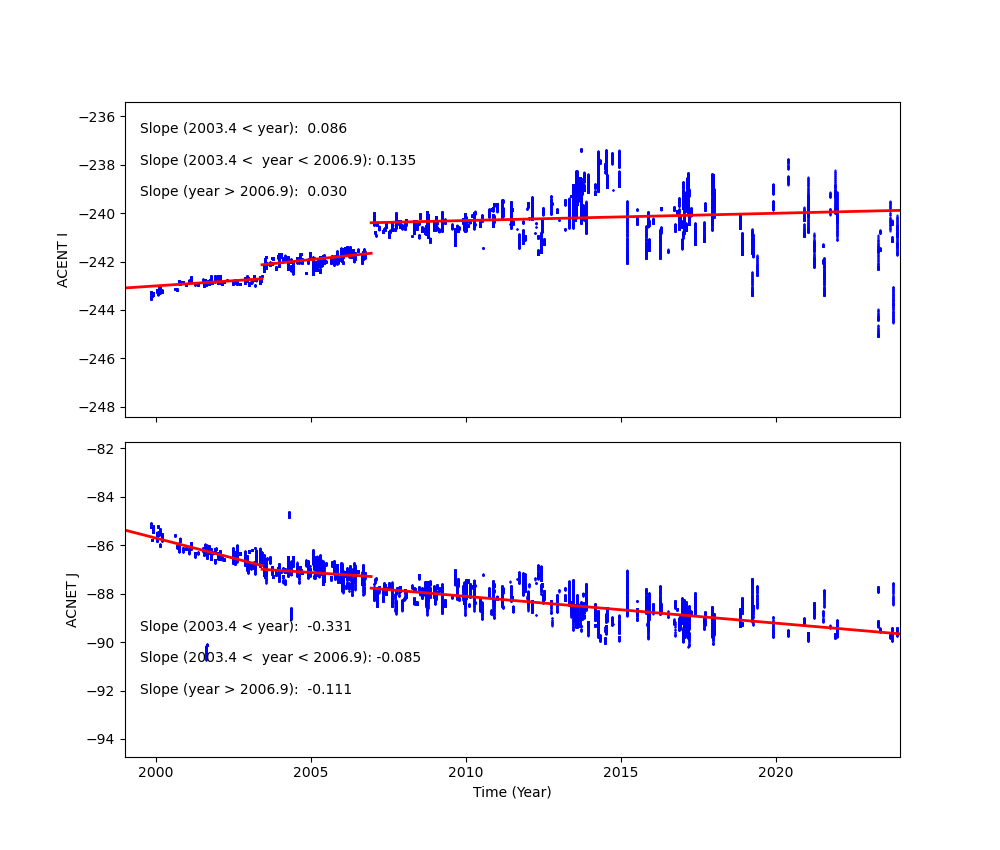
Fid Light Drift
Fid light positions on ACA drift with time. The drift trends of Fid light 2 with ACIS-I and ACIS-S configurations are shown below.
The top panel shows Fid light 2 drift in ACENT I (app. along with -Y axis), and the
bottom panel shows that in ACENT J (app. along with Z axis). The unit is a pixel, and
one pixel is approximately 0.5 arcsec. The slope listed at the top right corner is
the change in a position per year (arcsec/yr). The vertical line on DOM = 1411 (Jun 1, 2003)
indicates a transition date of use of IRU-1 to IRU-2.
See also Tom Aldcroft's updated page:
https://cxc.cfa.harvard.edu/mta/ASPECT/fid_drift
Fid 2 (ACIS-I)
Fid 2 (ACIS-S)
Fid 8 (HRC-I)
Fid 12 (HRC-S)
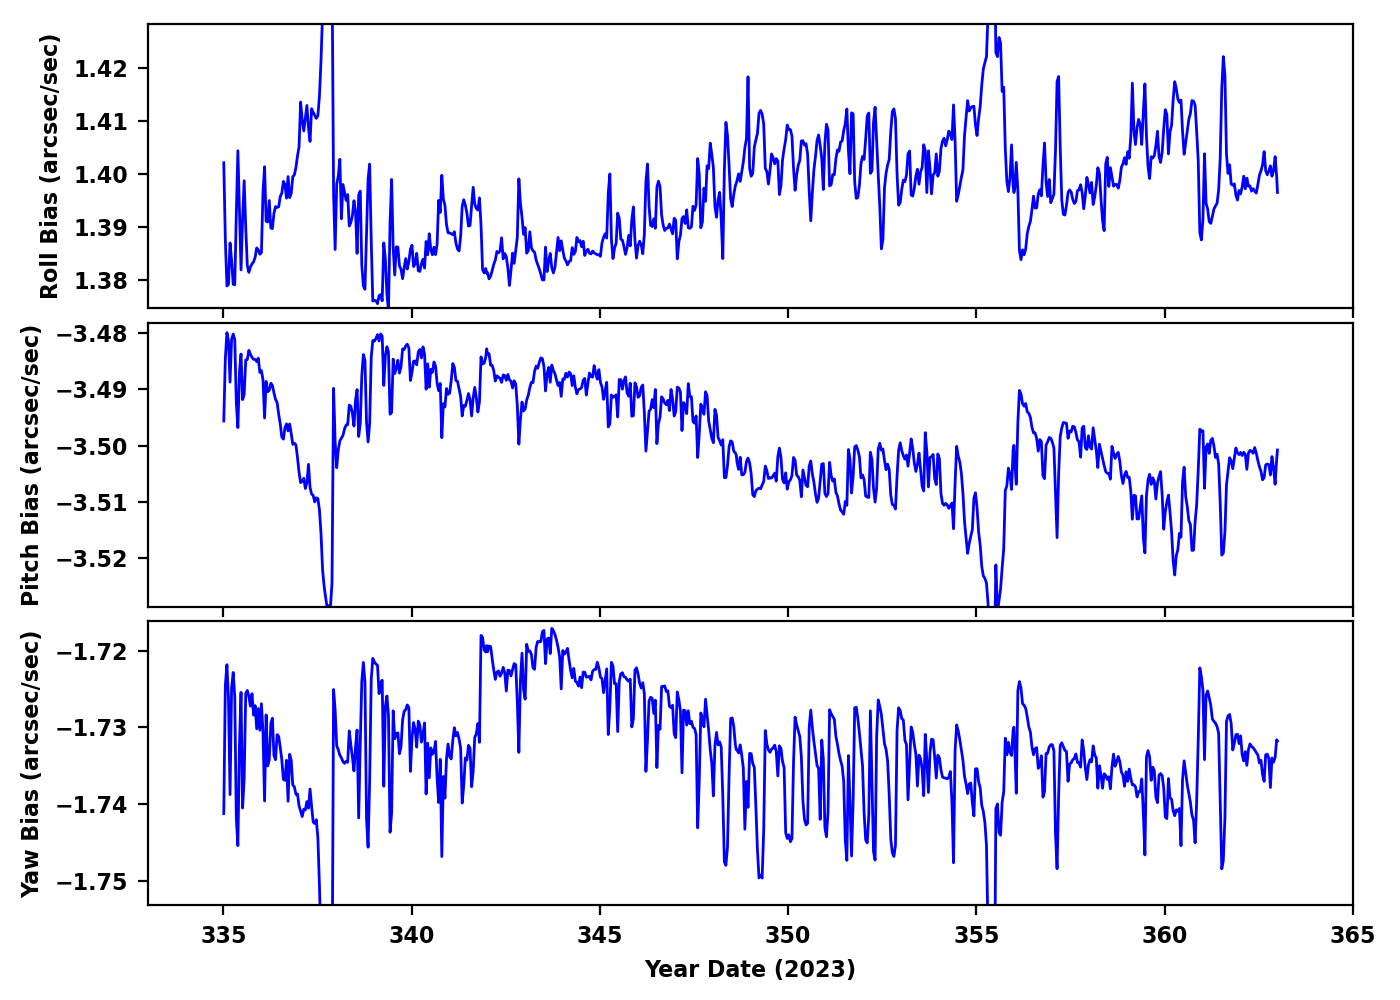
Gyro Bias Drift
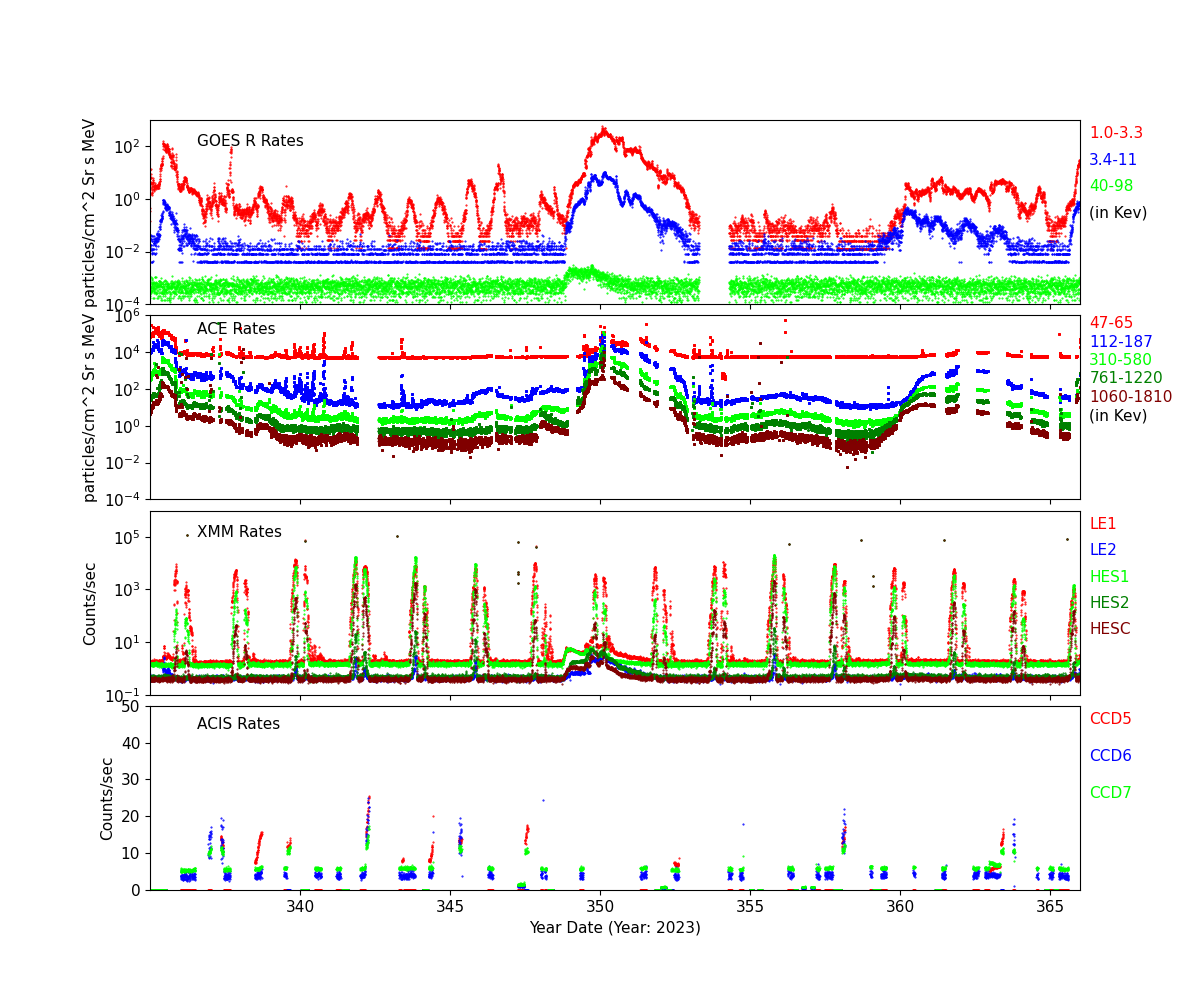
Radiation History
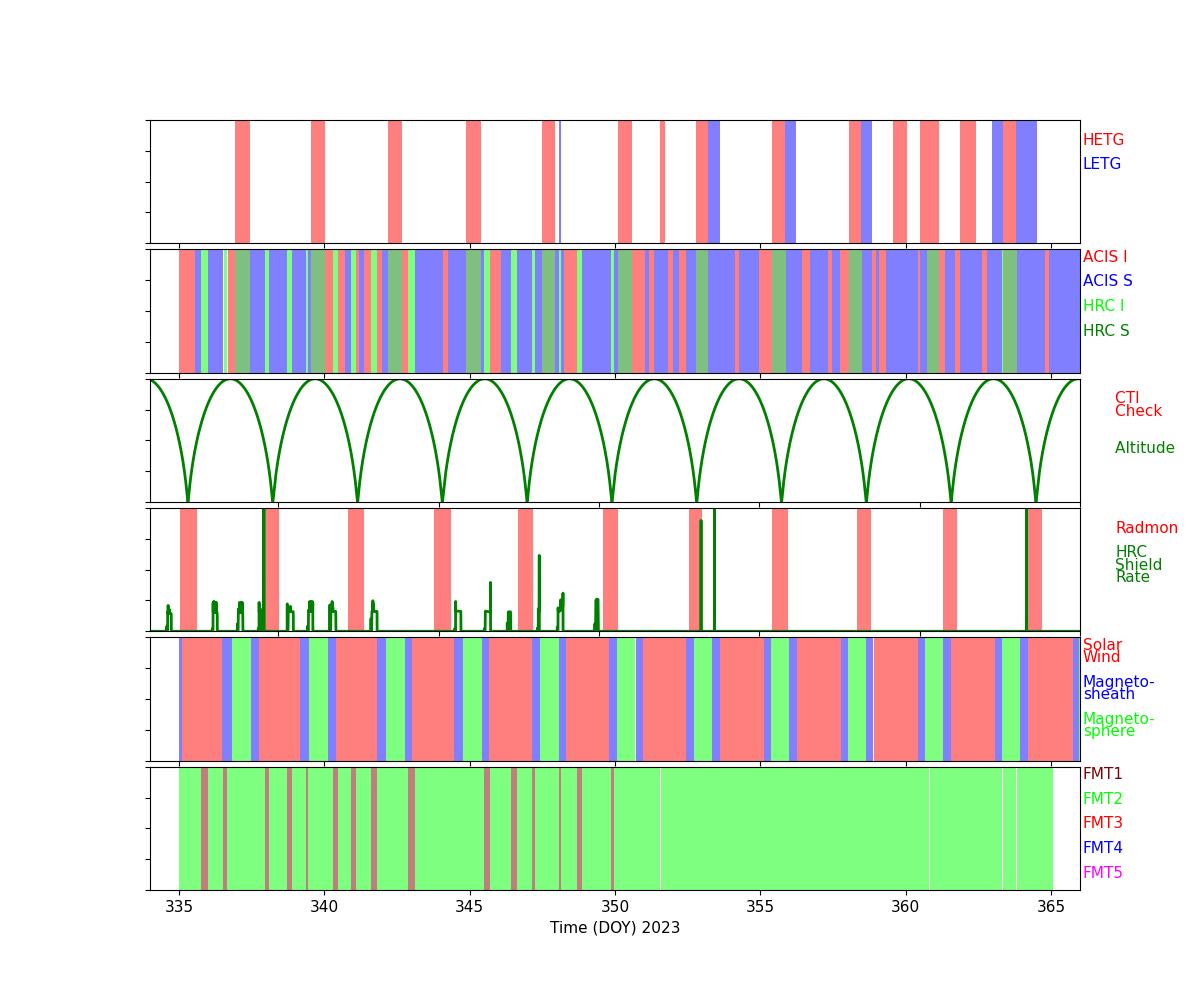
Radiation Count Rates of Dec 2023
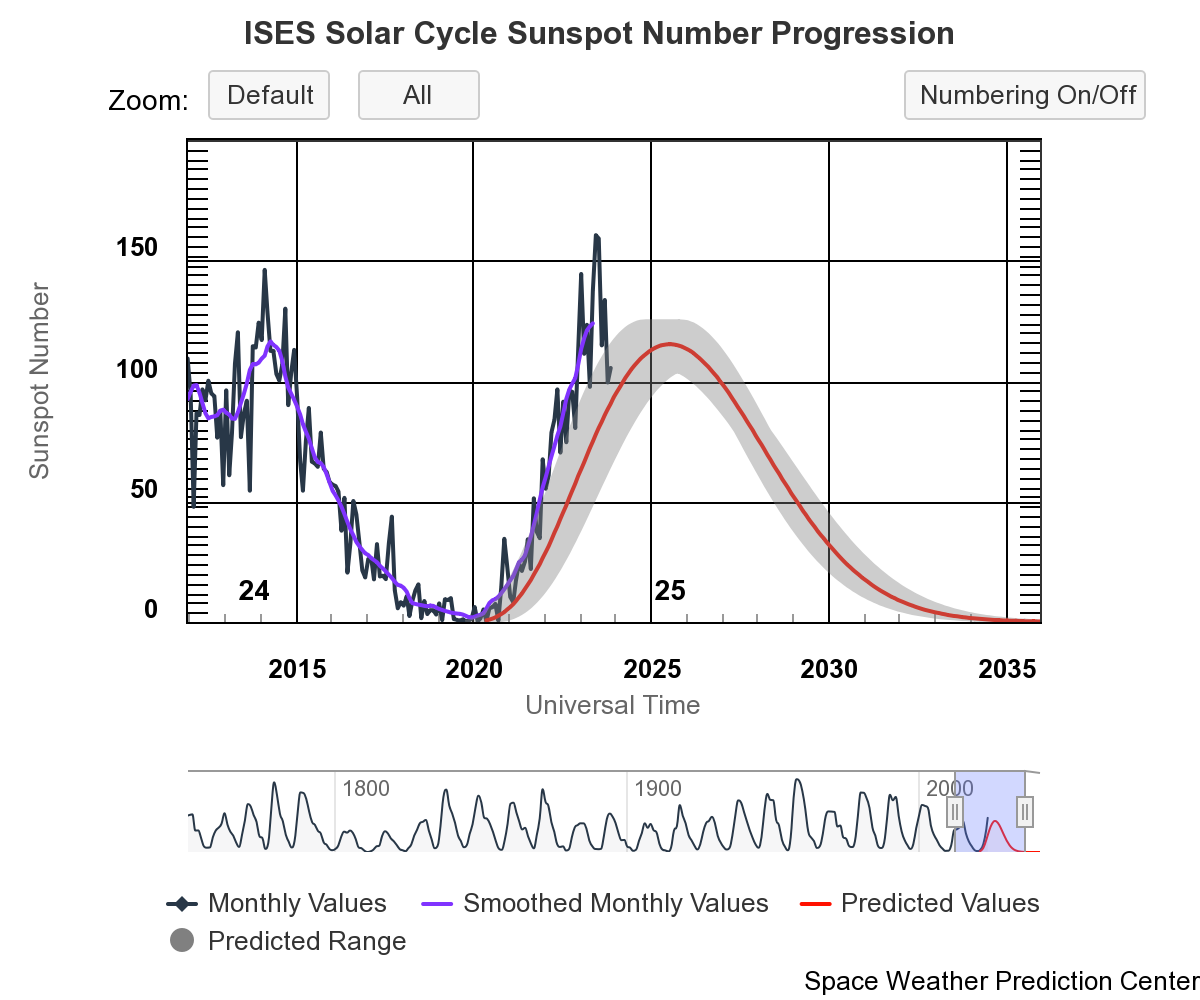
Sun Spot History (See:NOAA Page)
Trending
Critical Trends
| ACIS Temperatures - Daily Maximums | |||||||
|---|---|---|---|---|---|---|---|
| MSID | MEAN | RMS | DELTA/YR | DELTA/YR/YR | UNITS | DESCRIPTION | |
| 1pdeaat | 0.001 | 0.002 | (2.99+/-0.04)e2 | 1.24 +/- 1.33 | K | PSMC DEA PS A TEMP | |
| HRMA Computed Averages - Daily Maximums | |||||||
|---|---|---|---|---|---|---|---|
| MSID | MEAN | RMS | DELTA/YR | DELTA/YR/YR | UNITS | DESCRIPTION | |
| obaavg | -0.014 | 0.001 | (2.98+/-0.02)e2 | -1.27 +/- 0.65 | TEMP | OBA/TFTE | |
| EPHIN Temperatures - Daily Maximums | |||||||
|---|---|---|---|---|---|---|---|
| MSID | MEAN | RMS | DELTA/YR | DELTA/YR/YR | UNITS | DESCRIPTION | |
| teio | 0.026 | 0.009 | (3.30+/-0.22)e2 | 2.97 +/- 3.64 | K | EPHIN ELECTRONICS HOUSING TEMP | |
| tephin | 0.008 | 0.003 | (3.39+/-0.08)e2 | 2.15 +/- 2.13 | K | EPHIN SENSOR HOUSING TEMP | |
| S/C Main Temperatures - Daily Maximums | |||||||
|---|---|---|---|---|---|---|---|
| MSID | MEAN | RMS | DELTA/YR | DELTA/YR/YR | UNITS | DESCRIPTION | |
| tcylfmzm | 0.020 | 0.004 | (3.13+/-0.10)e2 | 1.24 +/- 1.91 | K | CNT CYL TEMP:-Z SIDE UNDER LAE-1 | |
| tcylfmzp | 0.020 | 0.004 | (3.16+/-0.09)e2 | 1.12 +/- 1.75 | K | CNT CYL TEMP:-Z SIDE UNDER LAE-2 | |
| S/C Ancillary Temperatures - Daily Maximums | |||||||
|---|---|---|---|---|---|---|---|
| MSID | MEAN | RMS | DELTA/YR | DELTA/YR/YR | UNITS | DESCRIPTION | |
| tfssbkt1 | 0.015 | 0.012 | (3.50+/-0.29)e2 | 3.75 +/- 4.12 | K | FSS BRAC | |
| tfssbkt2 | 0.017 | 0.013 | (3.45+/-0.29)e2 | 3.80 +/- 4.17 | K | FSS BRAC | |
| tsctsf1 | 0.004 | 0.002 | (3.24+/-0.05)e2 | 0.53 +/- 1.31 | K | SC-TS FITTING -1 TEMP | |
| tsctsf6 | 0.003 | 0.002 | (3.24+/-0.05)e2 | 0.36 +/- 1.36 | K | SC-TS FITTING -6 TEMP | |
| MUPS - Daily Maximums | |||||||
|---|---|---|---|---|---|---|---|
| MSID | MEAN | RMS | DELTA/YR | DELTA/YR/YR | UNITS | DESCRIPTION | |
| pm1thv1t | 0.016 | 0.007 | (3.52+/-0.16)e2 | -1.18 +/- 2.51 | K | MUPS 1 THRUSTER VALVE 01 TEMP | |
| pm2thv1t | 0.063 | 0.022 | (3.18+/-0.51)e2 | 0.41 +/- 7.55 | K | MUPS 2 THRUSTER VALVE 01 TEMP | |
| pm1thv2t | 0.015 | 0.007 | (3.54+/-0.16)e2 | -0.79 +/- 2.65 | K | MUPS 1 THRUSTER VALVE 02 TEMP | |
| pm2thv2t | 0.059 | 0.023 | (3.16+/-0.55)e2 | 1.27 +/- 8.00 | K | MUPS 2 THRUSTER VALVE 02 TEMP | |
| pline02t | 0.023 | 0.005 | (3.36+/-0.12)e2 | 0.78 +/- 2.28 | K | PROP LINE TEMP 02 | |
| pline03t | 0.025 | 0.006 | (3.29+/-0.14)e2 | 0.57 +/- 2.15 | K | PROP LINE TEMP 03 | |
| pline04t | 0.023 | 0.005 | (3.17+/-0.11)e2 | 2.82 +/- 2.29 | K | PROP LINE TEMP 04 | |
Quarterly Trends
- HRMA Struts
| Previous Quarter | |||||||
| MSID | MEAN | RMS | DELTA/YR | DELTA/YR/YR | UNITS | DESCRIPTION | |
| 4rt584t | 0.005 | 7.523e-04 | (3.02+/-0.02)e2 | 1.21 +/- 0.40 | K | RT 584 - STRUT TEMP | |
|---|---|---|---|---|---|---|---|
| 4rt585t | 0.005 | 7.450e-04 | (3.03+/-0.02)e2 | 1.26 +/- 0.39 | K | RT 585 - STRUT TEMP | |
| 4rt586t | 0.004 | 6.409e-04 | (2.98+/-0.02)e2 | 1.13 +/- 0.33 | K | RT 586 - STRUT TEMP | |
| 4rt587t | 0.003 | 4.826e-04 | (2.92+/-0.01)e2 | 0.85 +/- 0.24 | K | RT 587 - STRUT TEMP | |
| 4rt597t | 0.010 | 0.001 | (3.11+/-0.03)e2 | 1.76 +/- 0.82 | K | RT 597 - TFTE TEMP | |
| 4rt598t | 0.010 | 0.001 | (3.10+/-0.03)e2 | 1.46 +/- 0.82 | K | RT 598 - TFTE TEMP | |
- OB Forward Bulkhead
| Previous Quarter | |||||||
| MSID | MEAN | RMS | DELTA/YR | DELTA/YR/YR | UNITS | DESCRIPTION | |
| 4rt705t | 0.007 | 8.594e-04 | (2.93+/-0.02)e2 | 0.79 +/- 0.50 | K | RT 705 - OB BUL | |
|---|---|---|---|---|---|---|---|
| 4rt706t | 0.007 | 8.687e-04 | (2.92+/-0.02)e2 | 0.84 +/- 0.51 | K | RT 706 - OB BUL | |
| 4rt707t | 0.007 | 8.628e-04 | (2.94+/-0.02)e2 | 0.67 +/- 0.51 | K | RT 707 - OB BULKHEAD TEMP | |
| 4rt708t | 0.008 | 9.395e-04 | (3.00+/-0.02)e2 | 0.78 +/- 0.55 | K | RT 708 - OB BULKHEAD TEMP | |
| 4rt709t | 0.008 | 0.001 | (3.01+/-0.02)e2 | 0.71 +/- 0.59 | K | RT 709 - OB BULKHEAD TEMP | |
| 4rt710t | 0.009 | 0.001 | (3.03+/-0.03)e2 | 0.81 +/- 0.63 | K | RT 710 - OB BULKHEAD TEMP | |
- HRMA Thermal
- HRMA Thermal
| Previous Quarter | |||||||
| MSID | MEAN | RMS | DELTA/YR | DELTA/YR/YR | UNITS | DESCRIPTION | |
| 4rt568t | 0.006 | 9.319e-04 | (3.00+/-0.02)e2 | 1.26 +/- 0.53 | K | RT 568 - HRMA TEMP | |
|---|---|---|---|---|---|---|---|
| 4rt569t | 0.002 | 2.987e-04 | (2.97+/-0.01)e2 | 0.64 +/- 0.12 | K | RT 569 - HRMA TEMP | |
| 4rt570t | 0.001 | 1.639e-04 | (2.96+/-0.00)e2 | 0.31 +/- 0.06 | K | RT 570 - HRMA TEMP | |
| 4rt575t | 0.008 | 0.001 | (3.06+/-0.03)e2 | 1.55 +/- 0.67 | K | RT 575 - OB CONE TEMP | |
| 4rt576t | 0.007 | 9.279e-04 | (2.96+/-0.02)e2 | 1.40 +/- 0.53 | K | RT 576 - OB CONE TEMP | |
| 4rt578t | 0.009 | 0.002 | (3.04+/-0.04)e2 | 1.66 +/- 0.87 | K | RT 578 - OB CONE TEMP | |
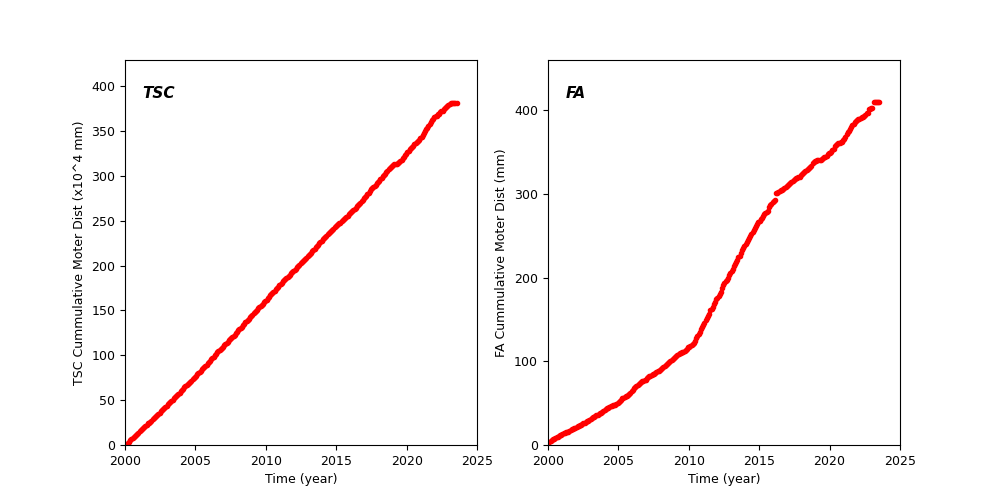
Spacecraft Motions
TSC and FA Cummulative Moter Distance
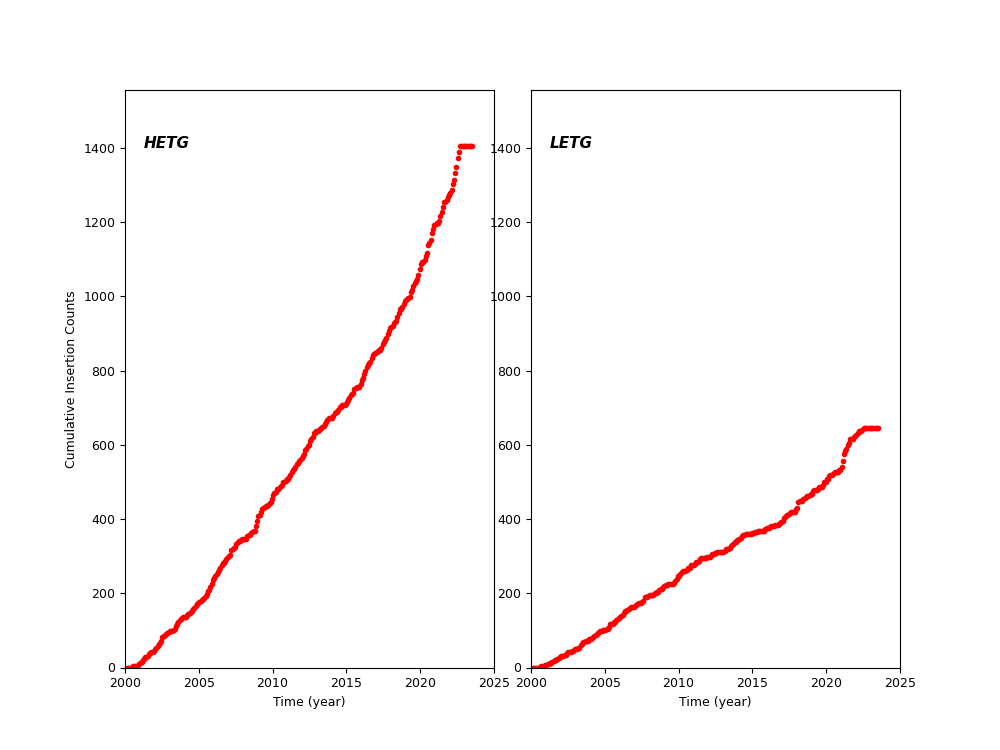
HETG and LETG Cummulative Insertion Counts
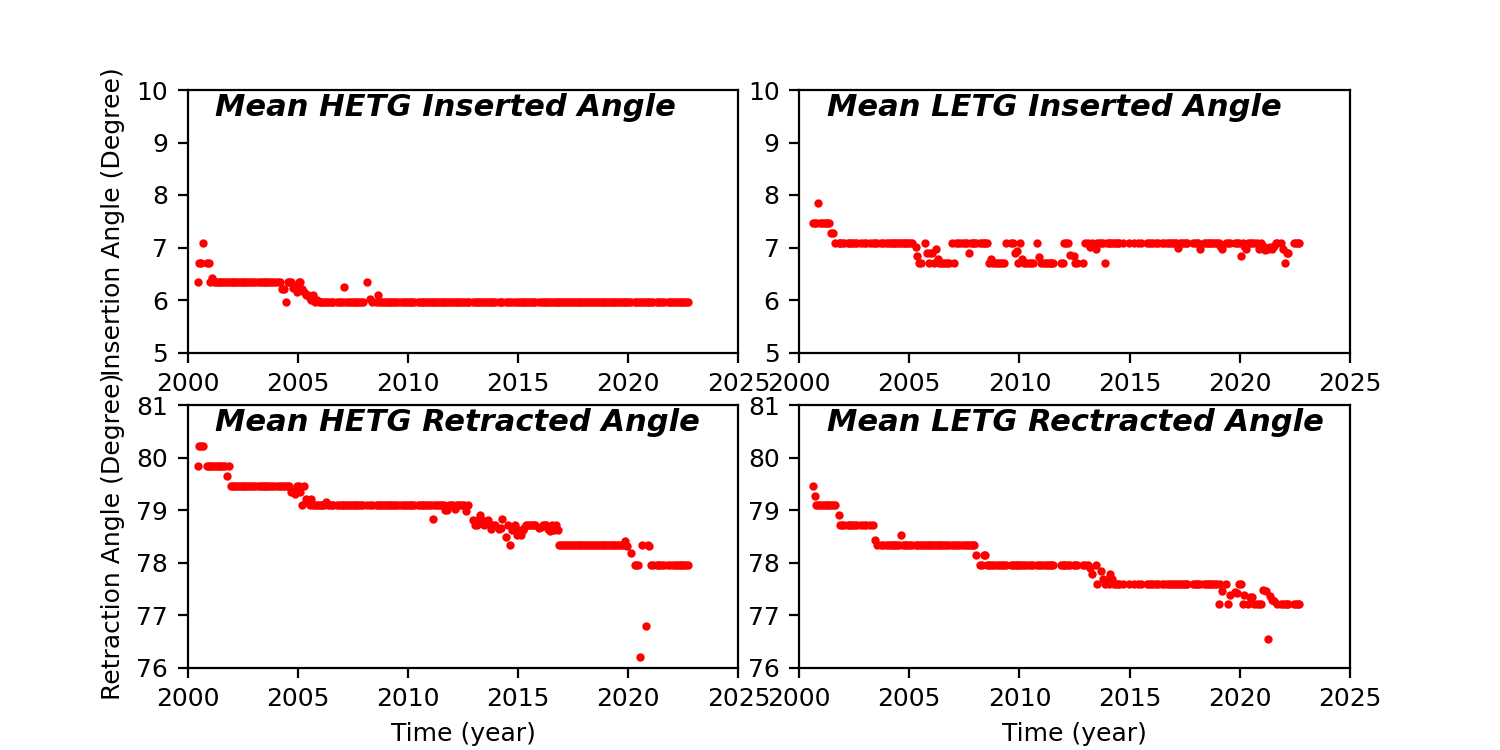
HETG/LETG Insertion/Retraction Angle
Reaction Wheel Rotations