ACIS
ACIS DOSE Registered-Photon-Map
The steps we took to compute the dose map are;
- Level 1 Event files for a specified month are obtained from archive.
- Image data including I2, I3, S2, S3 CCDs are extracted from all event files.
- All the extracted image data were merged to create a month long exposure map for the month.
- The exposure map is opened with ds9, and check a distribution of count rates against energy. From this, estimate the upper threshold value. Any events beyond this upper threshold are assumed erroneous events such as bad pixels.
- Using this upper threshold, the data is filtered, and create a cleaned exposure map for the month.
- The exposure map from each month from the Sep 1999 is added up to create a cumulative exposure map for each month.
- Using fimgstatistic, we compute count rate statistics for each CCDs.
- For observations with high data drop rates (e.g., Crab nebula, Cas A), we corrected the observations by adding events.
Please check more detail plots at Telemetered Photon Dose Trend page.
)
)
)
Statistics:
# IMAGE     NPIX     MEAN        RMS        MIN     MAX
ACIS_feb24 6004901       3.889         4.964           0.0     2063


I2 node 0  262654	3.291360	2.112832	0.0	 61.0
I2 node 1  262654	3.943986	4.097789	0.0	1683.0
I2 node 2  262654	3.680570	2.264956	0.0	 93.0
I2 node 3  262654	3.358362	2.825841	0.0	881.0

I3 node 0  262654	3.756046	2.270021	0.0	 85.0
I3 node 1  262654	4.060100	2.349815	0.0	112.0
I3 node 2  262654	4.134439	2.390958	0.0	 81.0
I3 node 3  262654	3.681518	4.591352	0.0	2063.0

S2 node 0  262654	4.378699	2.545297	0.0	534.0
S2 node 1  262654	4.963329	2.797372	0.0	238.0
S2 node 2  262654	5.864491	5.076923	0.0	1333.0
S2 node 3  262654	5.801348	5.495694	0.0	465.0

S3 node 0  262654	8.091437	5.980689	0.0	 72.0
S3 node 1  262654	8.733512	4.834805	0.0	 75.0
S3 node 2  262654	9.116743	4.755241	0.0	 68.0
S3 node 3  262654	7.136380	3.342574	0.0	 42.0
)
)
)
Statistics:
 IMAGE     NPIX      MEAN        RMS           MIN      MAX
ACIS_total   6004901       2678.537         3402.525           0.0   156594


I2 node 0  262654	2325.509957	471.000813	495.0	14904.0
I2 node 1  262654	2450.463094	682.846630	506.0	154588.0
I2 node 2  262654	2478.409235	525.287067	532.0	16118.0
I2 node 3  262654	2482.666574	642.783630	497.0	34070.0

I3 node 0  262654	2673.363091	658.892335	496.0	14677.0
I3 node 1  262654	2755.310811	1750.233879	518.0	55988.0
I3 node 2  262654	2465.384028	461.543302	491.0	14935.0
I3 node 3  262654	2445.007377	496.967171	460.0	35672.0

S2 node 0  262654	3123.682276	504.268406	1691.0	22541.0
S2 node 1  262654	3316.196775	754.598141	1870.0	18340.0
S2 node 2  262654	3676.616088	758.623754	2285.0	32498.0
S2 node 3  262654	3634.618362	613.349564	2007.0	80931.0

S3 node 0  262654	5536.068666	2994.073179	2436.0	54867.0
S3 node 1  262654	6755.455921	2386.203738	0.0	69061.0
S3 node 2  262654	5489.139055	1362.226725	2558.0	27490.0
S3 node 3  262654	4306.773257	769.249781	2599.0	26630.0
)
|
)
|
)
|
)
|
| Nov 2023 | Aug 2023 | May 2023 | Feb 2023 |
|---|
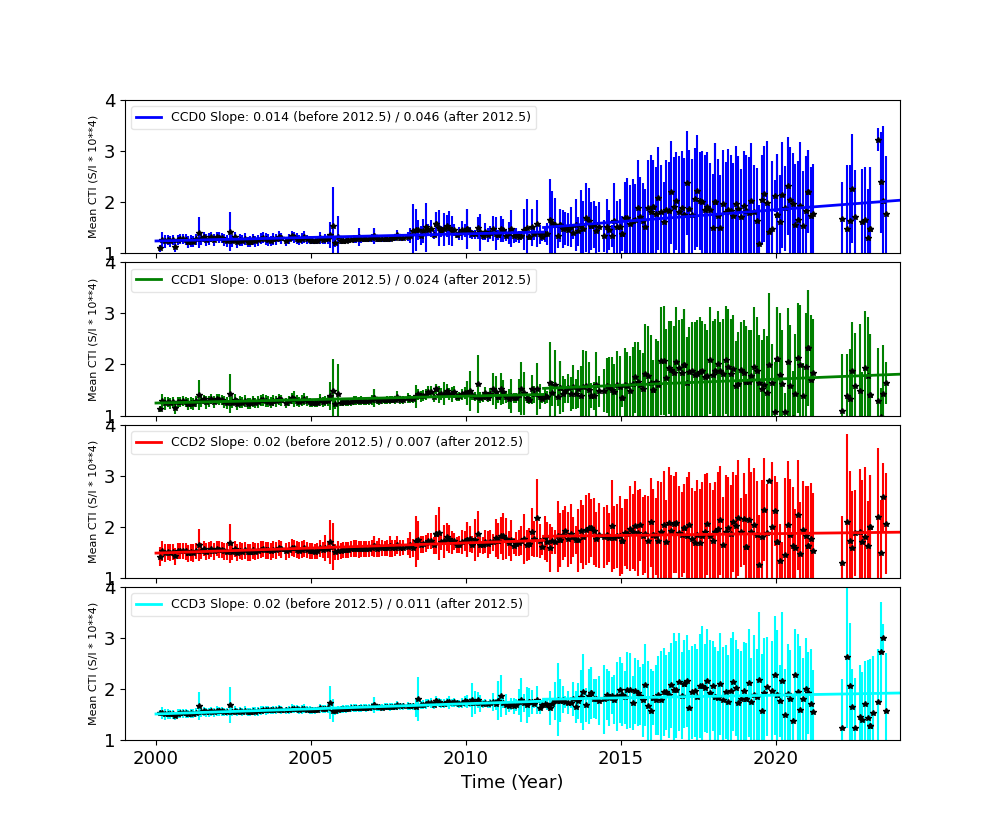
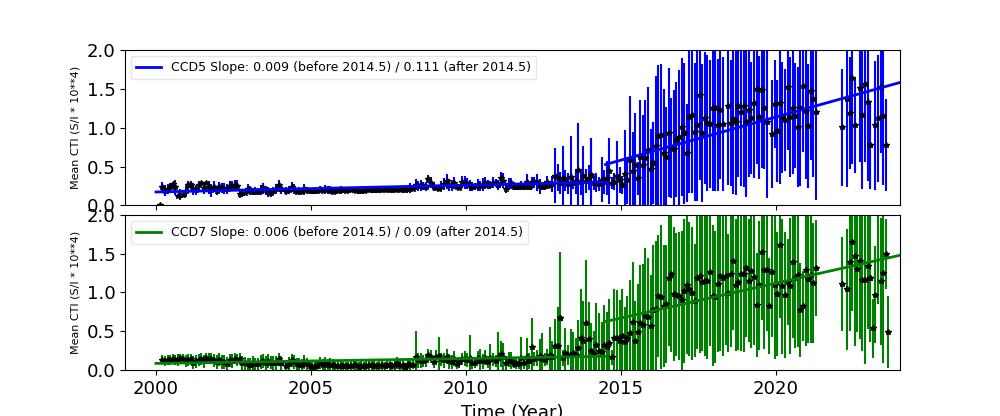
The Mean Detrended CTI
We report CTIs with a refined data definition. CTIs were computed for the temperature dependency corrected data. Please see CTI page for detailed explanation. CTI's are computed for Mn K alpha, and defined as slope/intercept x10^4 of row # vs ADU. Data file: here
Imaging CCDs
Spectral CCDs
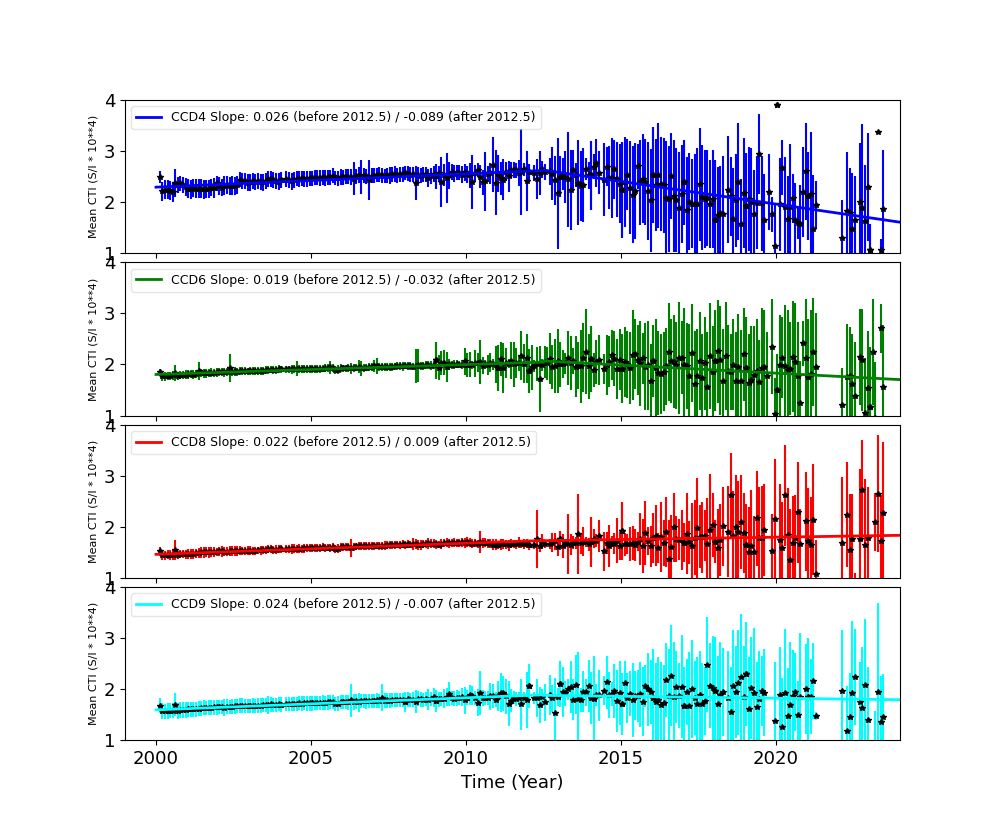
Backside CCDs
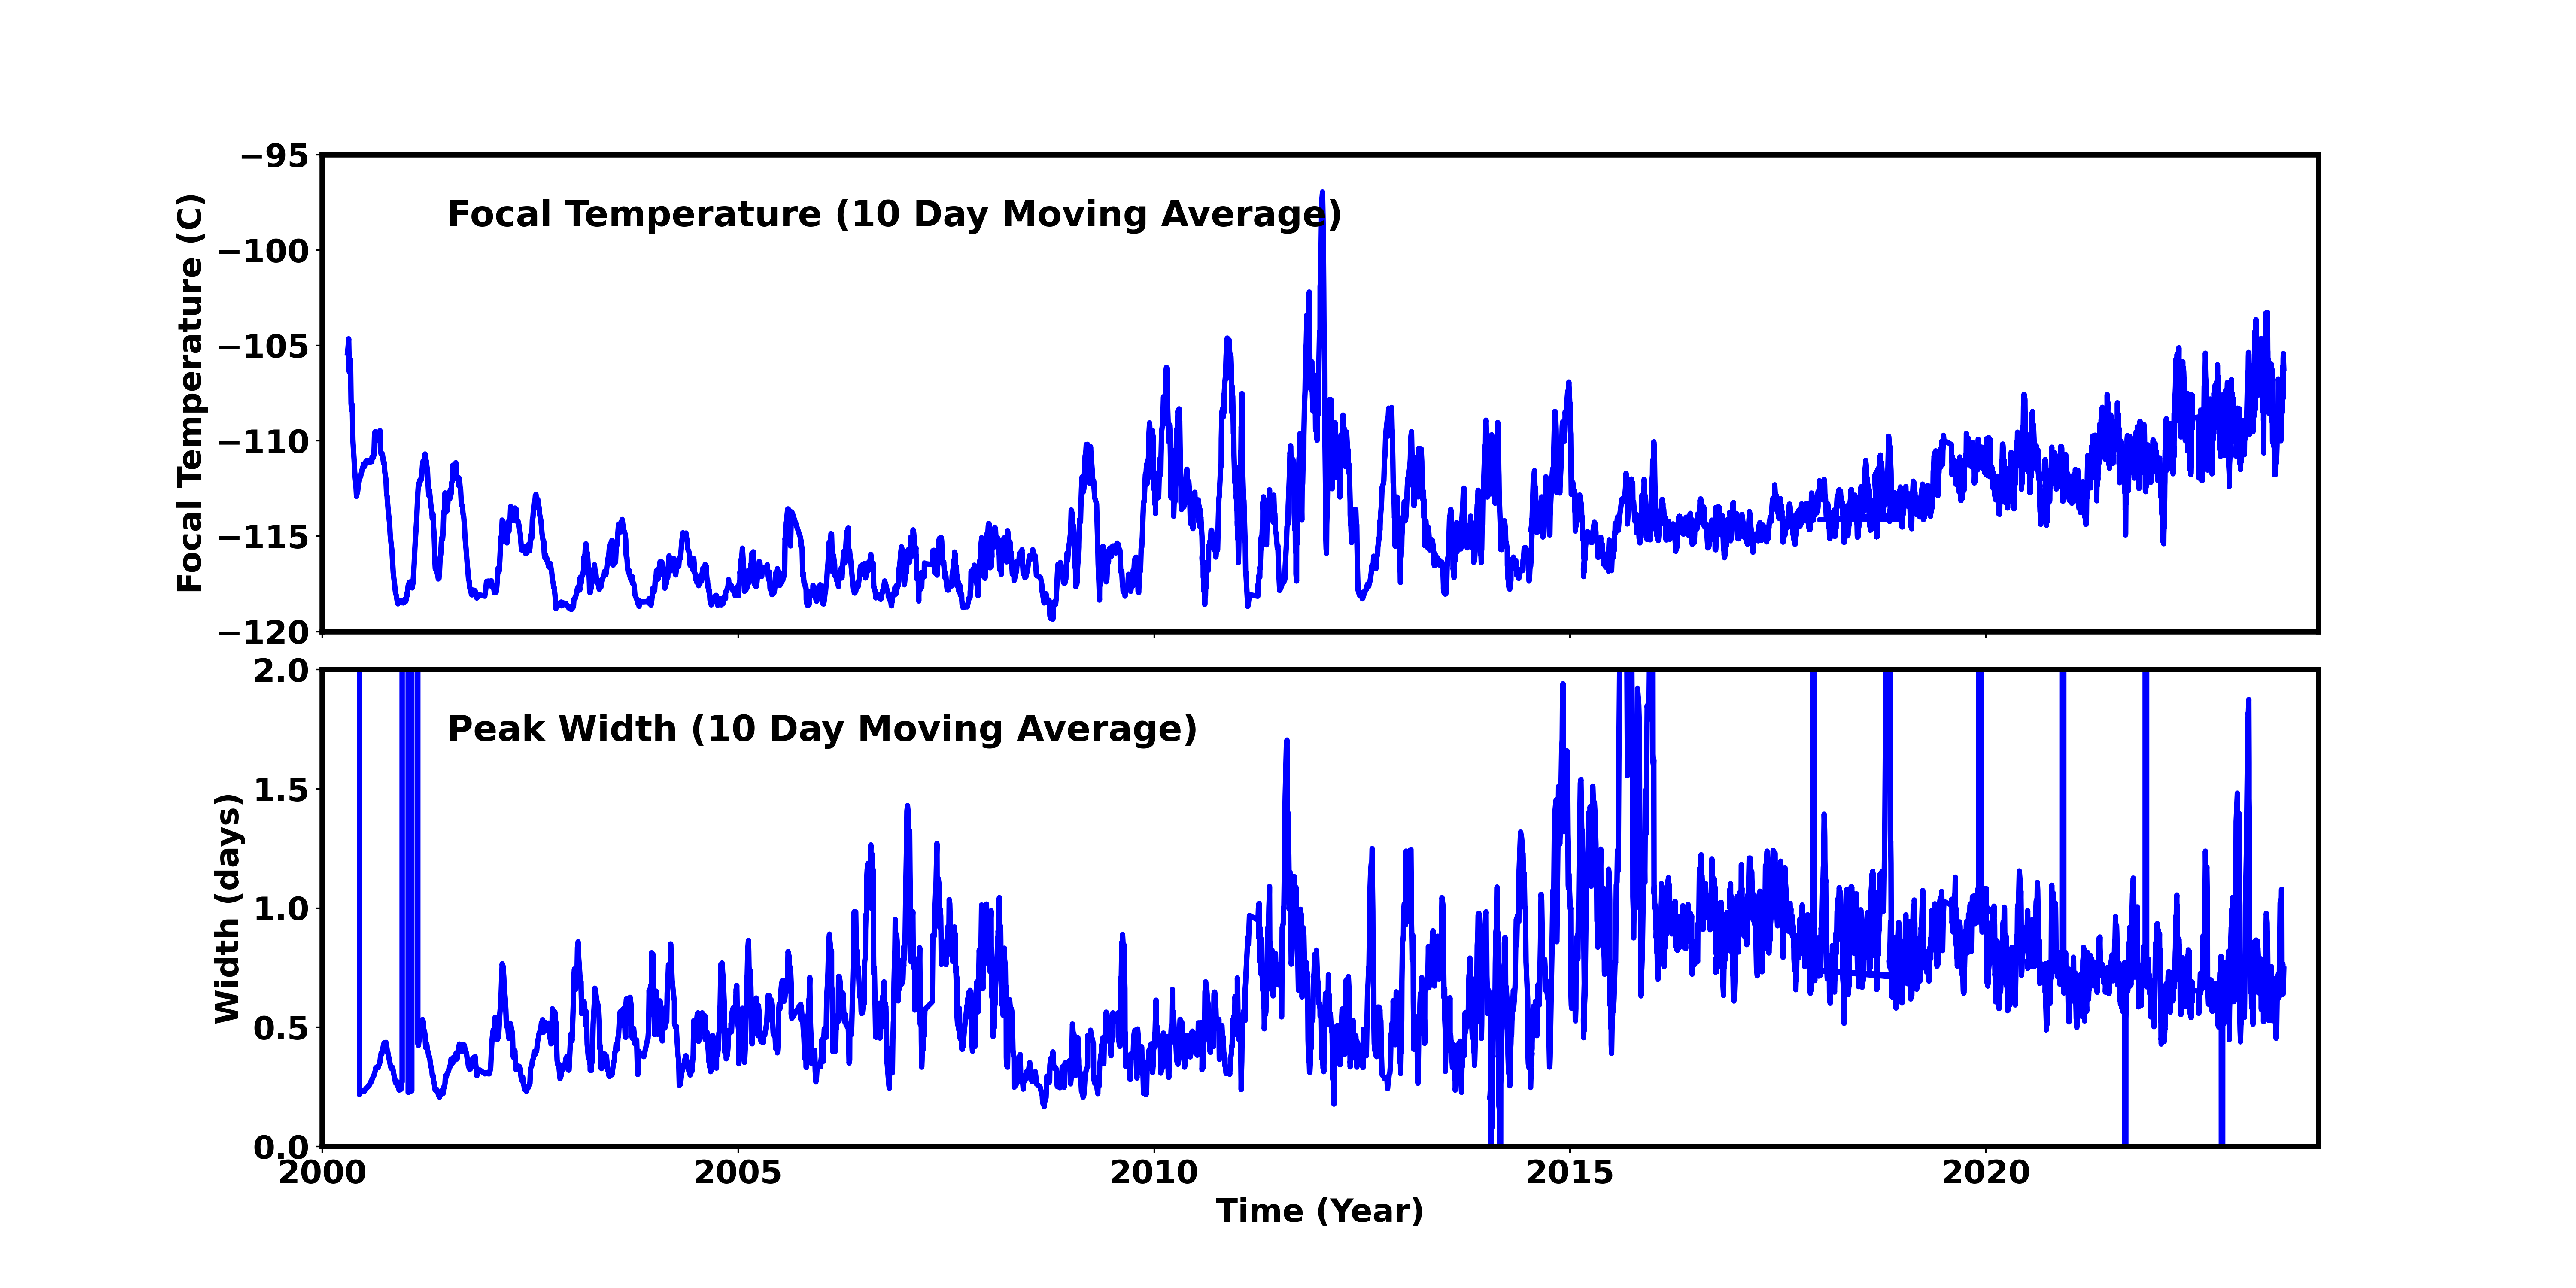
Focal Plane Temperature
Feb 2024 Focal Temperature
| The Mean (max) FPT: | |
|---|---|
| -107.53 | +/- 7.69 C |
| Mean Width: | |
| 0.8 | +/- 0.58 days |
Averaged Focal Plane Temperature
We are using 10 period moving averages to show trends of peak temperatures and peak widths. Note, the gaps in the width plot are due to missing/corrupted data.
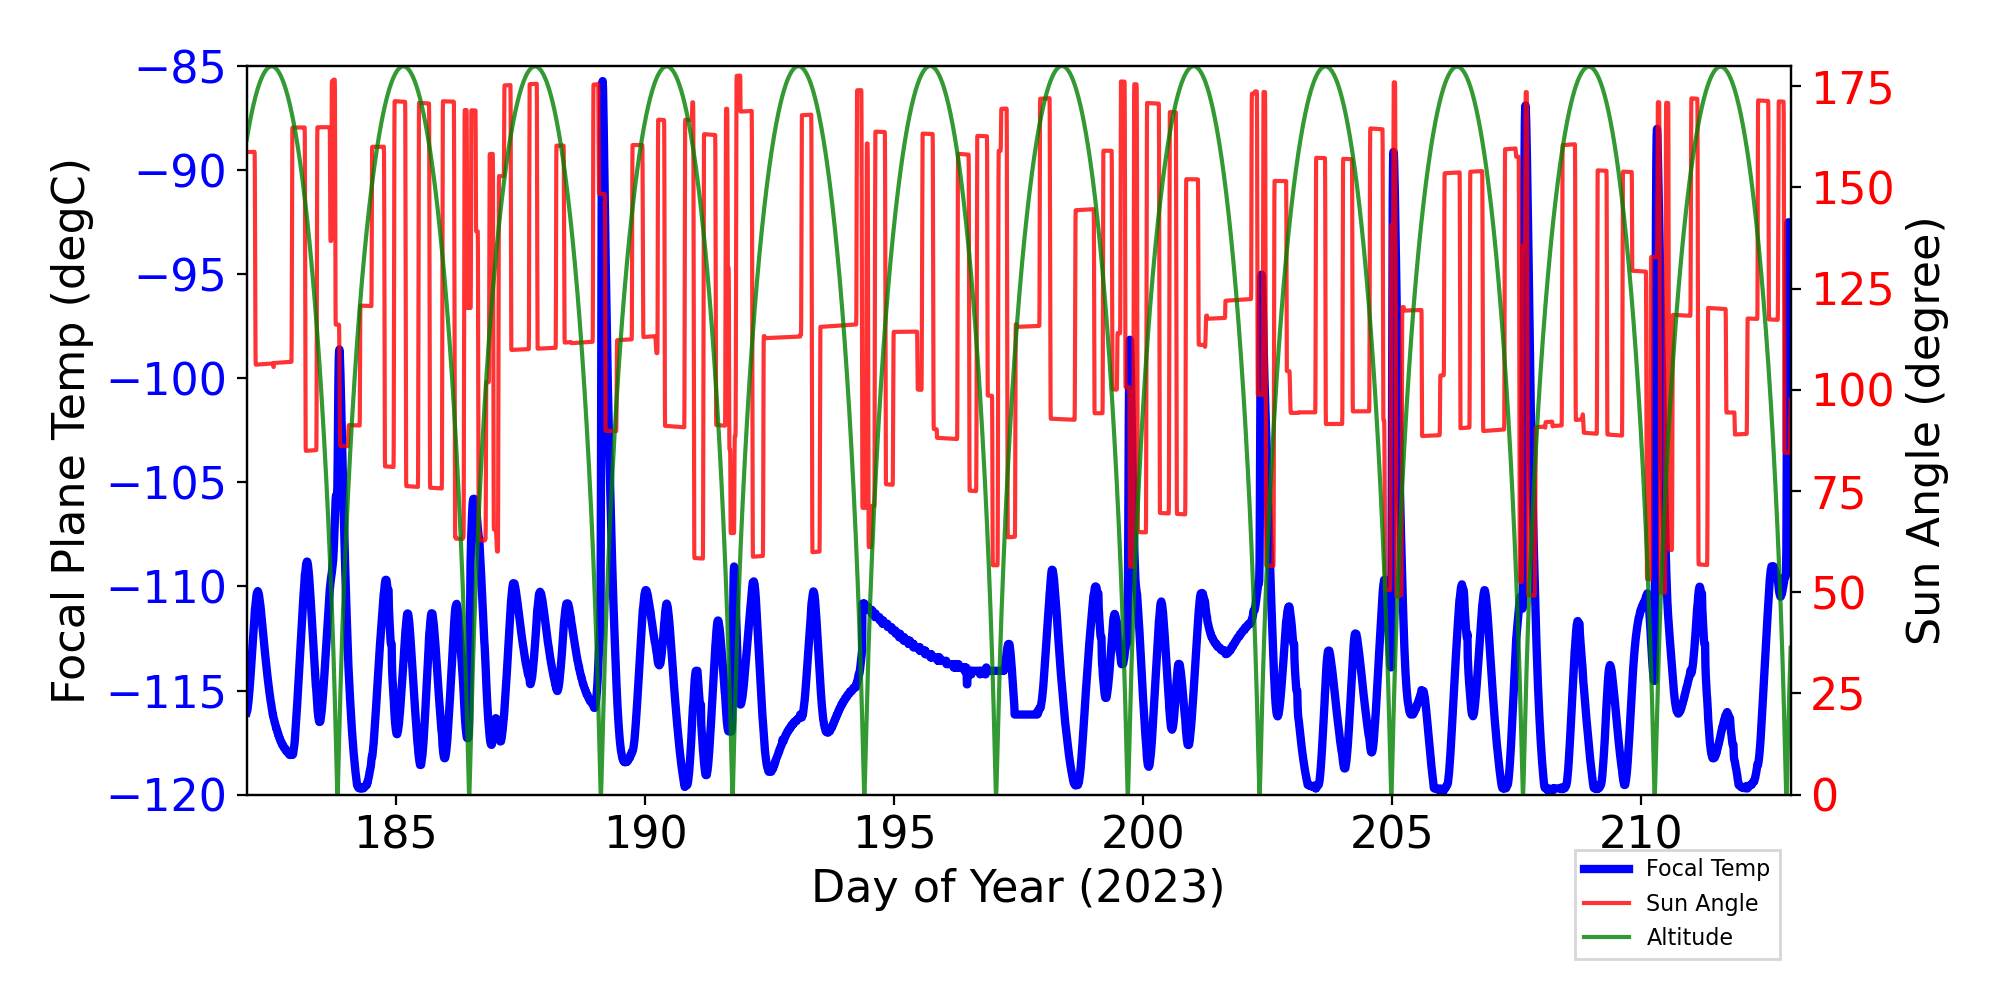
Focal Plane Temperature, Sun Angle and Altitude
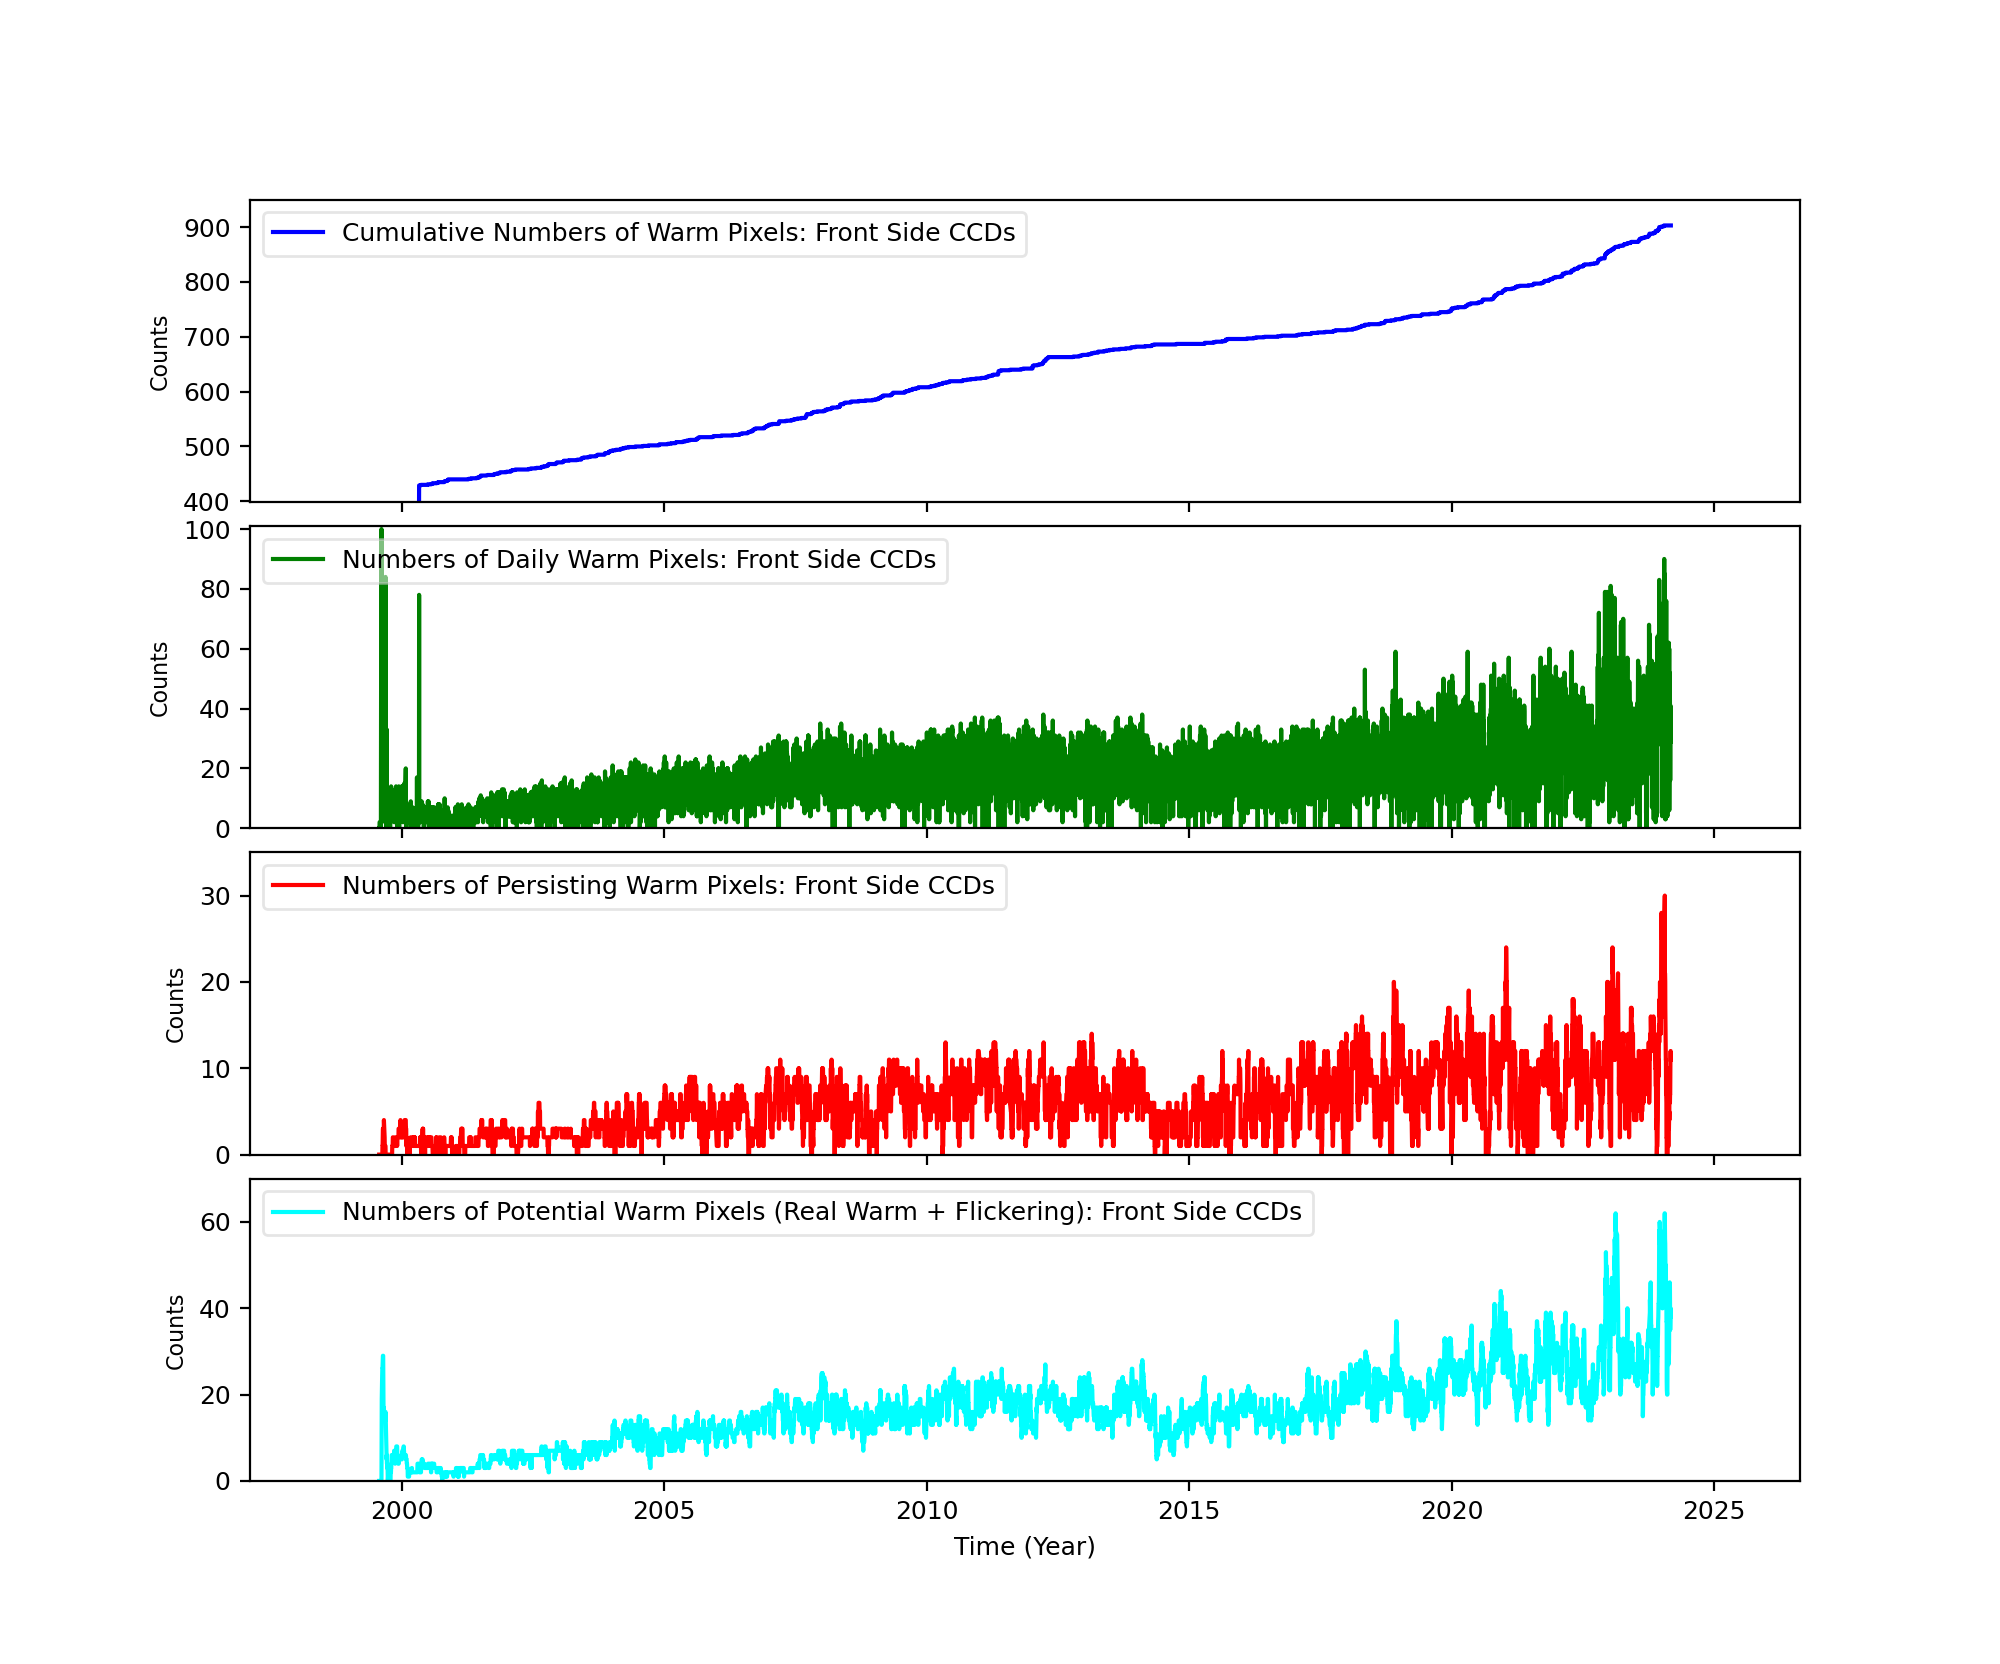
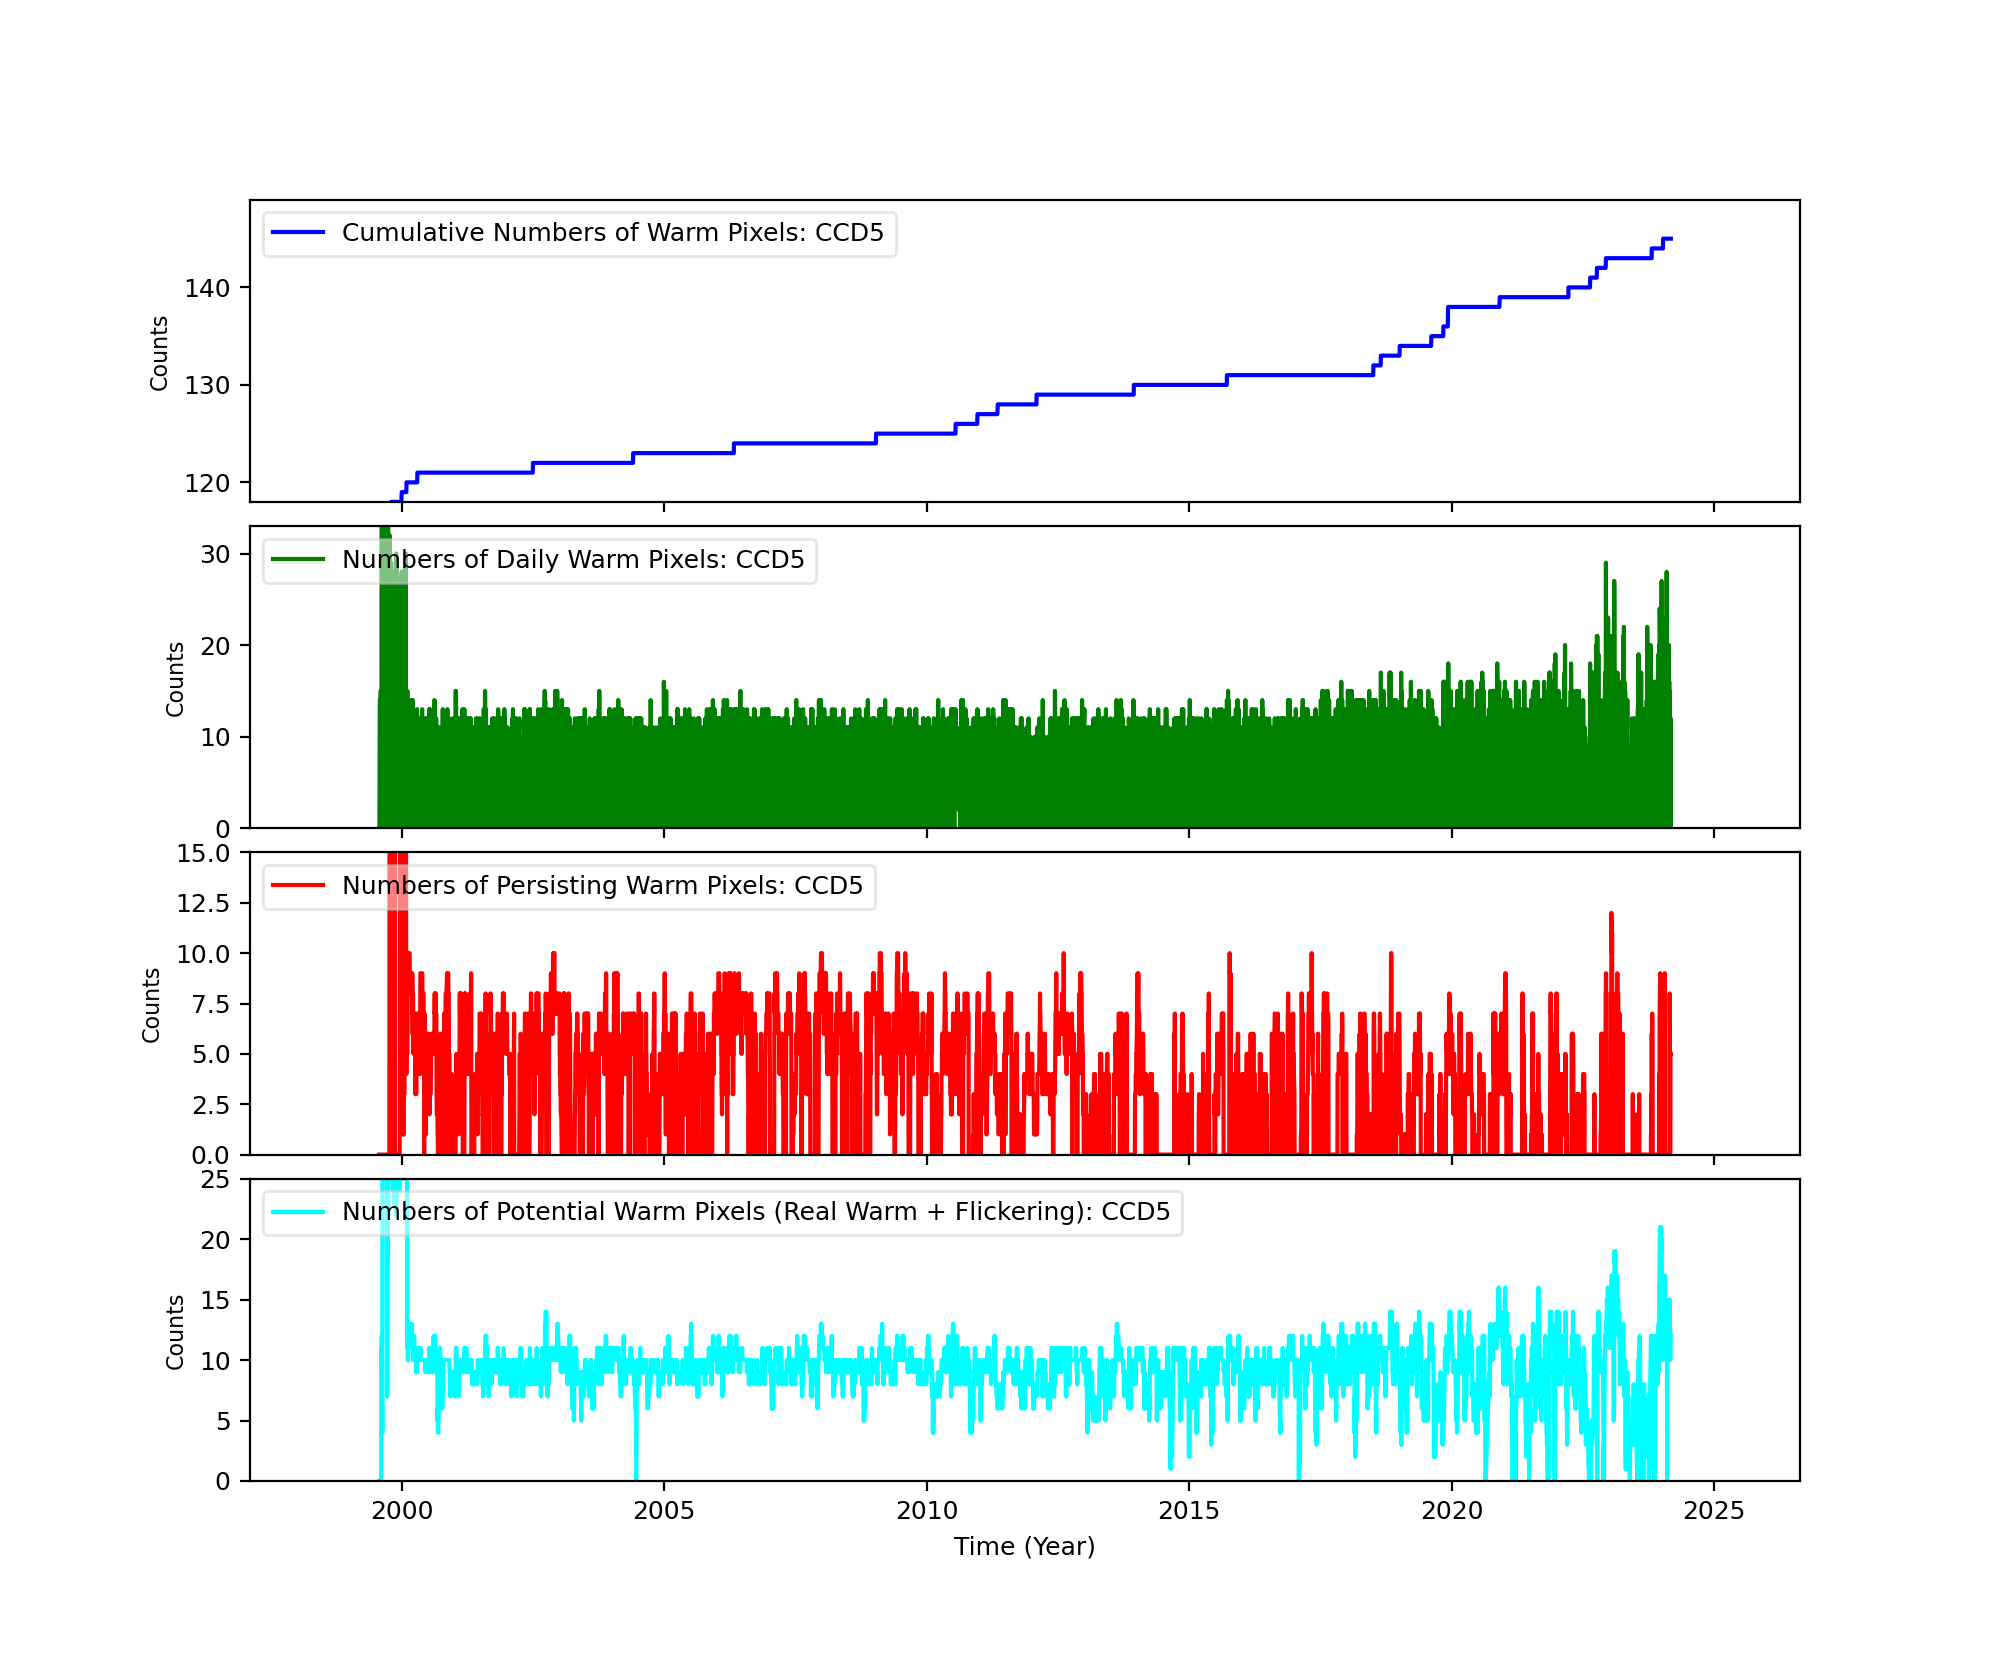
Bad Pixels
The plots below were generated with a new warm pixel finding script. Please see Acis Bad Pixel Page for details.
Front Side CCDs
Back Side CCD (CCD5)
Science Instrument Background Rates
| Name | Low (keV) | High(KeV) | Description |
|---|---|---|---|
| SSoft | 0.00 | 0.50 | Super soft photons |
| Soft | 0.50 | 1.00 | Soft photons |
| Med | 1.00 | 3.00 | Moderate energy photons |
| Hard | 3.00 | 5.00 | Hard Photons |
| Harder | 5.00 | 10.00 | Very Hard photons |
| Hardest | 10.00 | Beyond 10 keV |


HRC
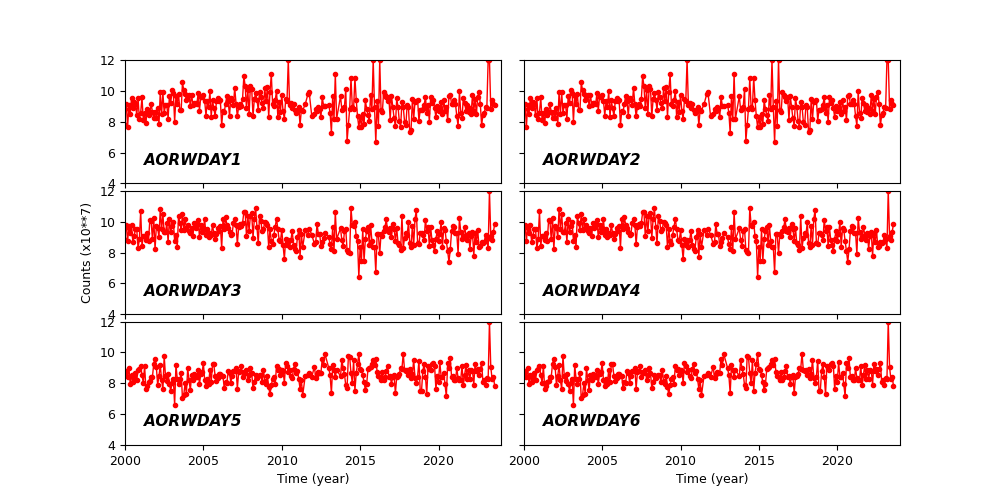
DOSE of Central 4K Pore-Pairs
Please refer to Maximum Dose Trends for more details.
)
|
|---|
IMAGE                NPIX      MEAN    STDDEV      MIN       MAX
HRCI_02_2024.fits  16777216	0.018 	0.135 	0.000 	6.000
)
IMAGE                       NPIX      MEAN    STDDEV      MIN       MAX
HRCI_08_1999_02_2024.fits  16777216	na	na	na	na
No Data
)
IMAGE                       NPIX      MEAN    STDDEV      MIN       MAX
HRCS_08_1999_02_2024.fits  16777216	na	na	na	na
|
|
Max dose trend plots corrected for events that "pile-up"
in the center of the taps due to bad position information.
|
)
|
)
|
)
|
)
|
| Nov 2023 | Aug 2023 | May 2023 | Feb 2023 |
|---|
)
|
)
|
)
|
)
|
| Nov 2023 | Aug 2023 | May 2023 | Feb 2023 |
|---|
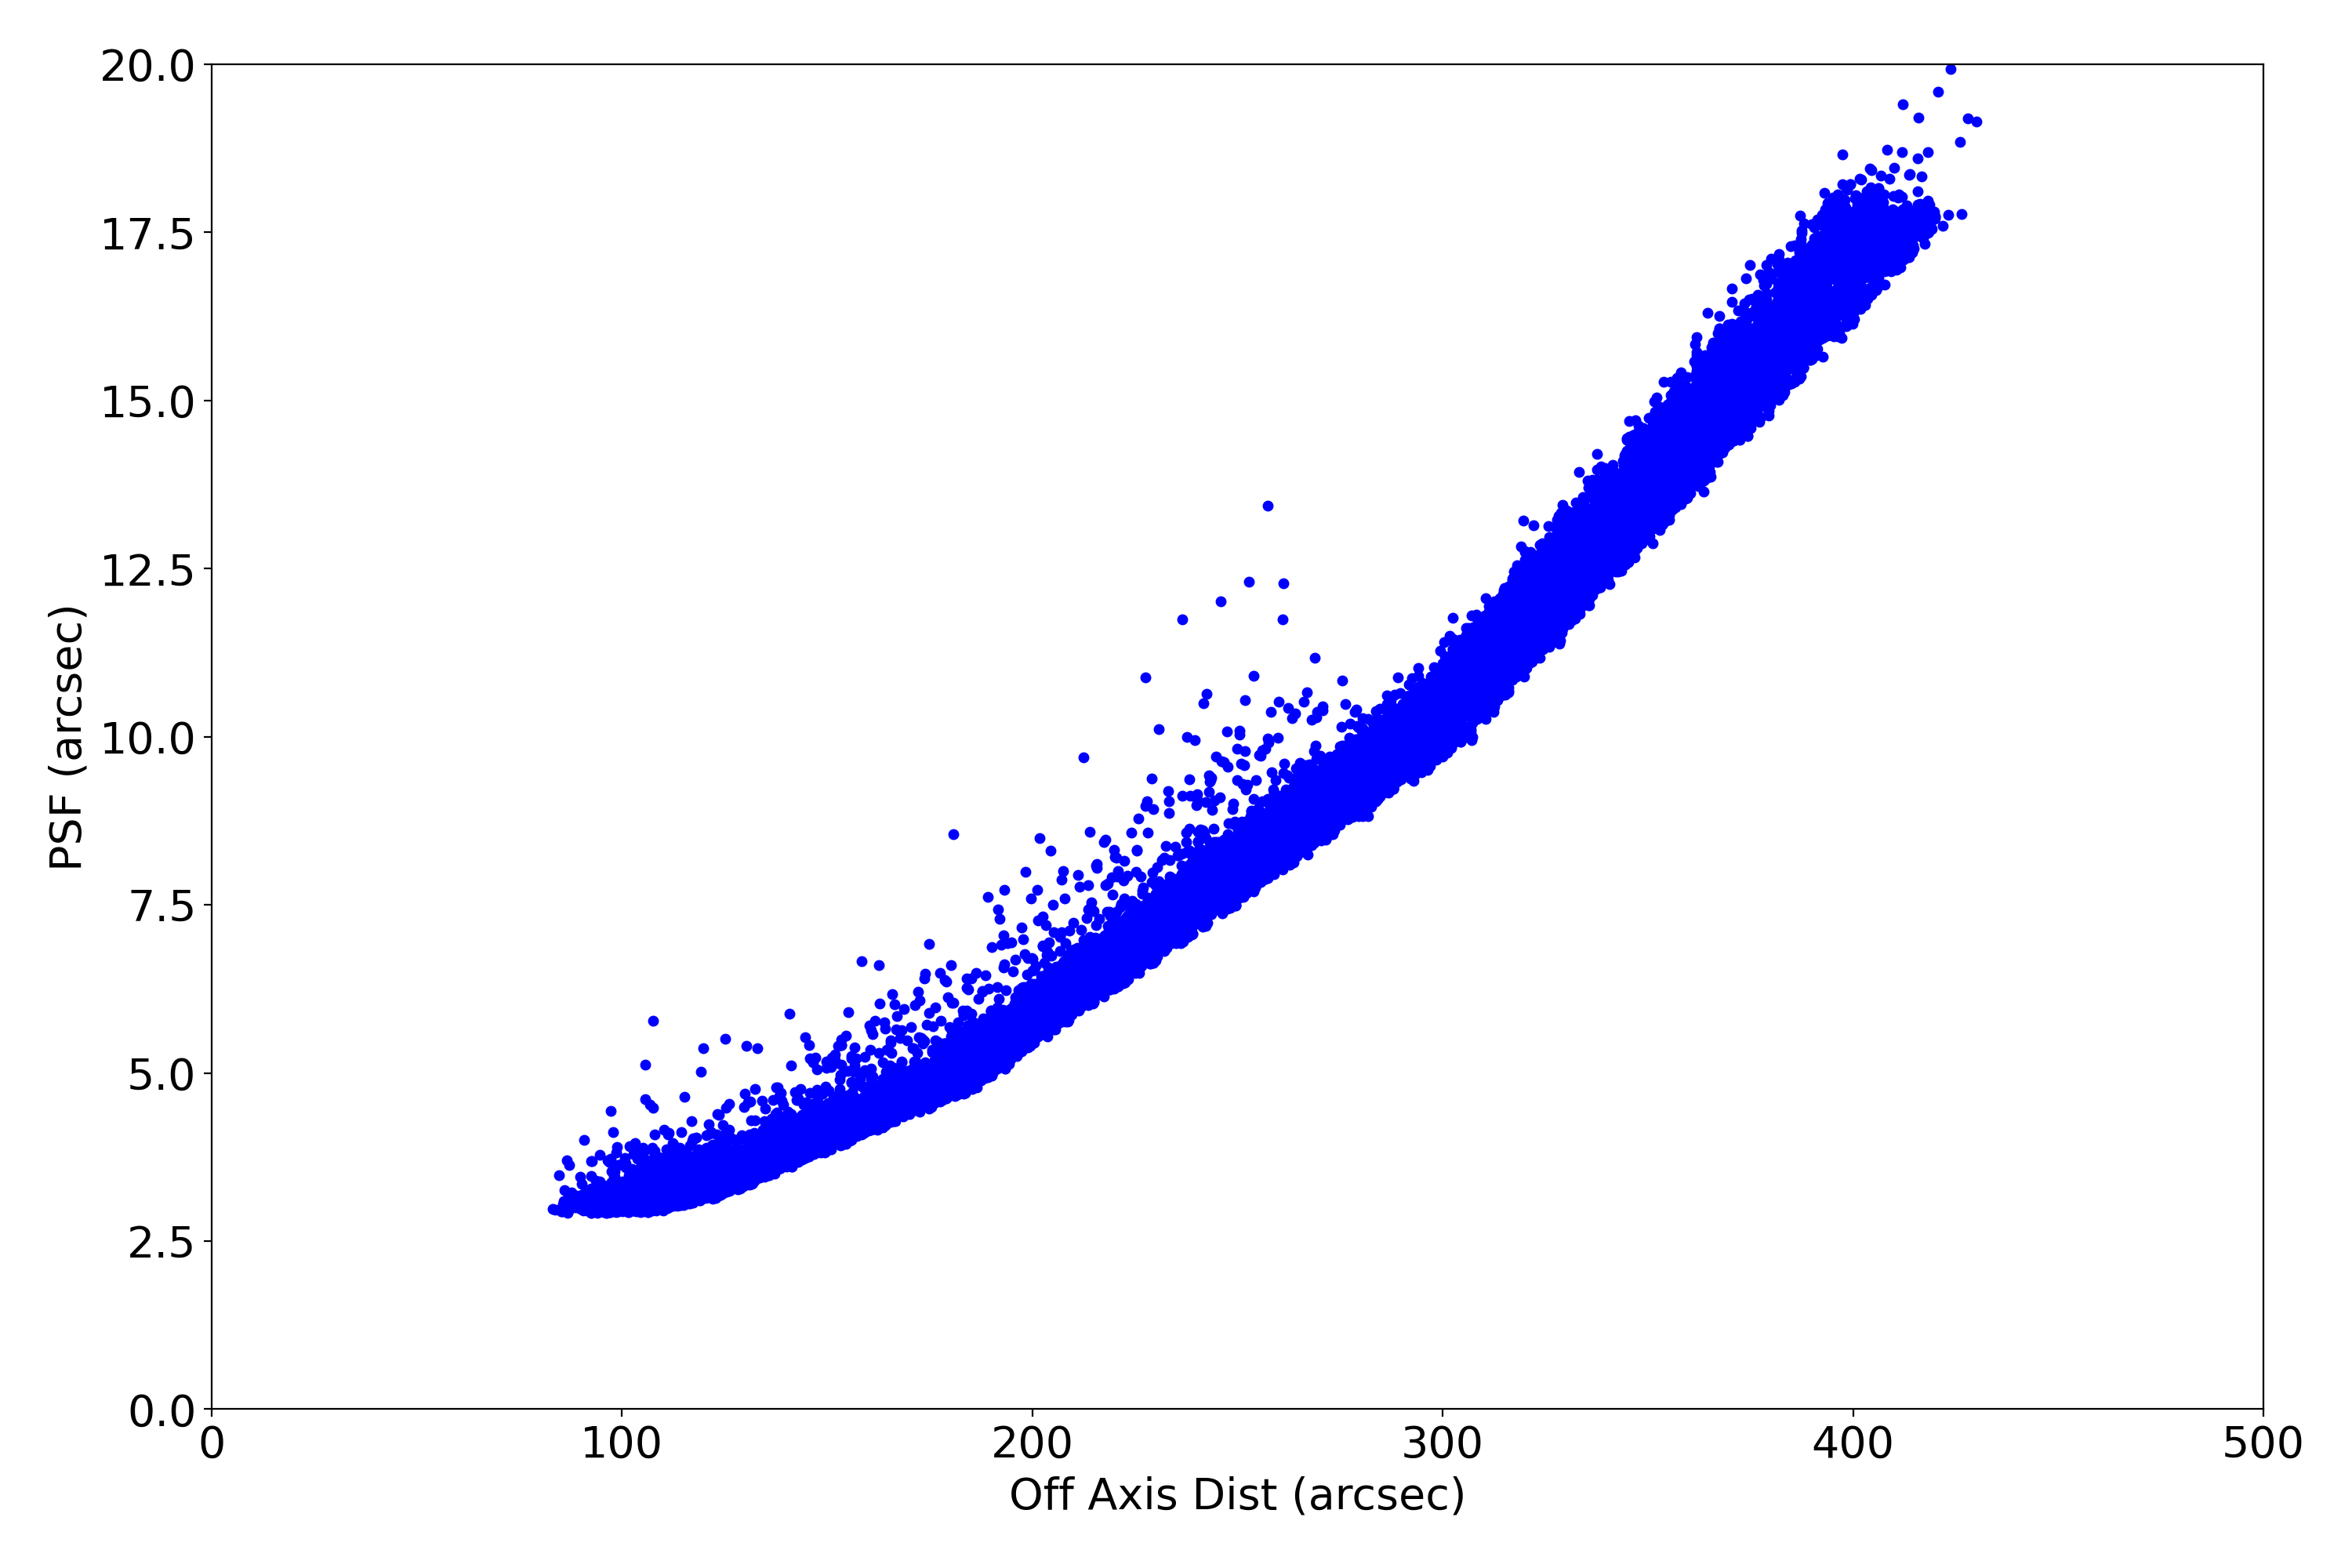
HRMA Focus
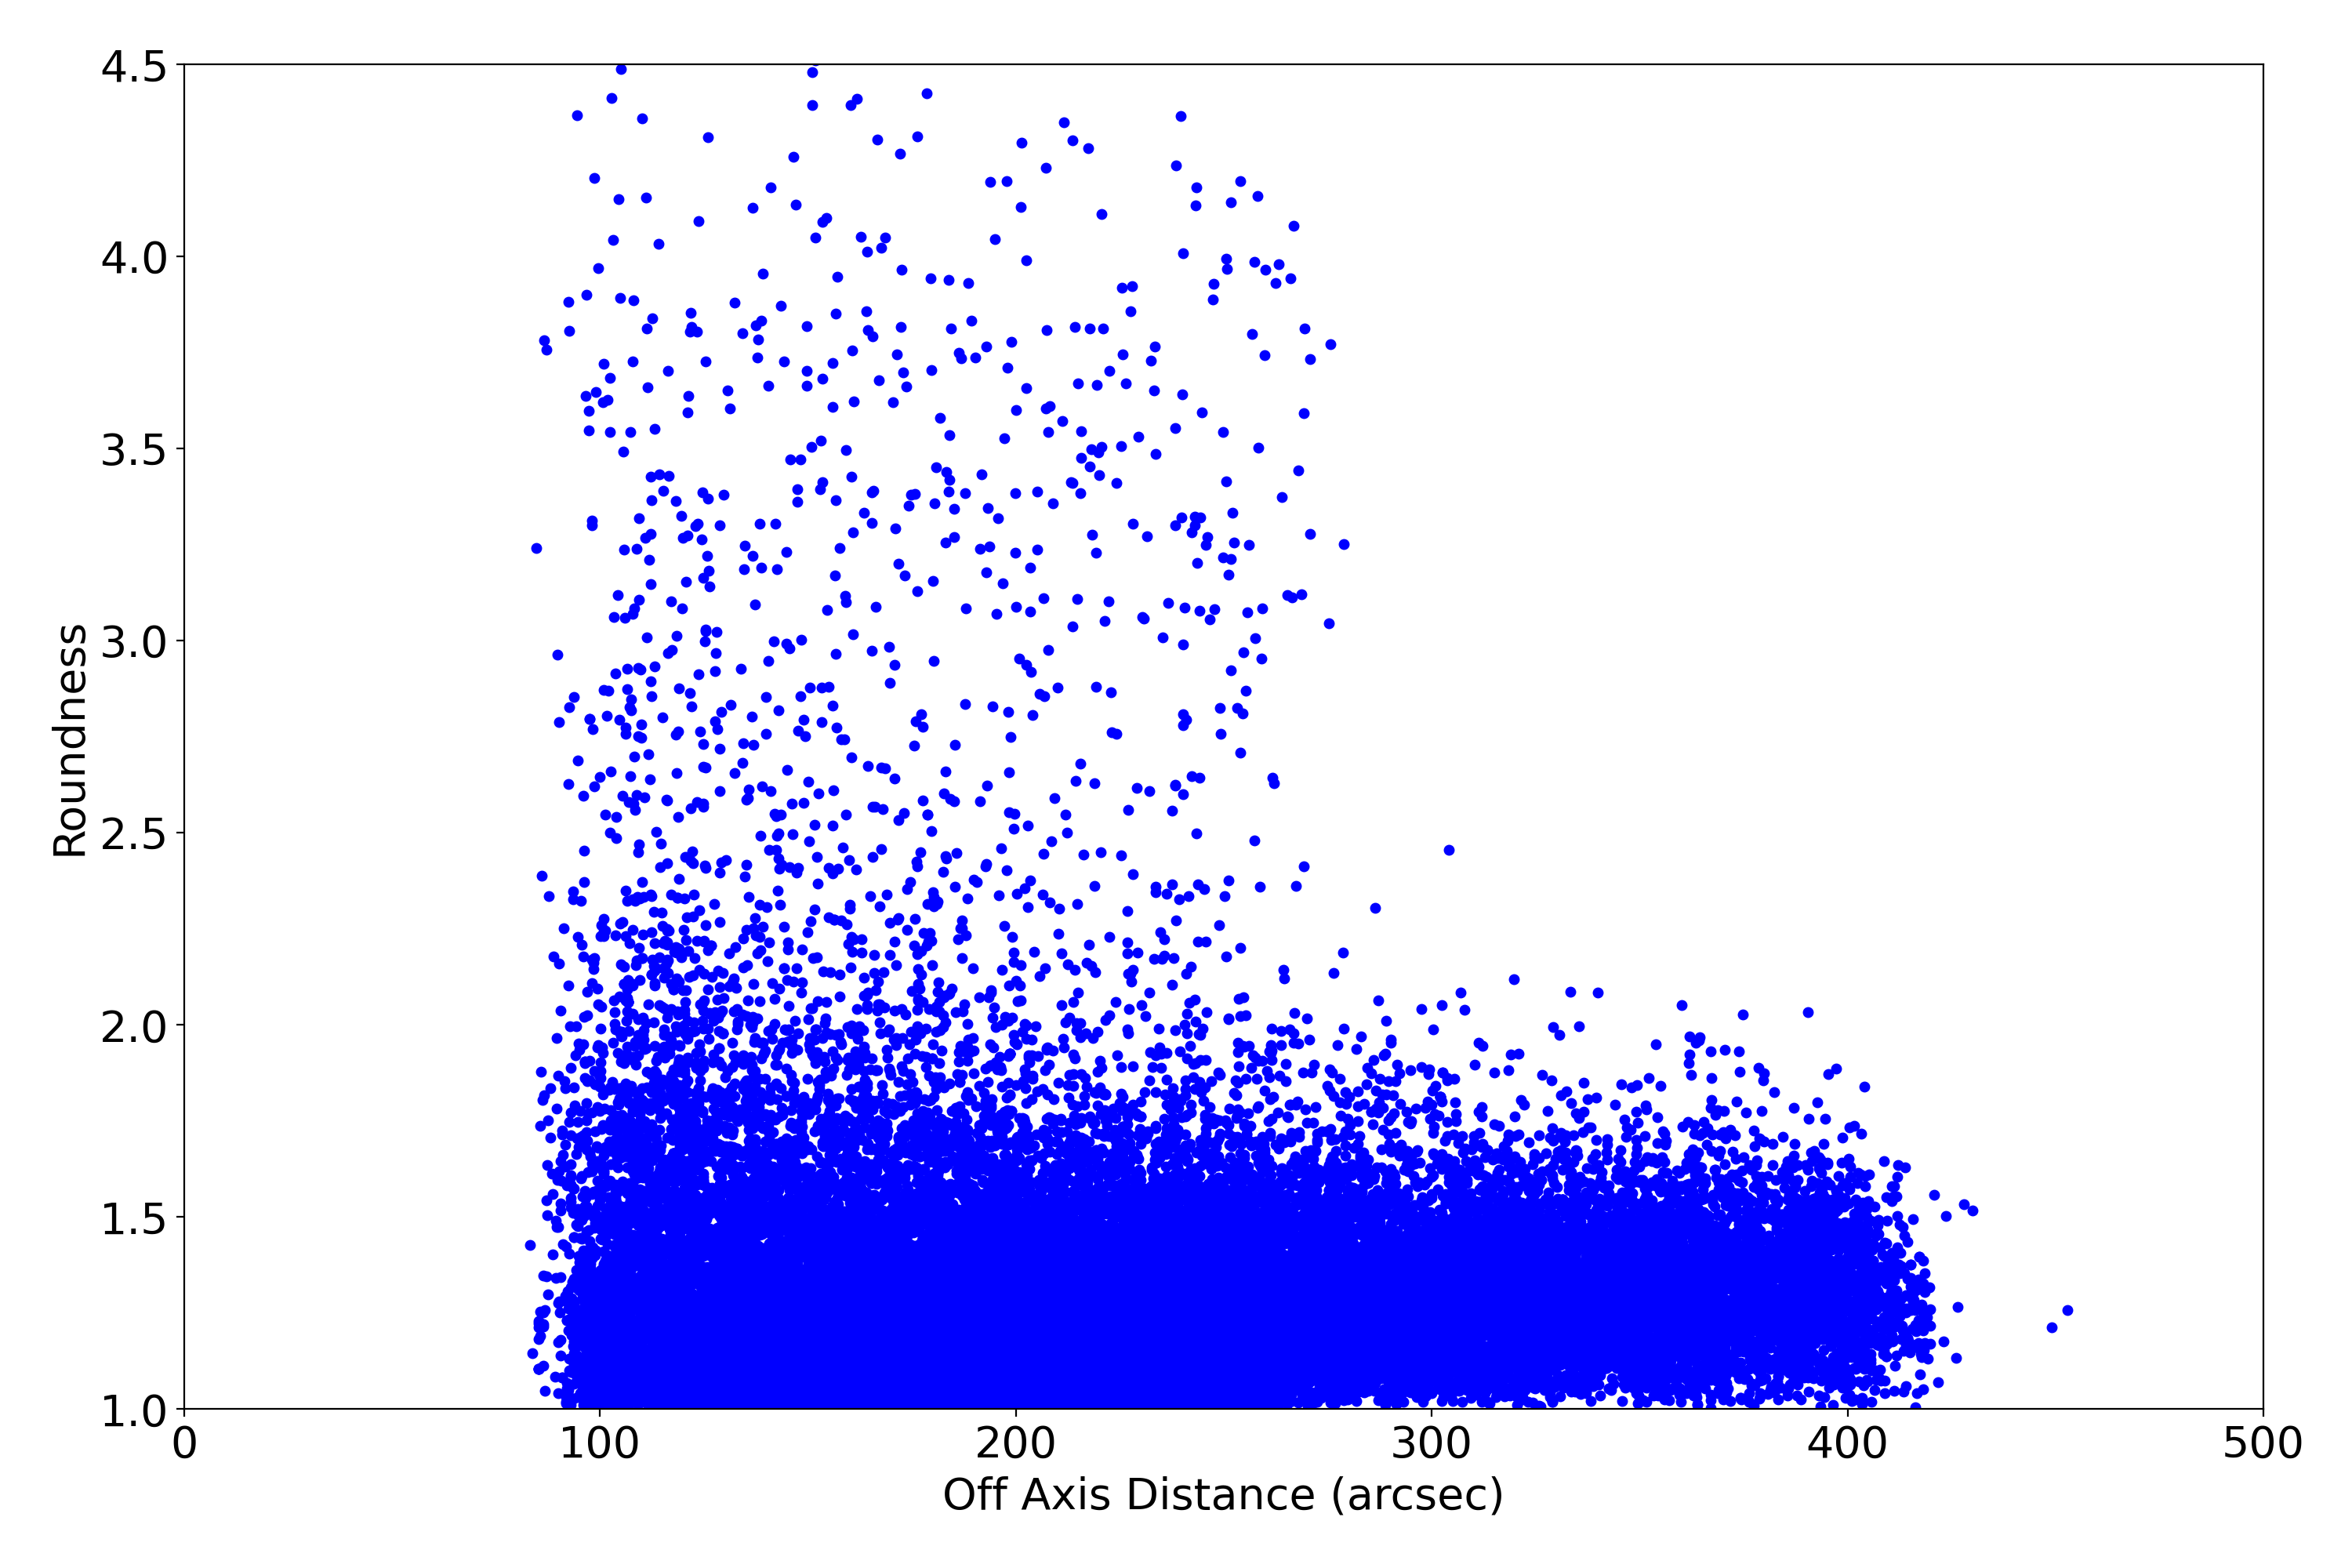
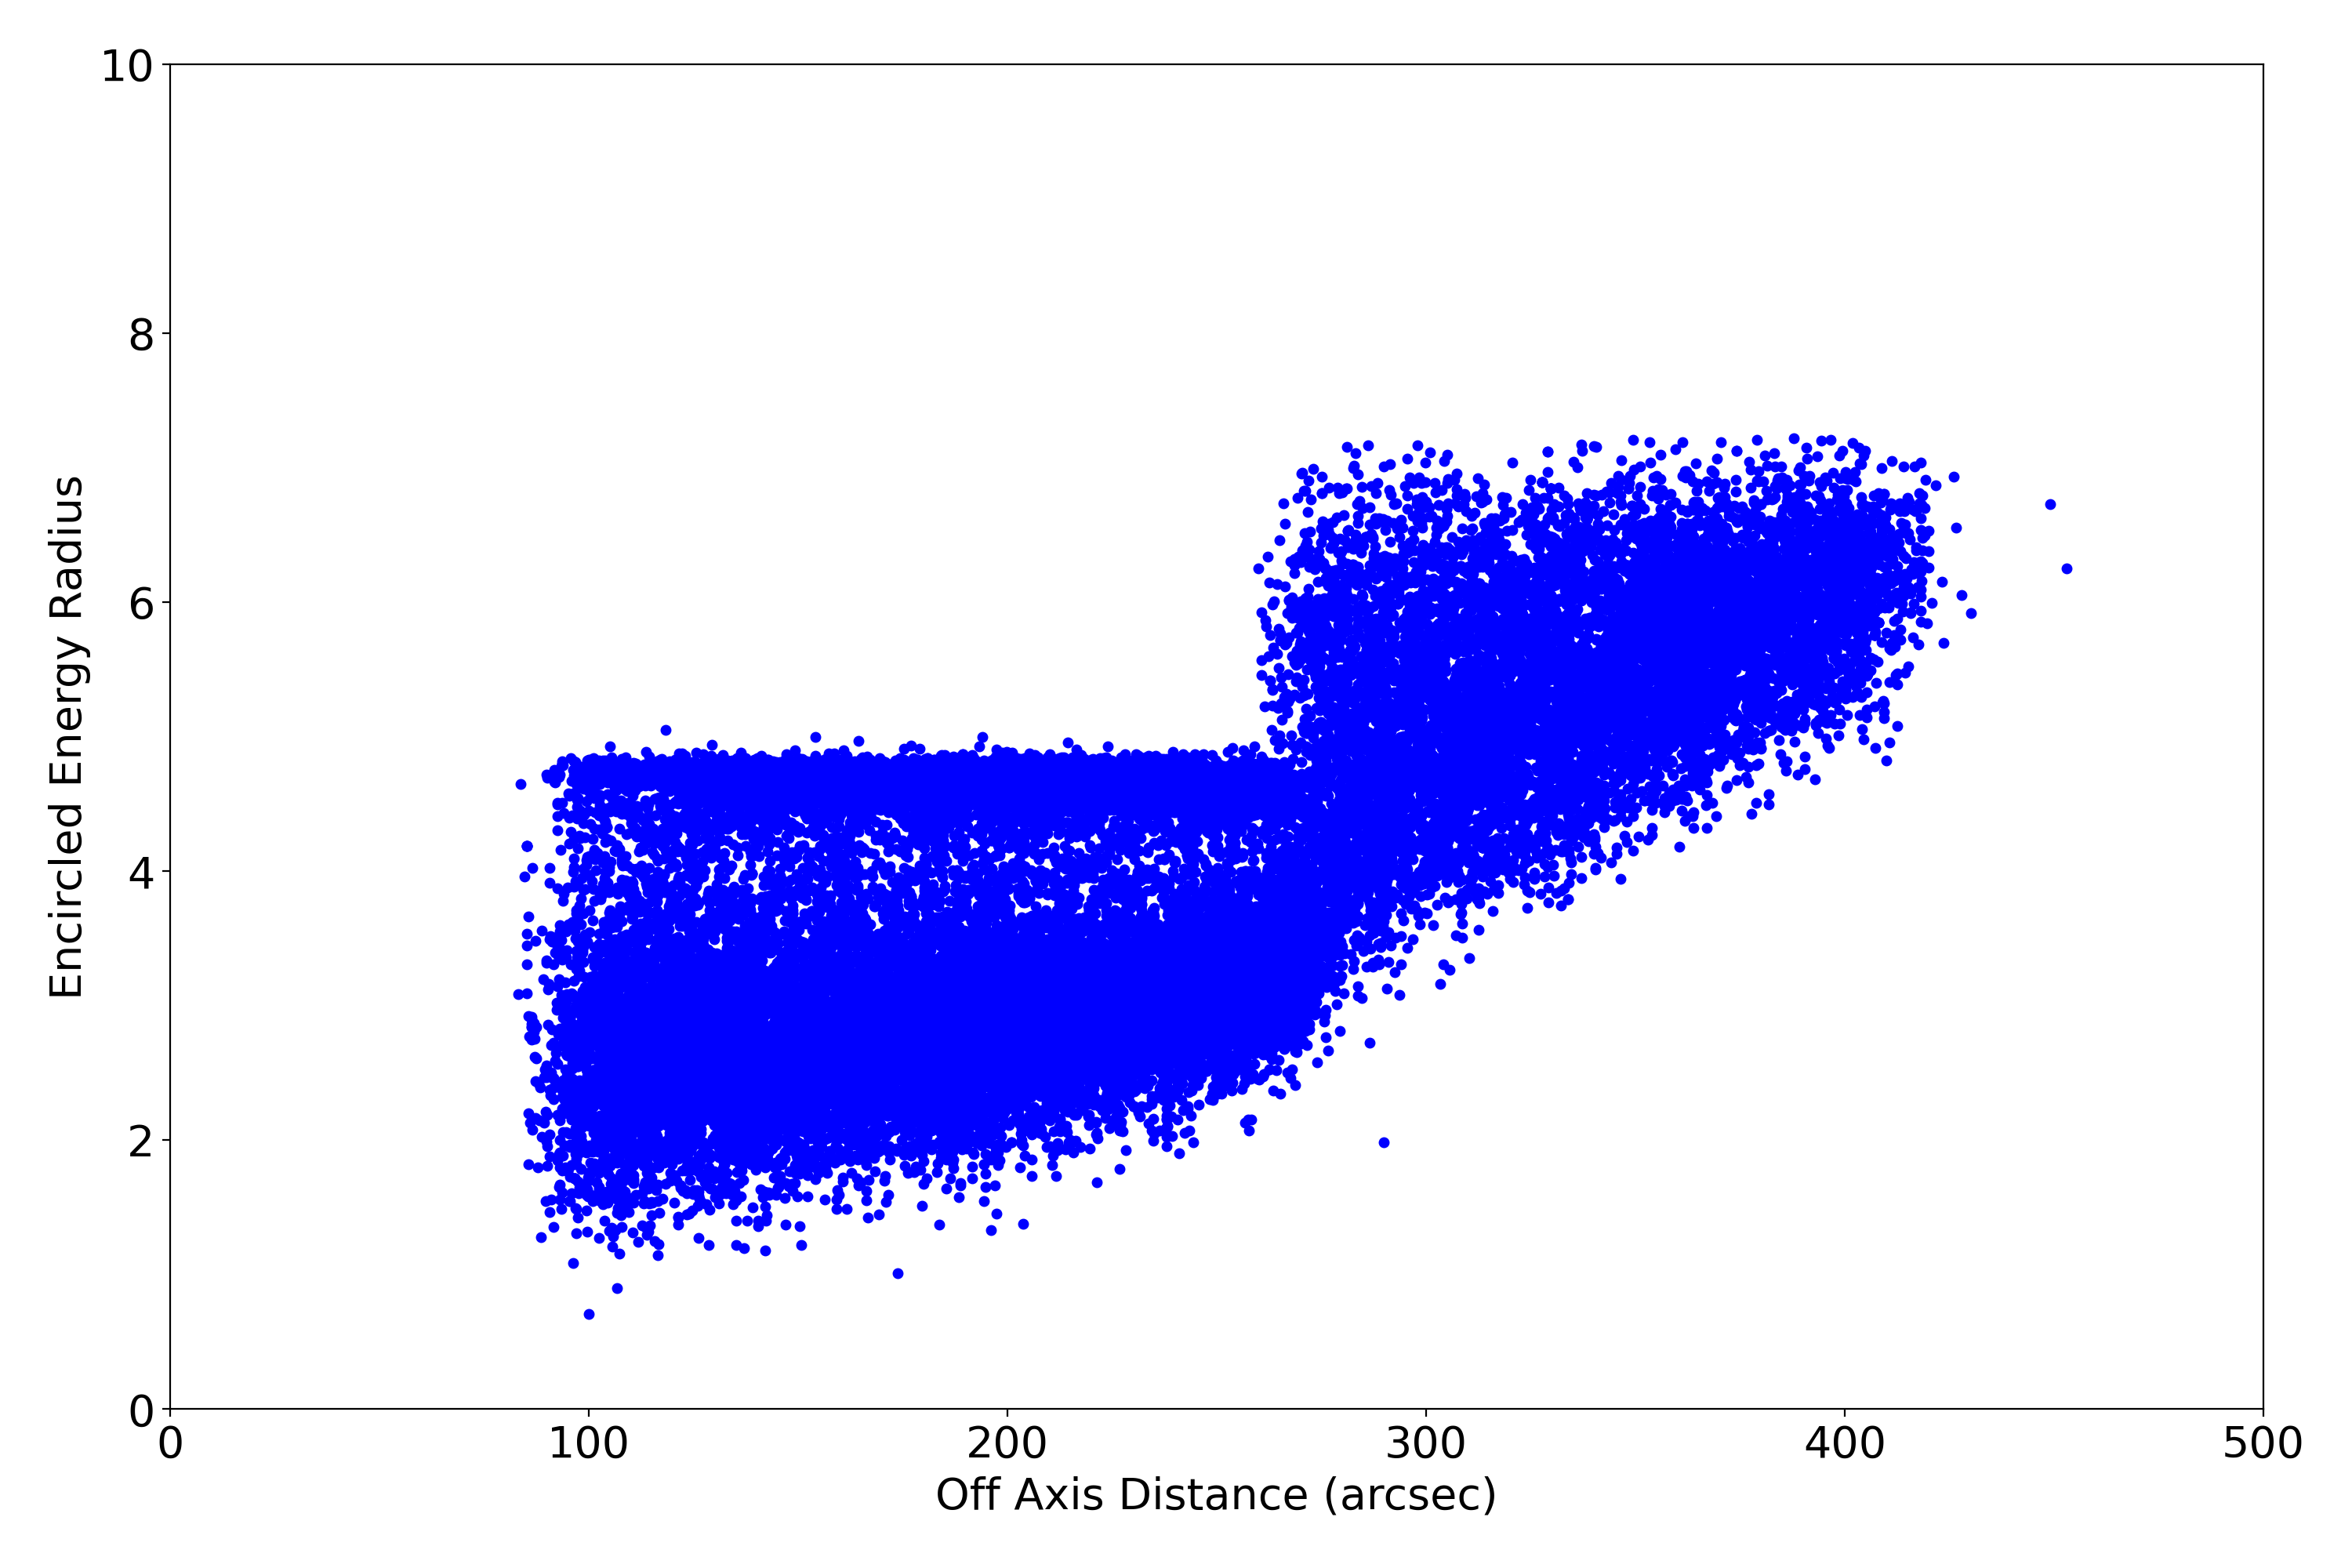
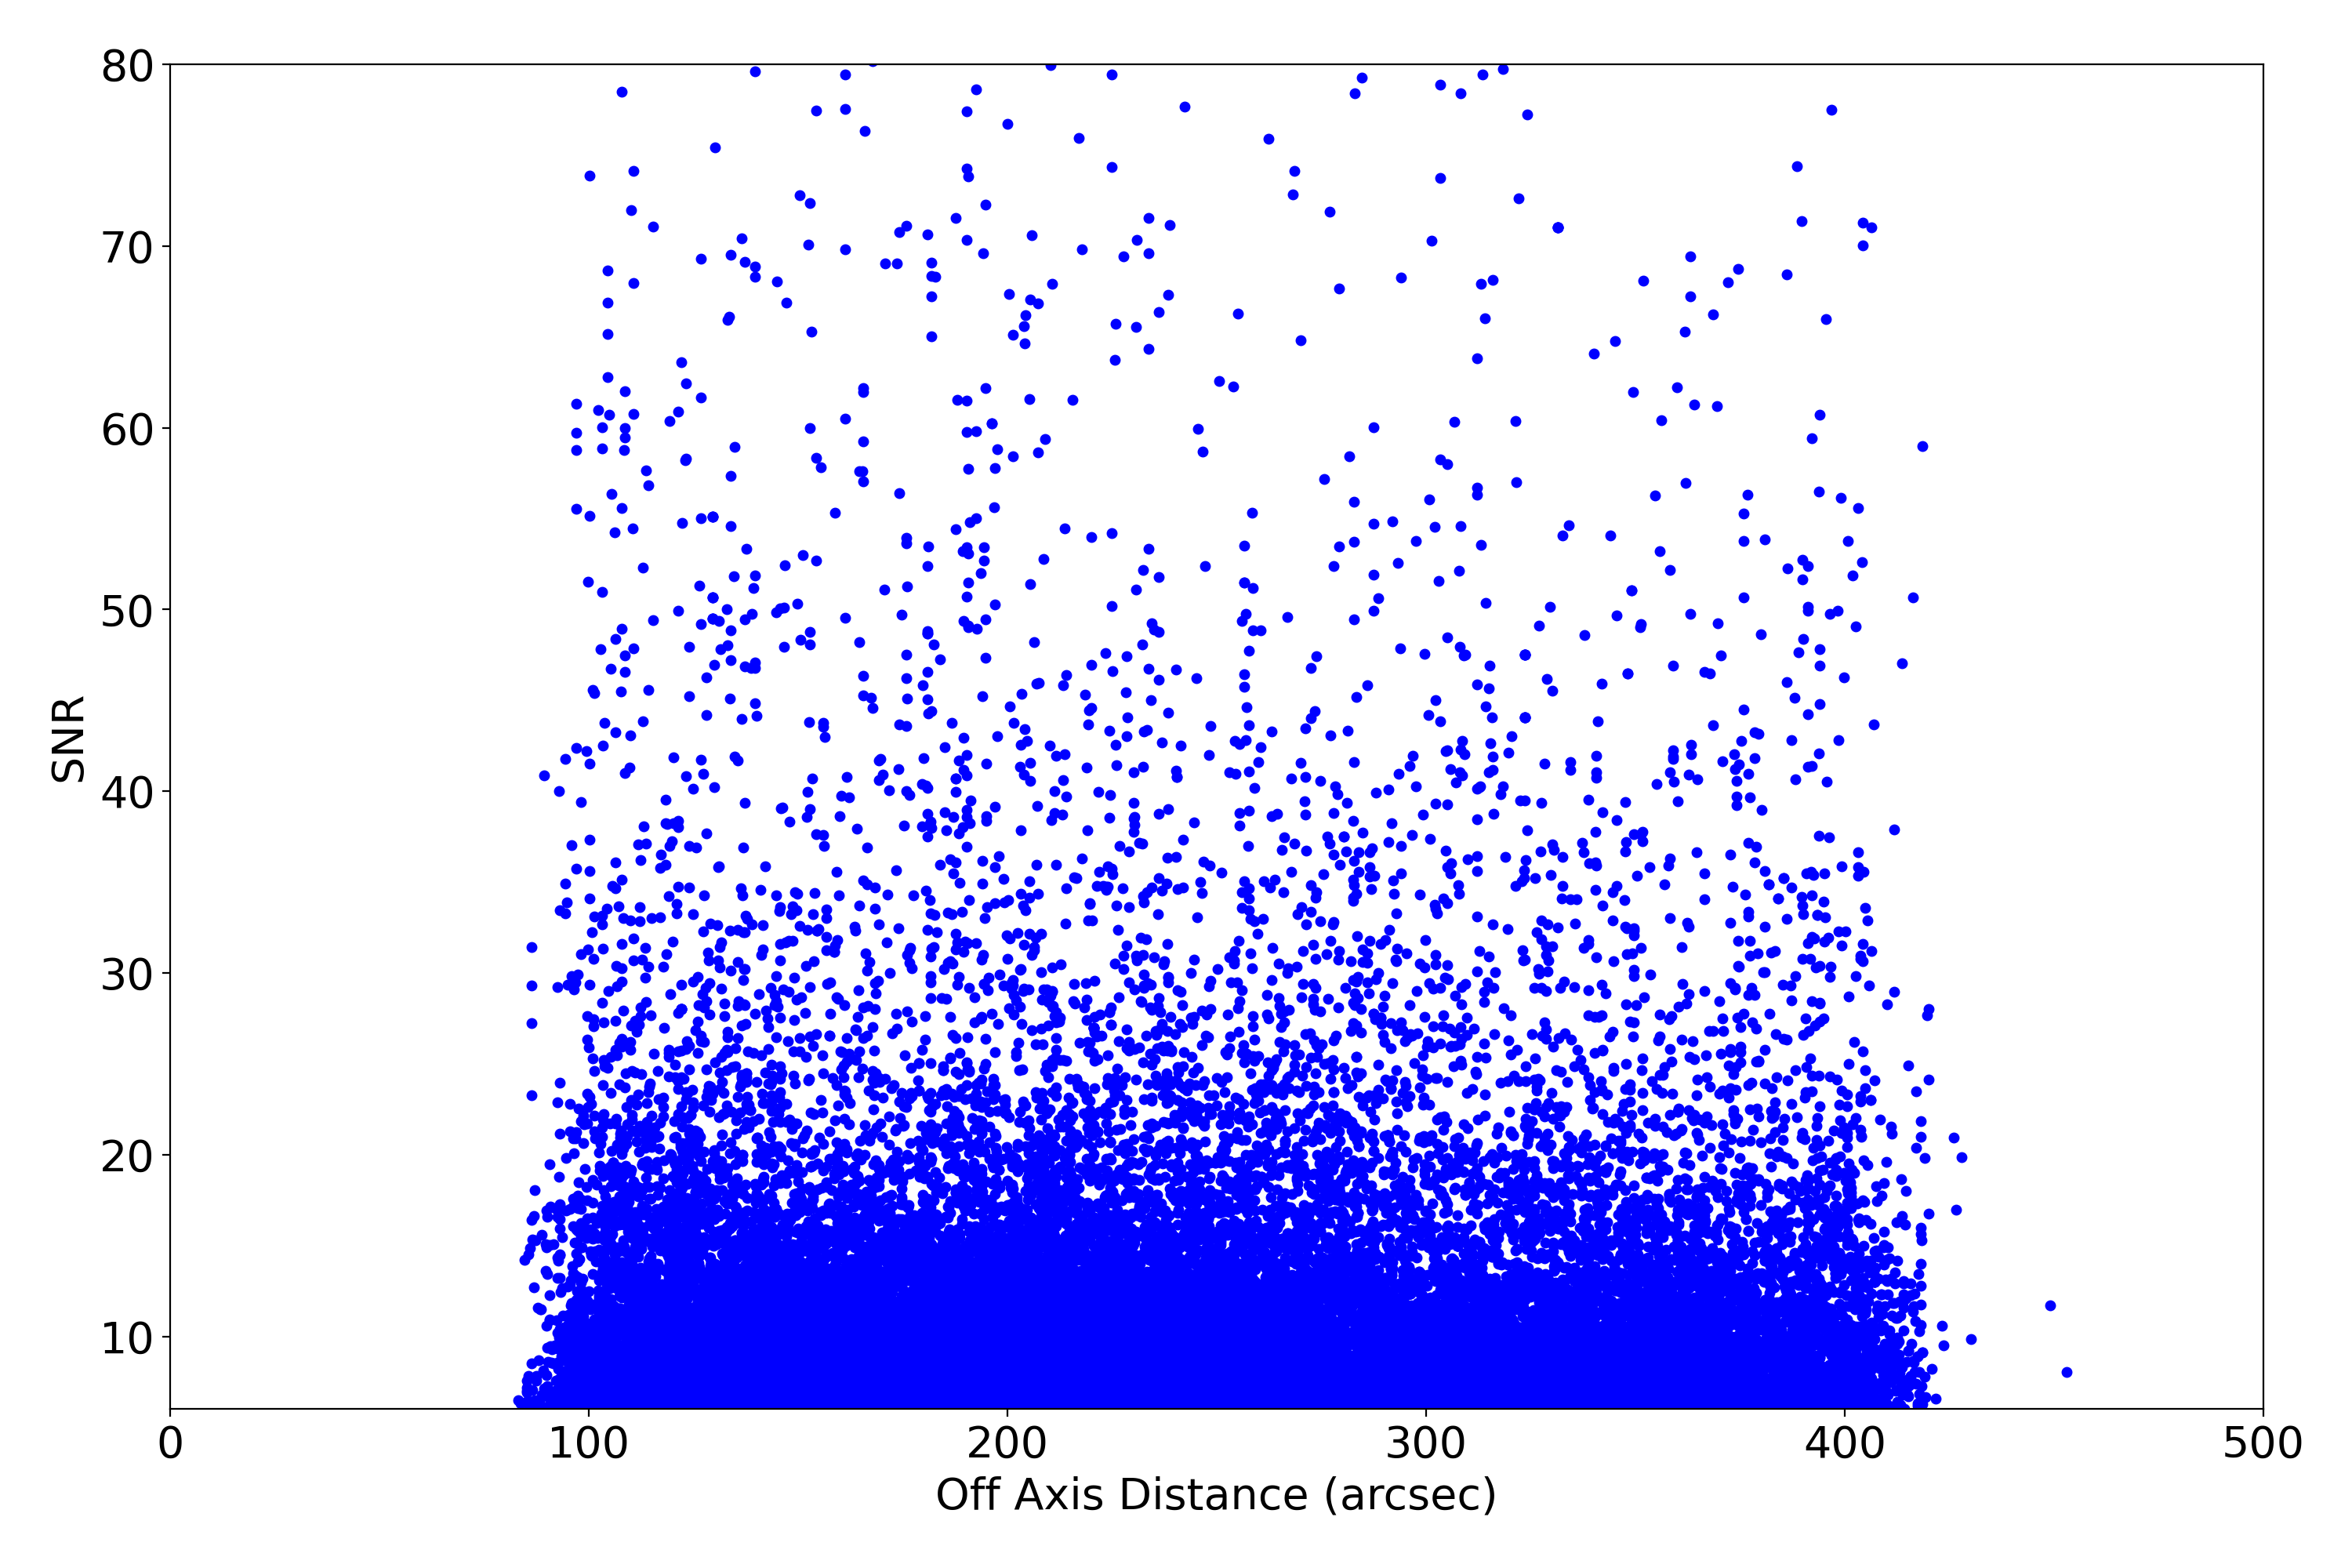
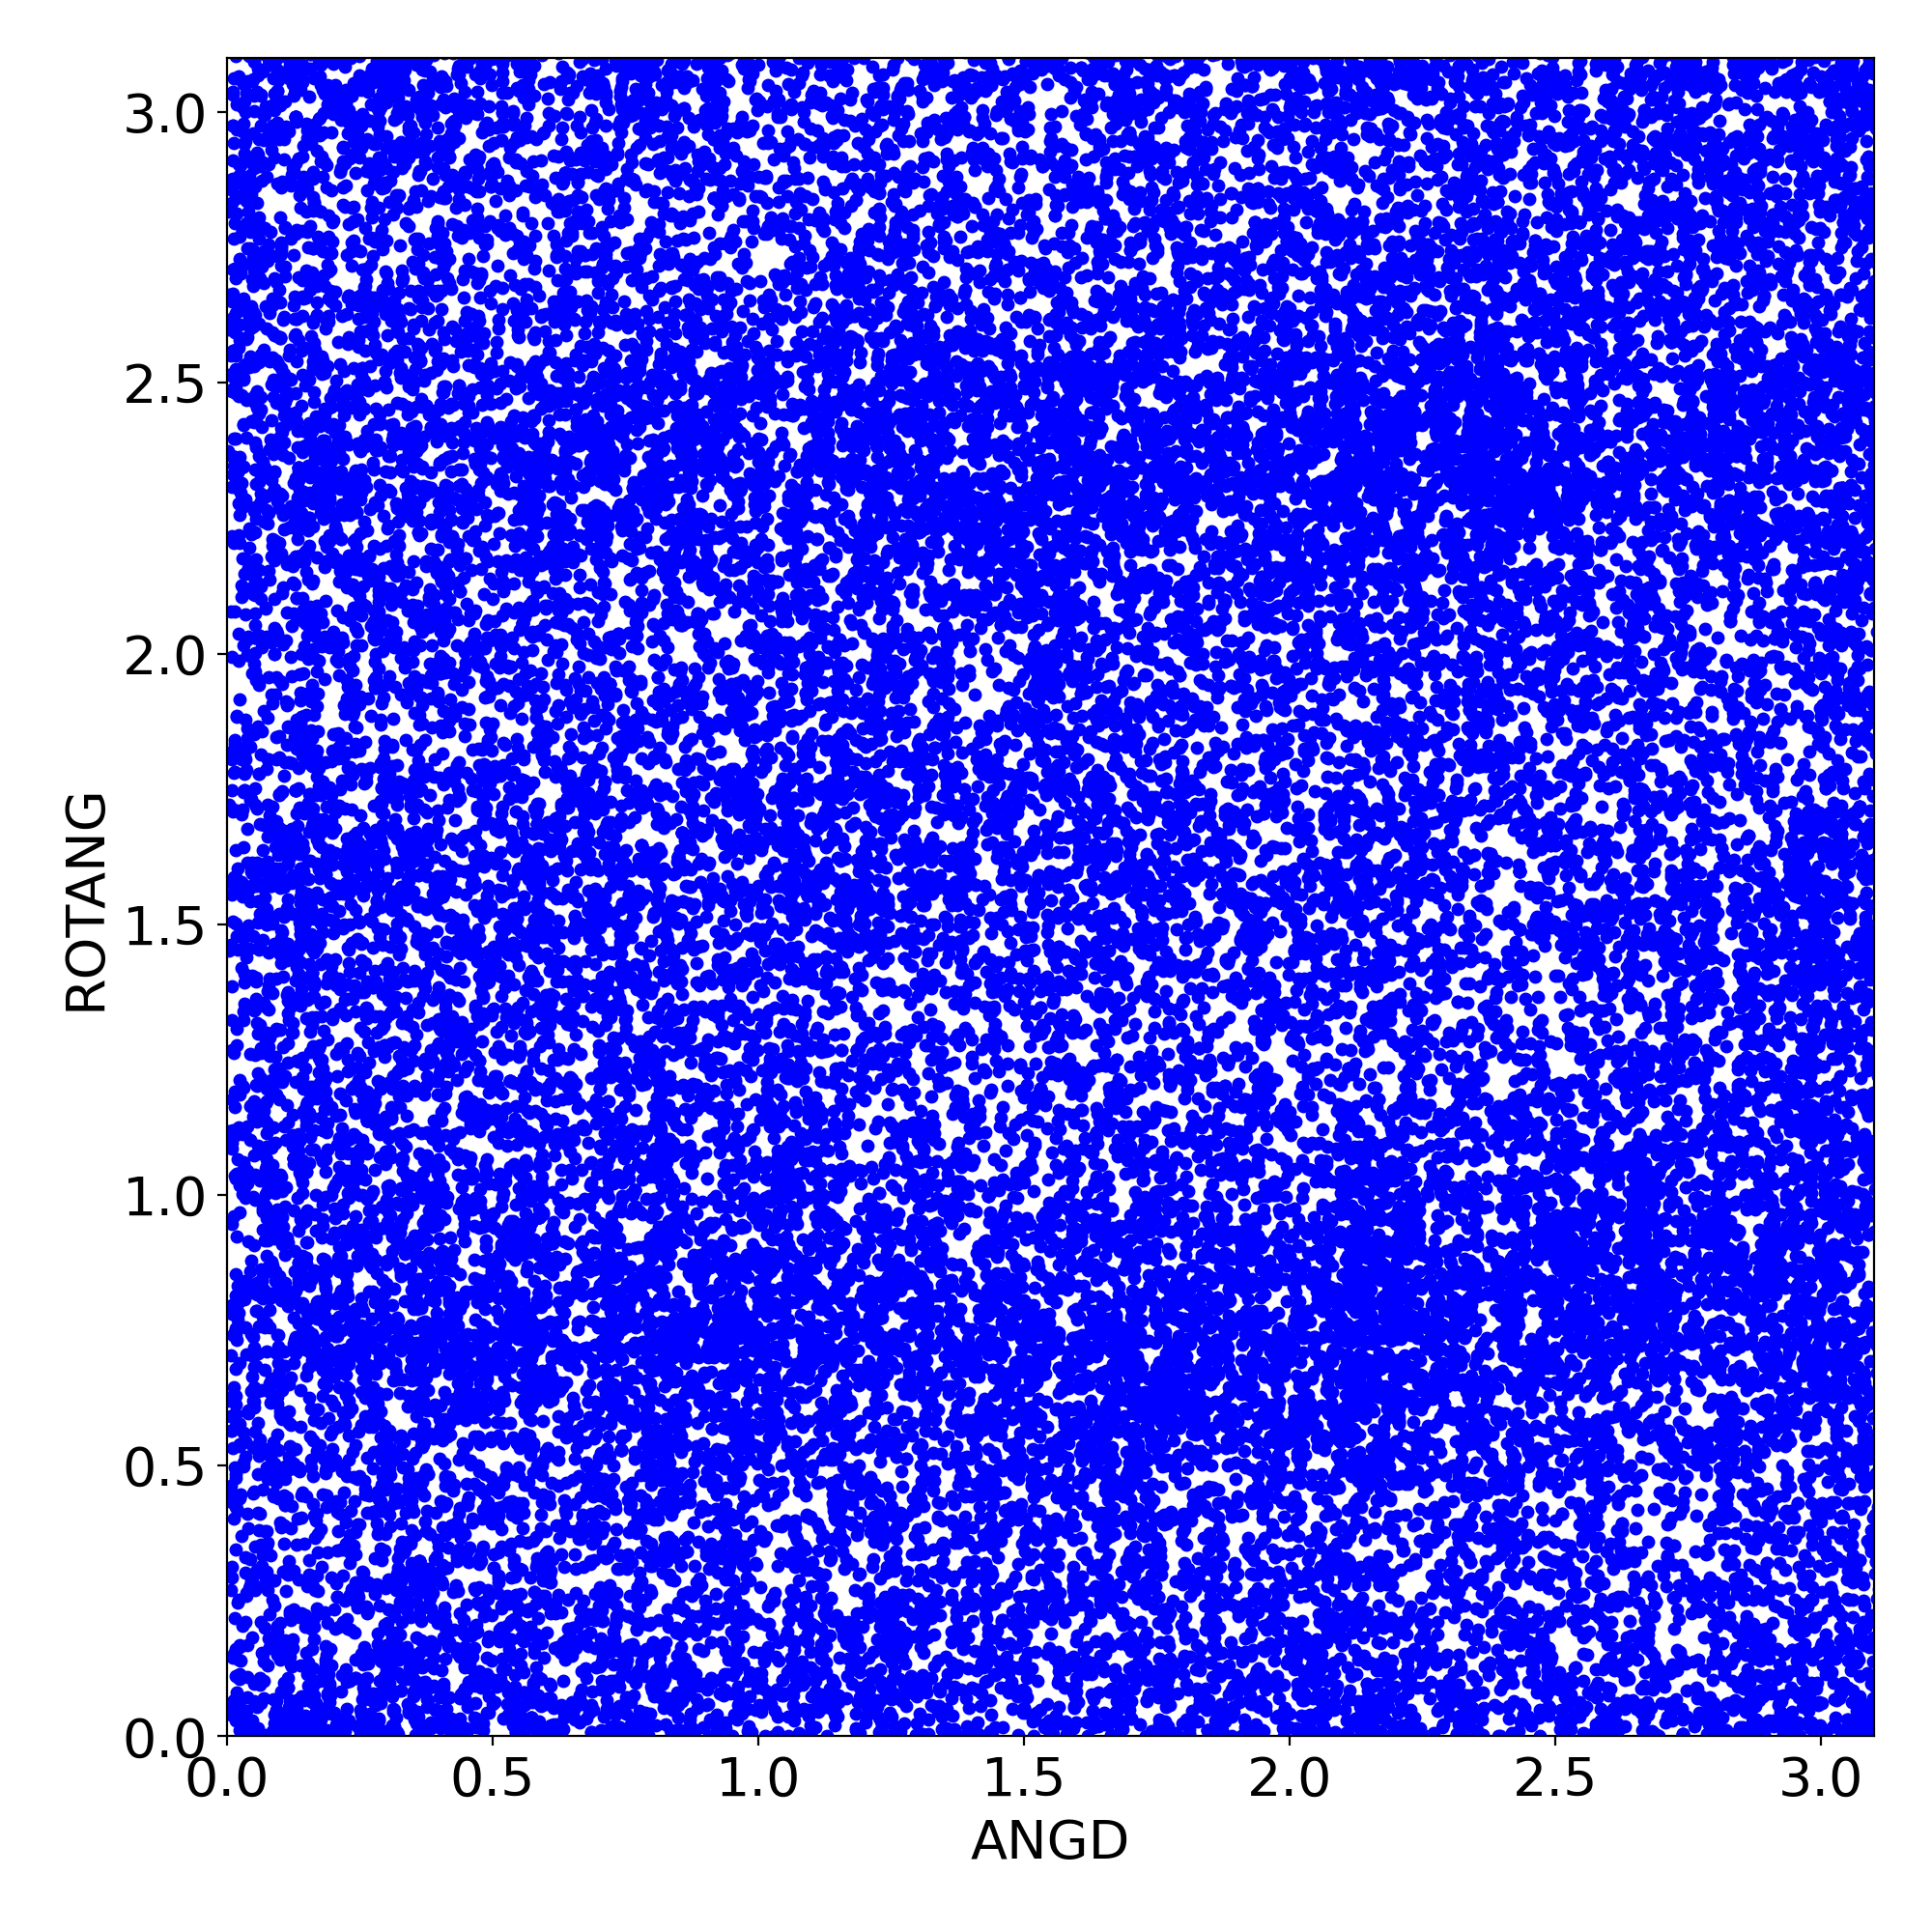
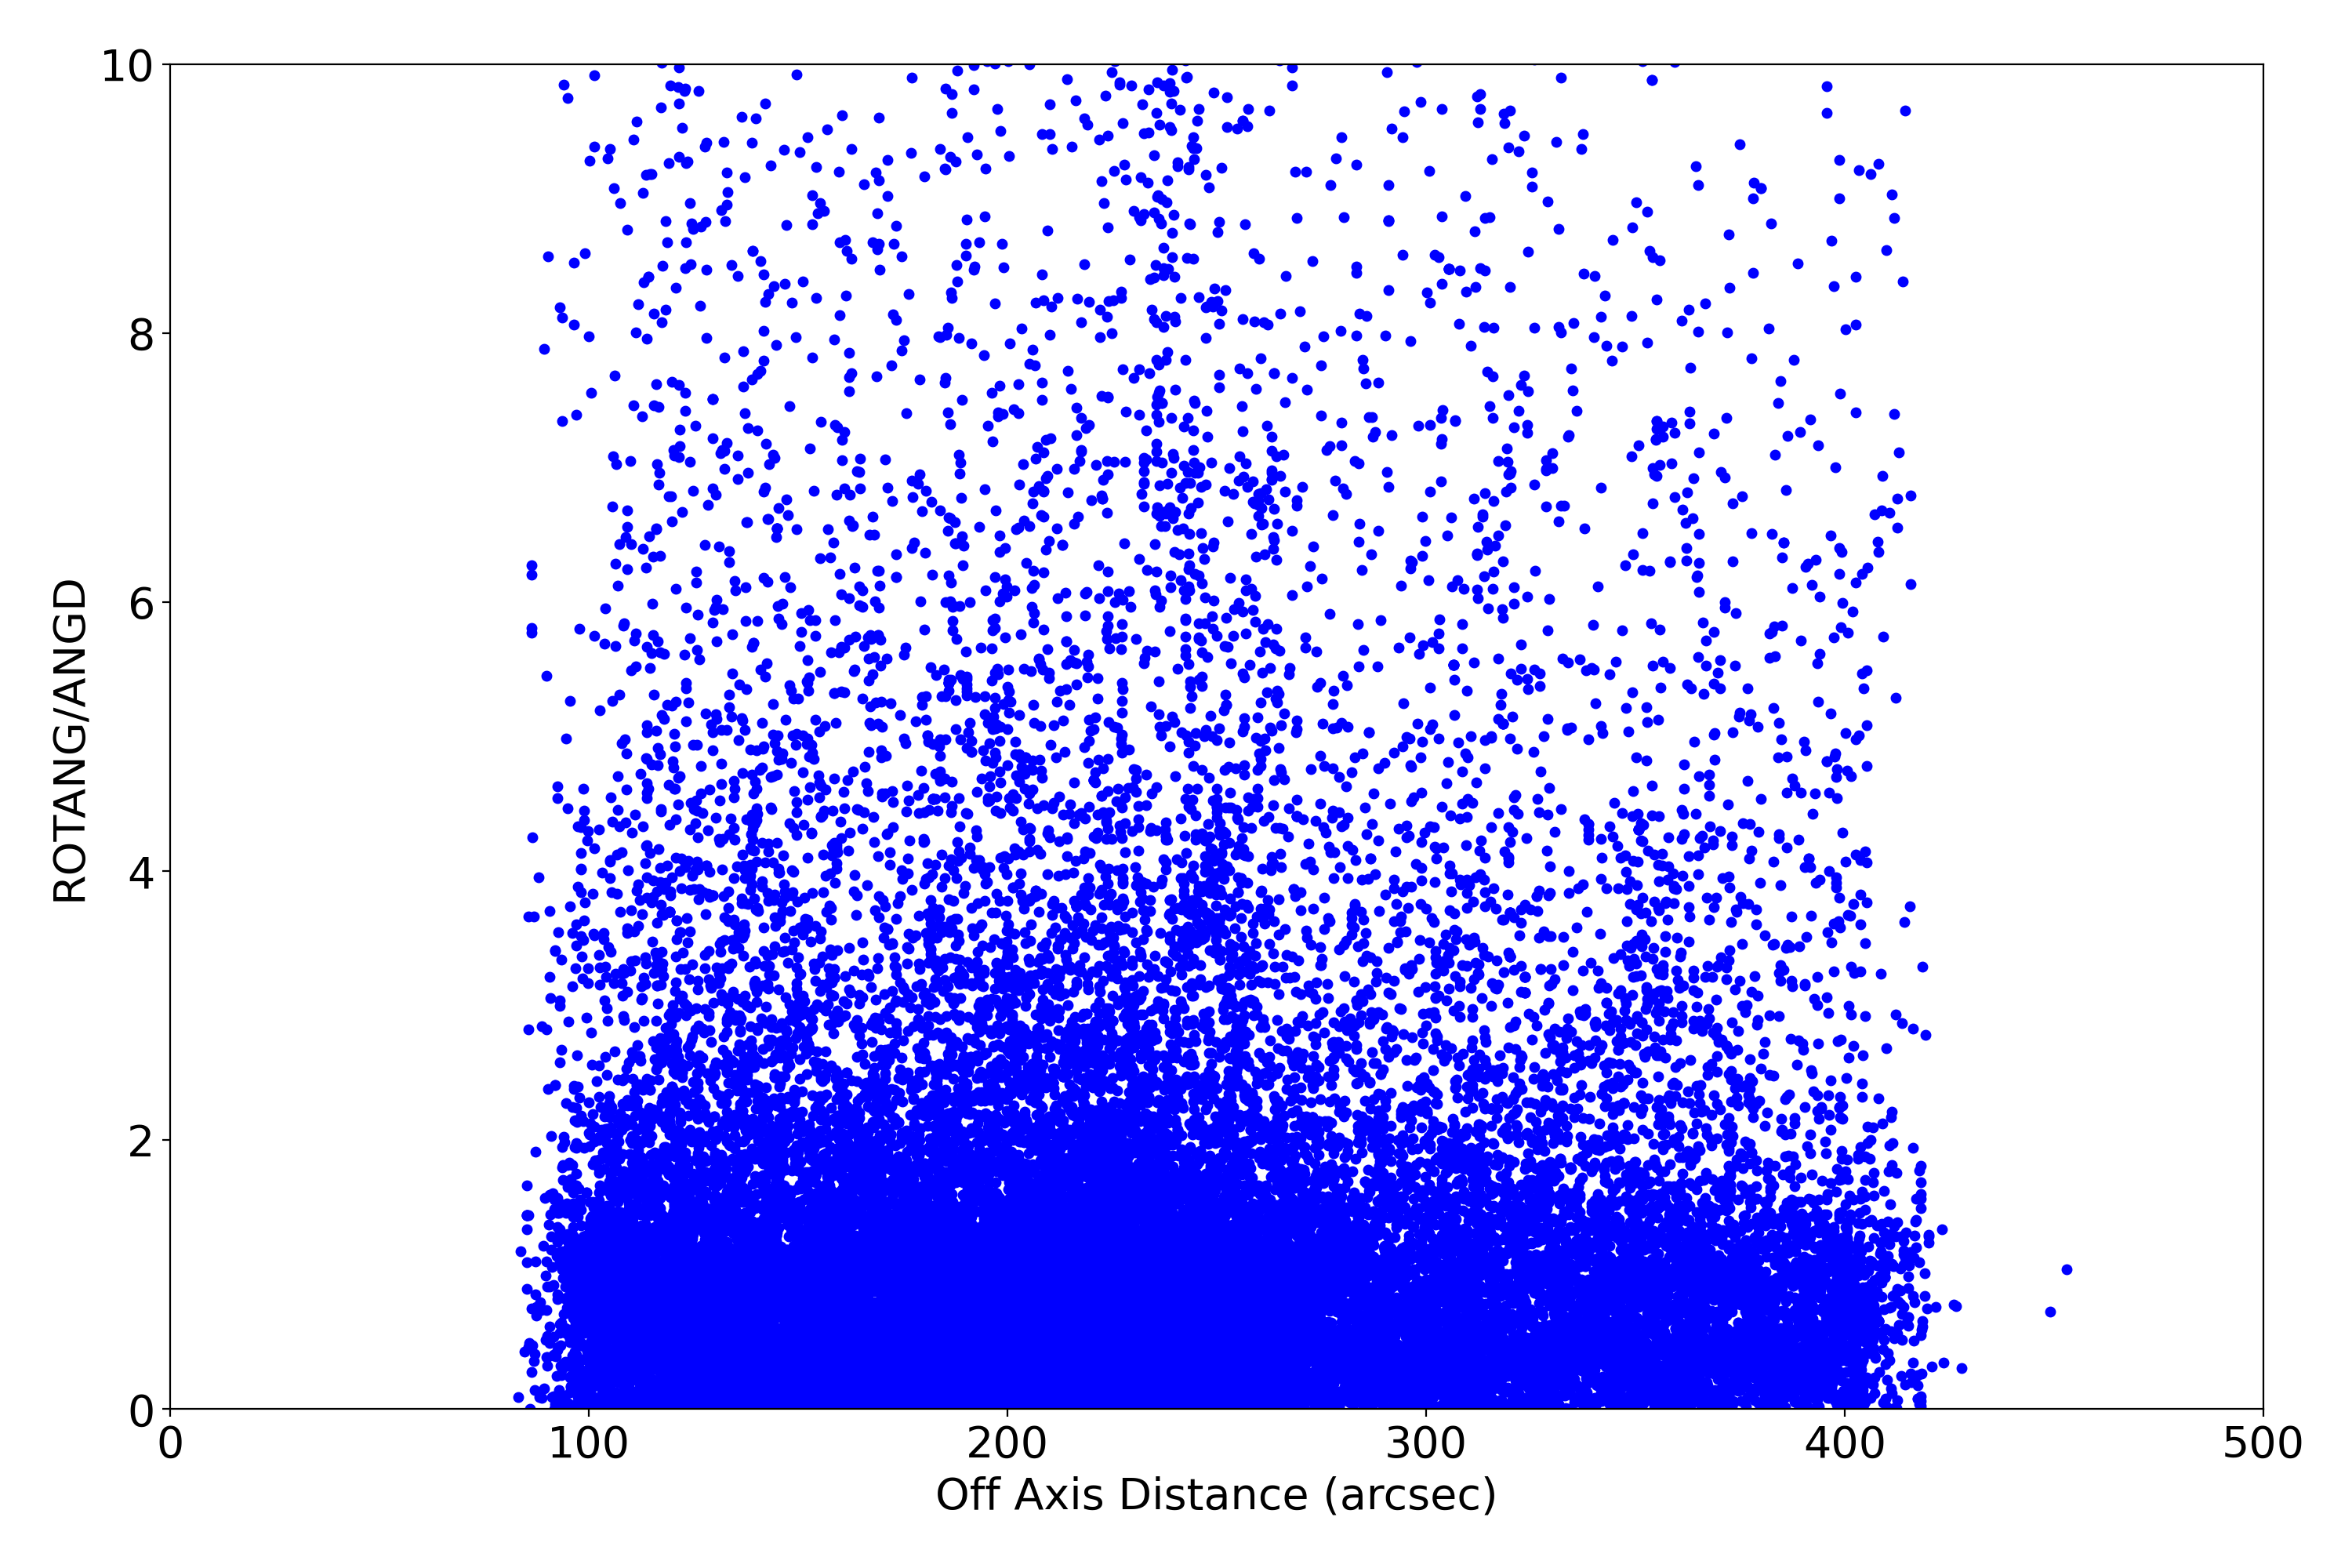
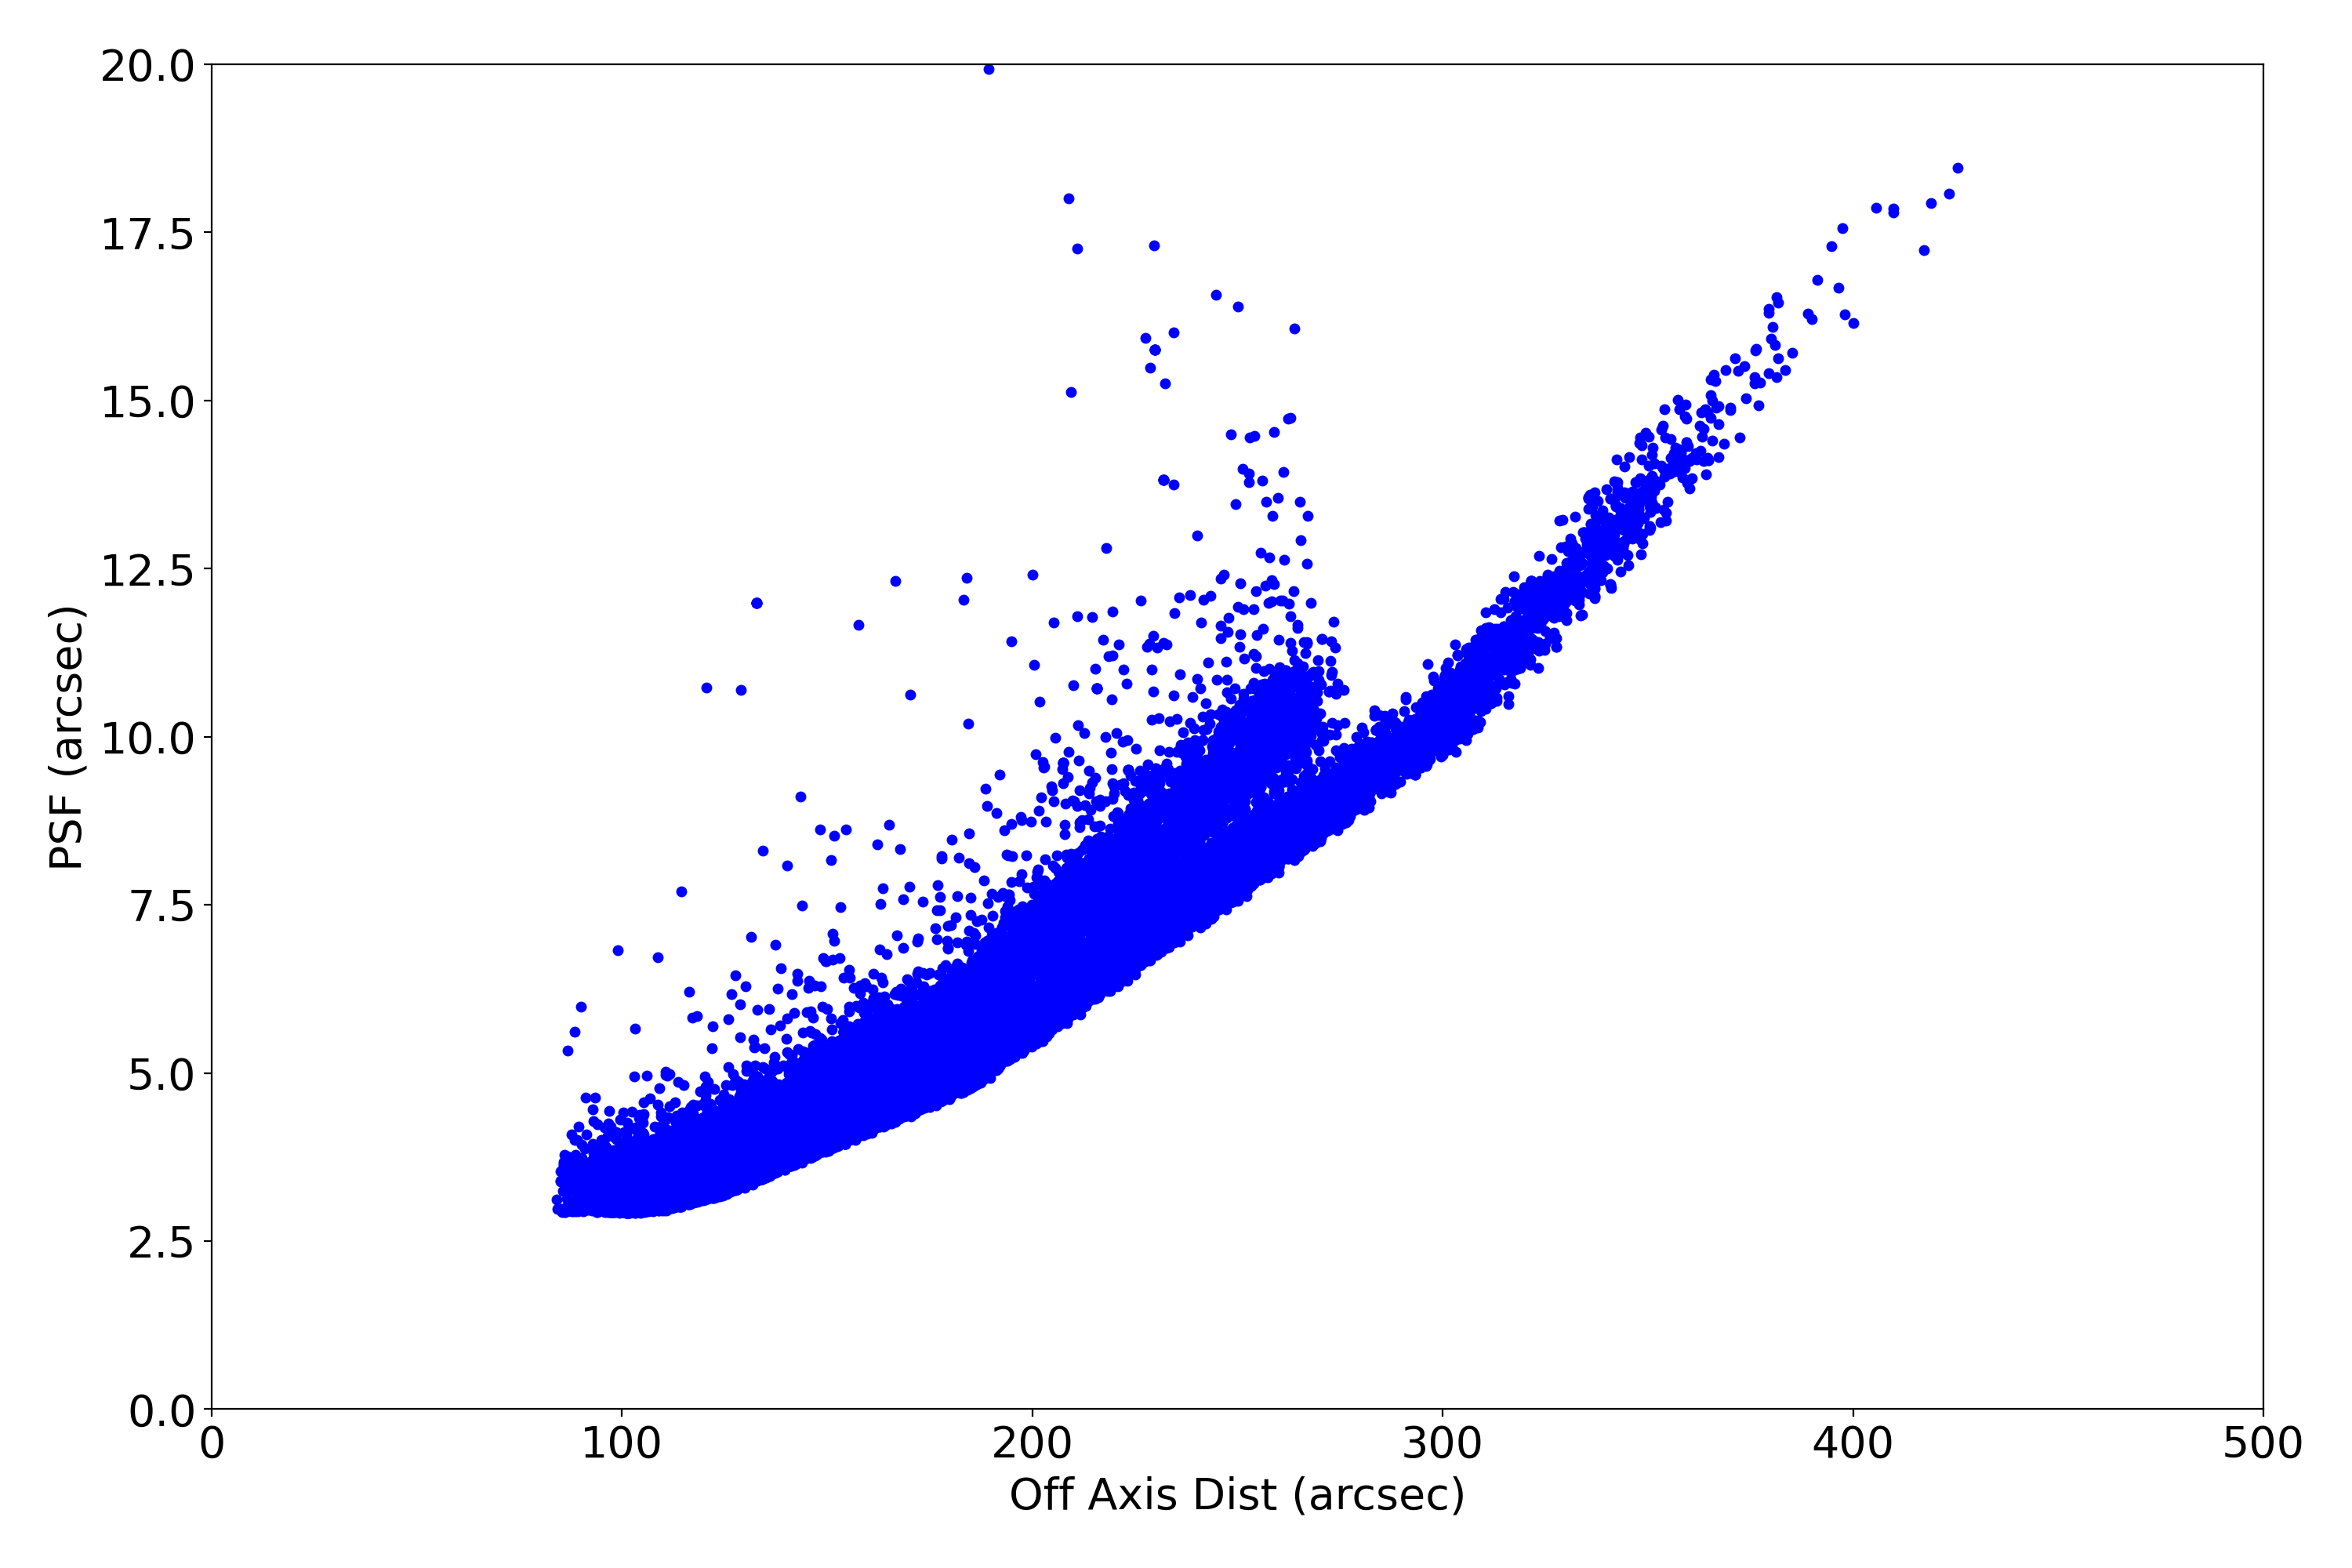
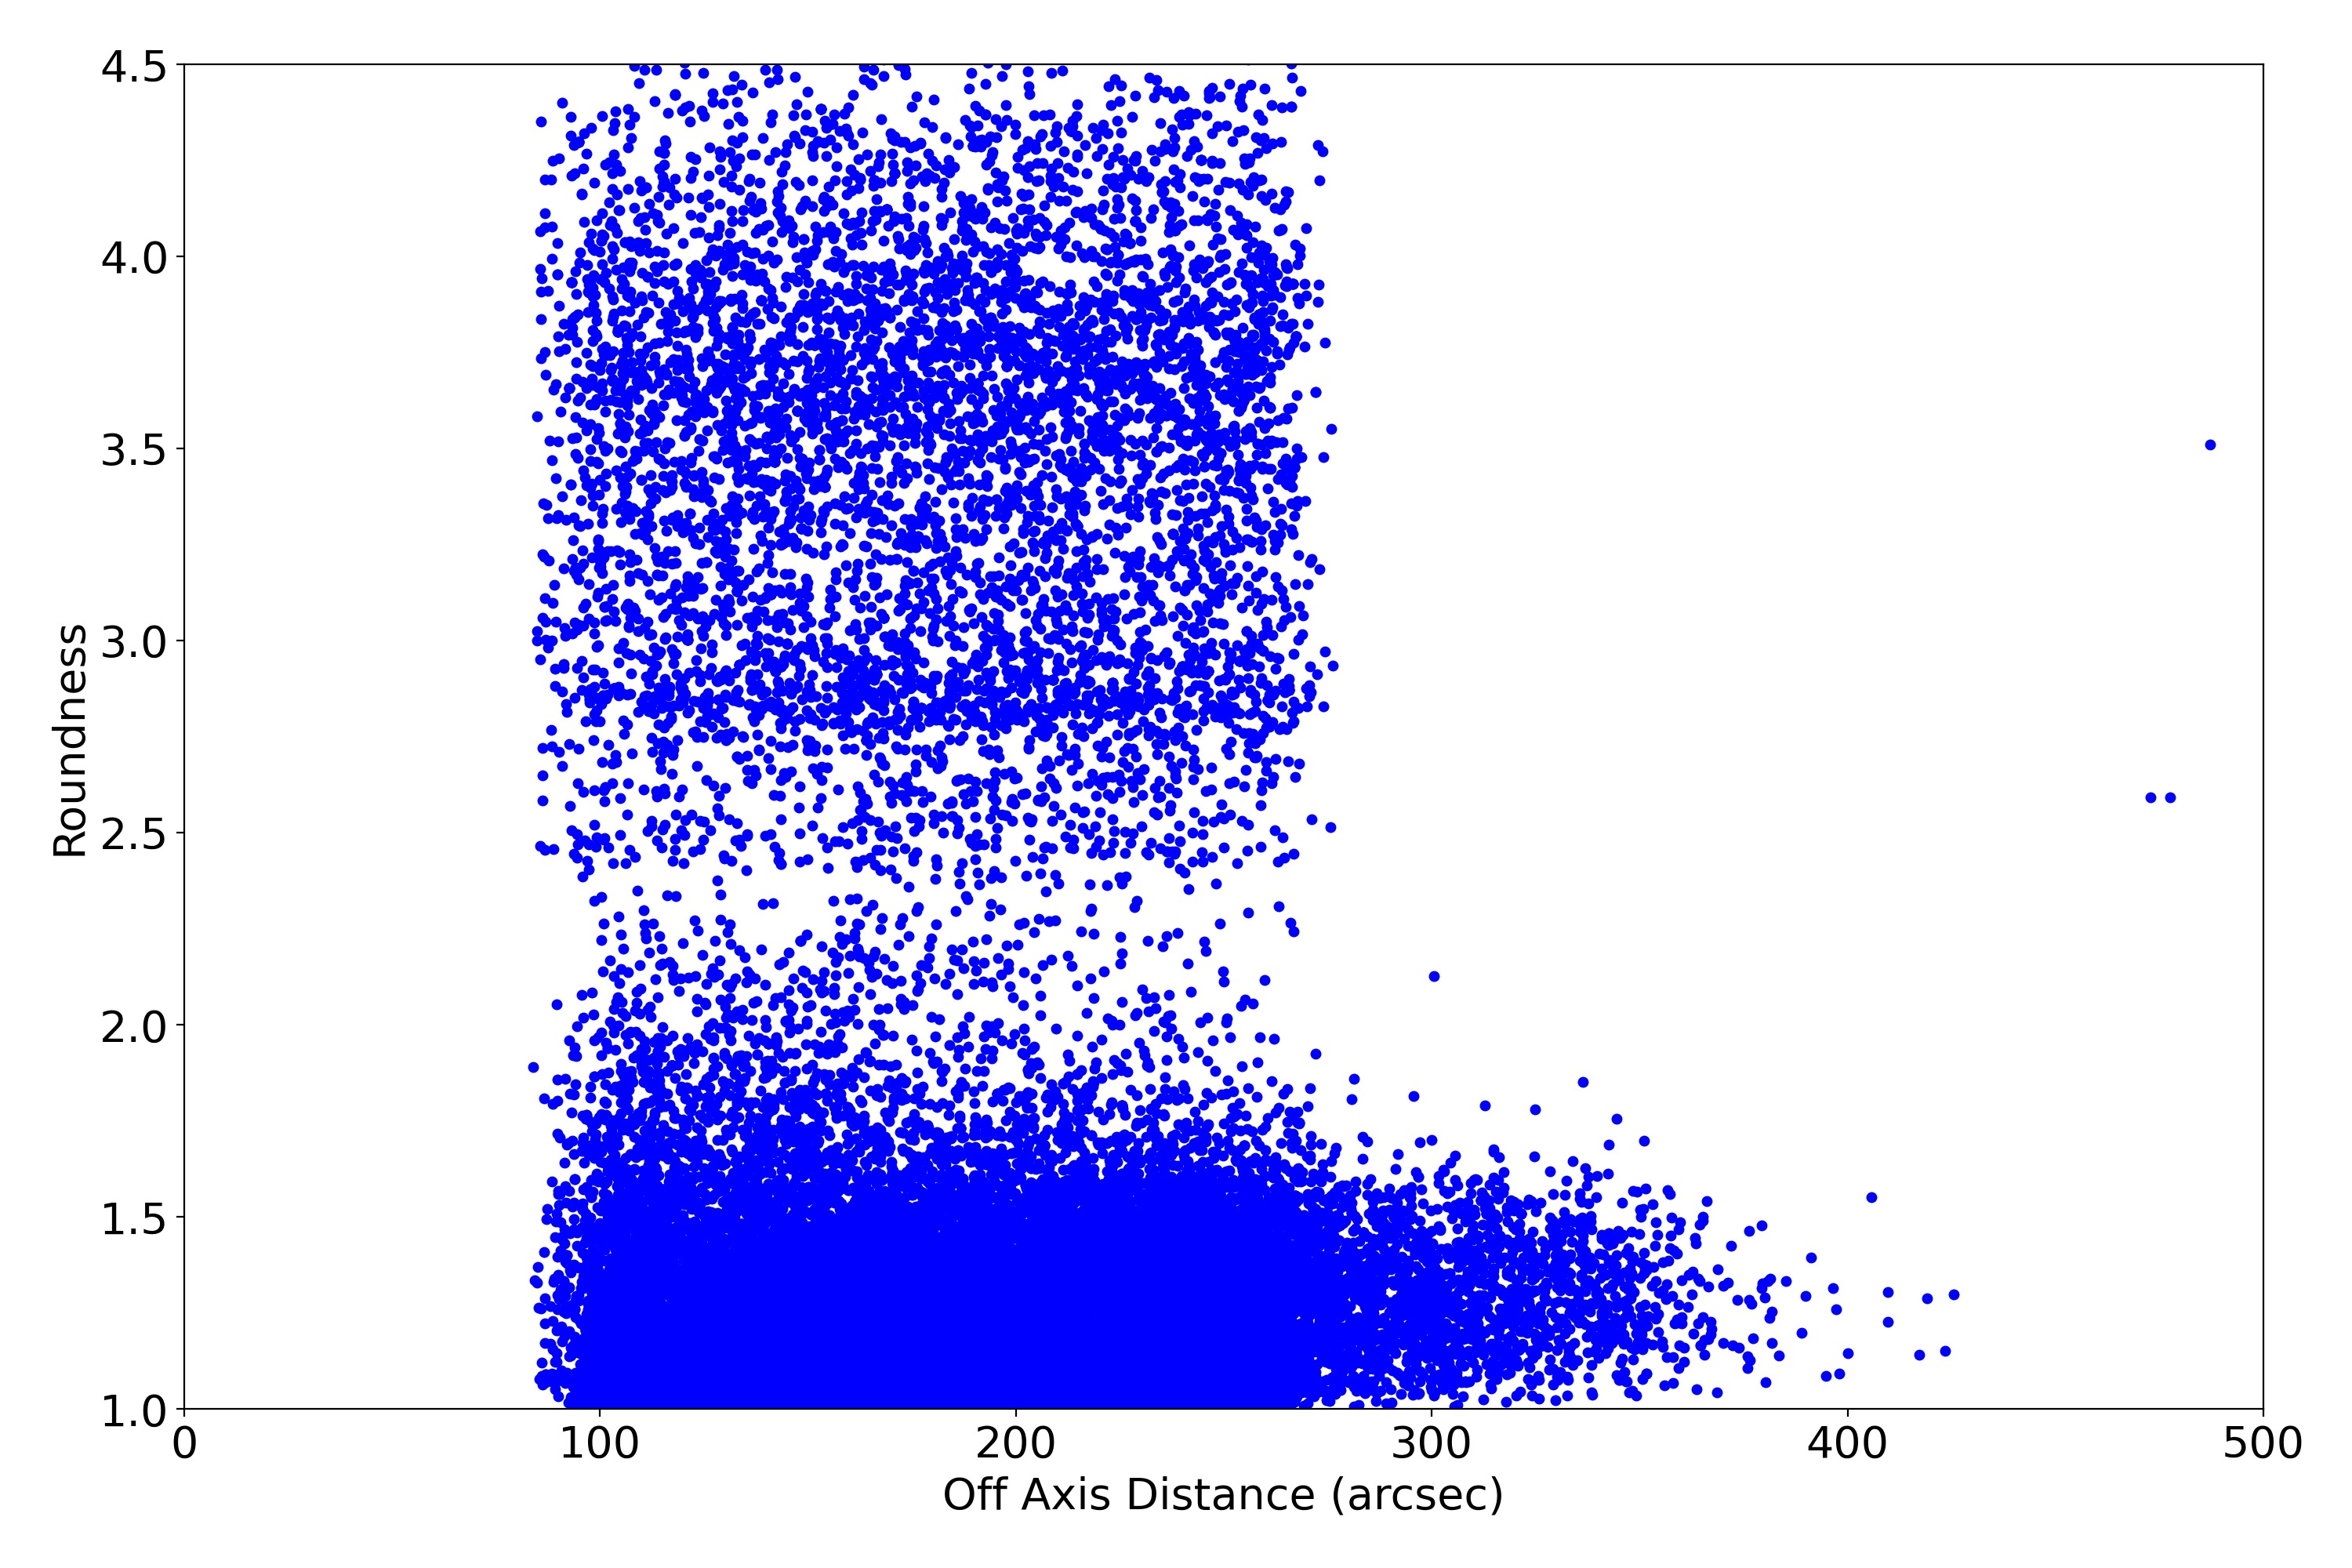
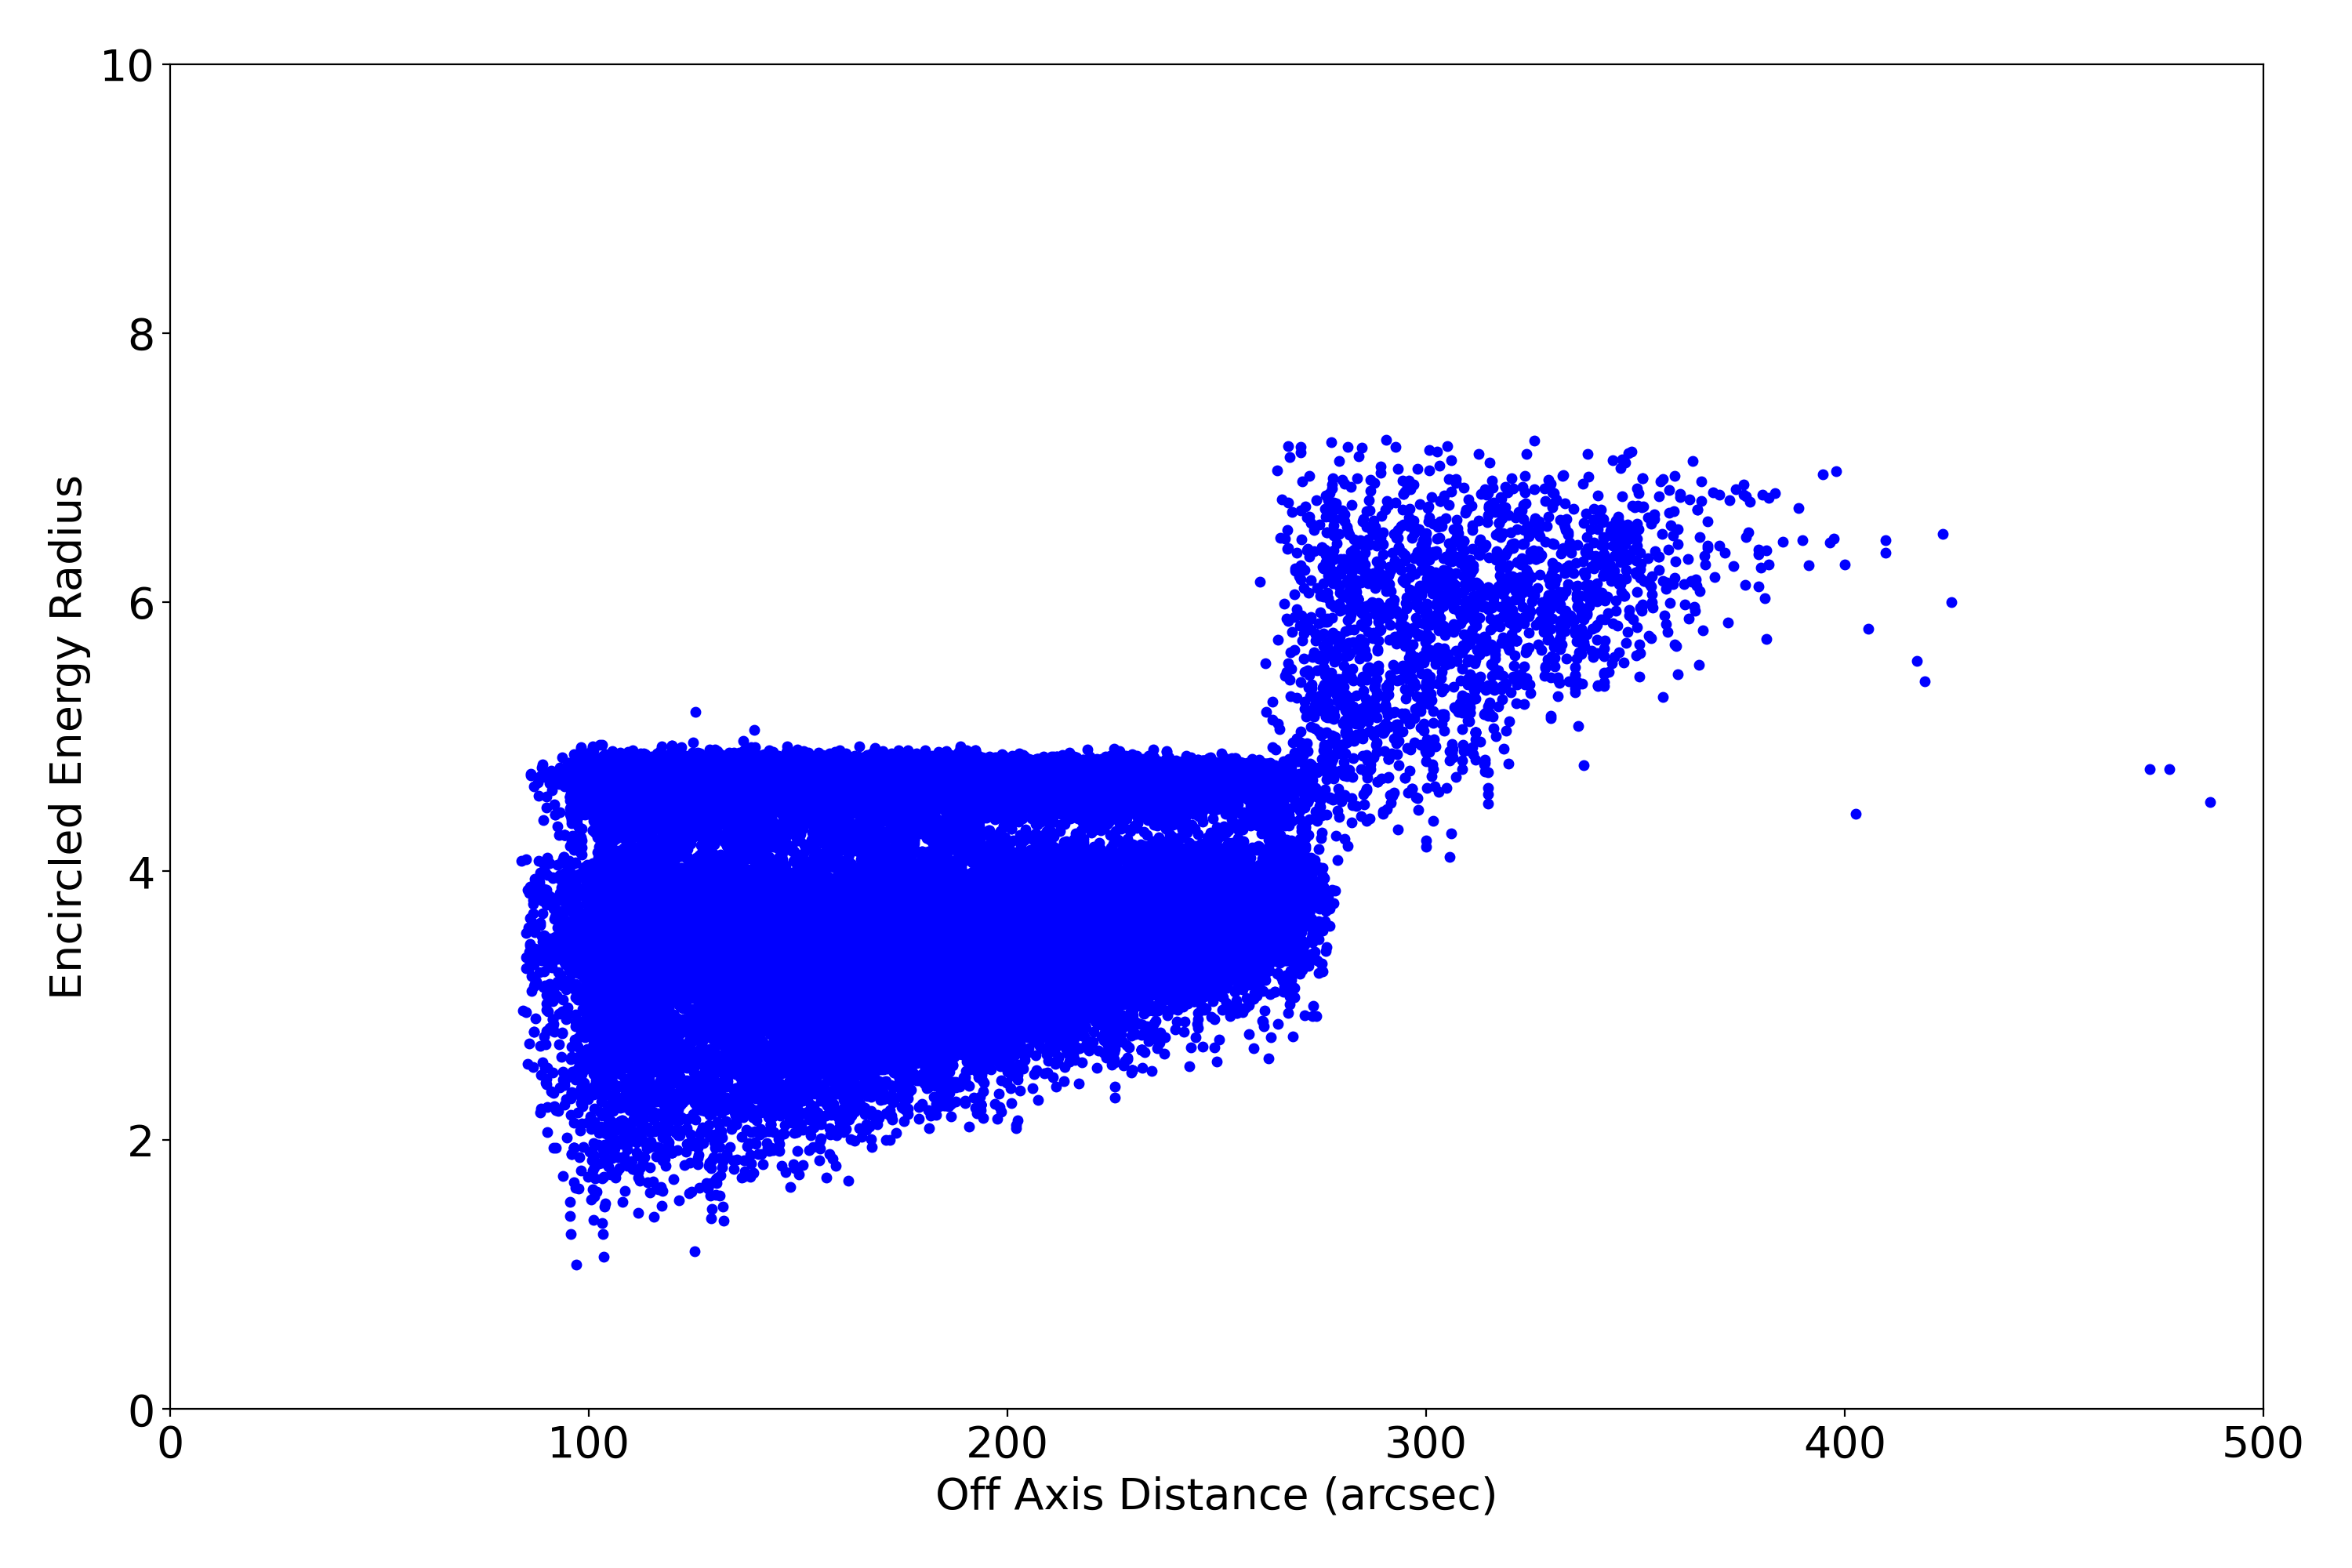
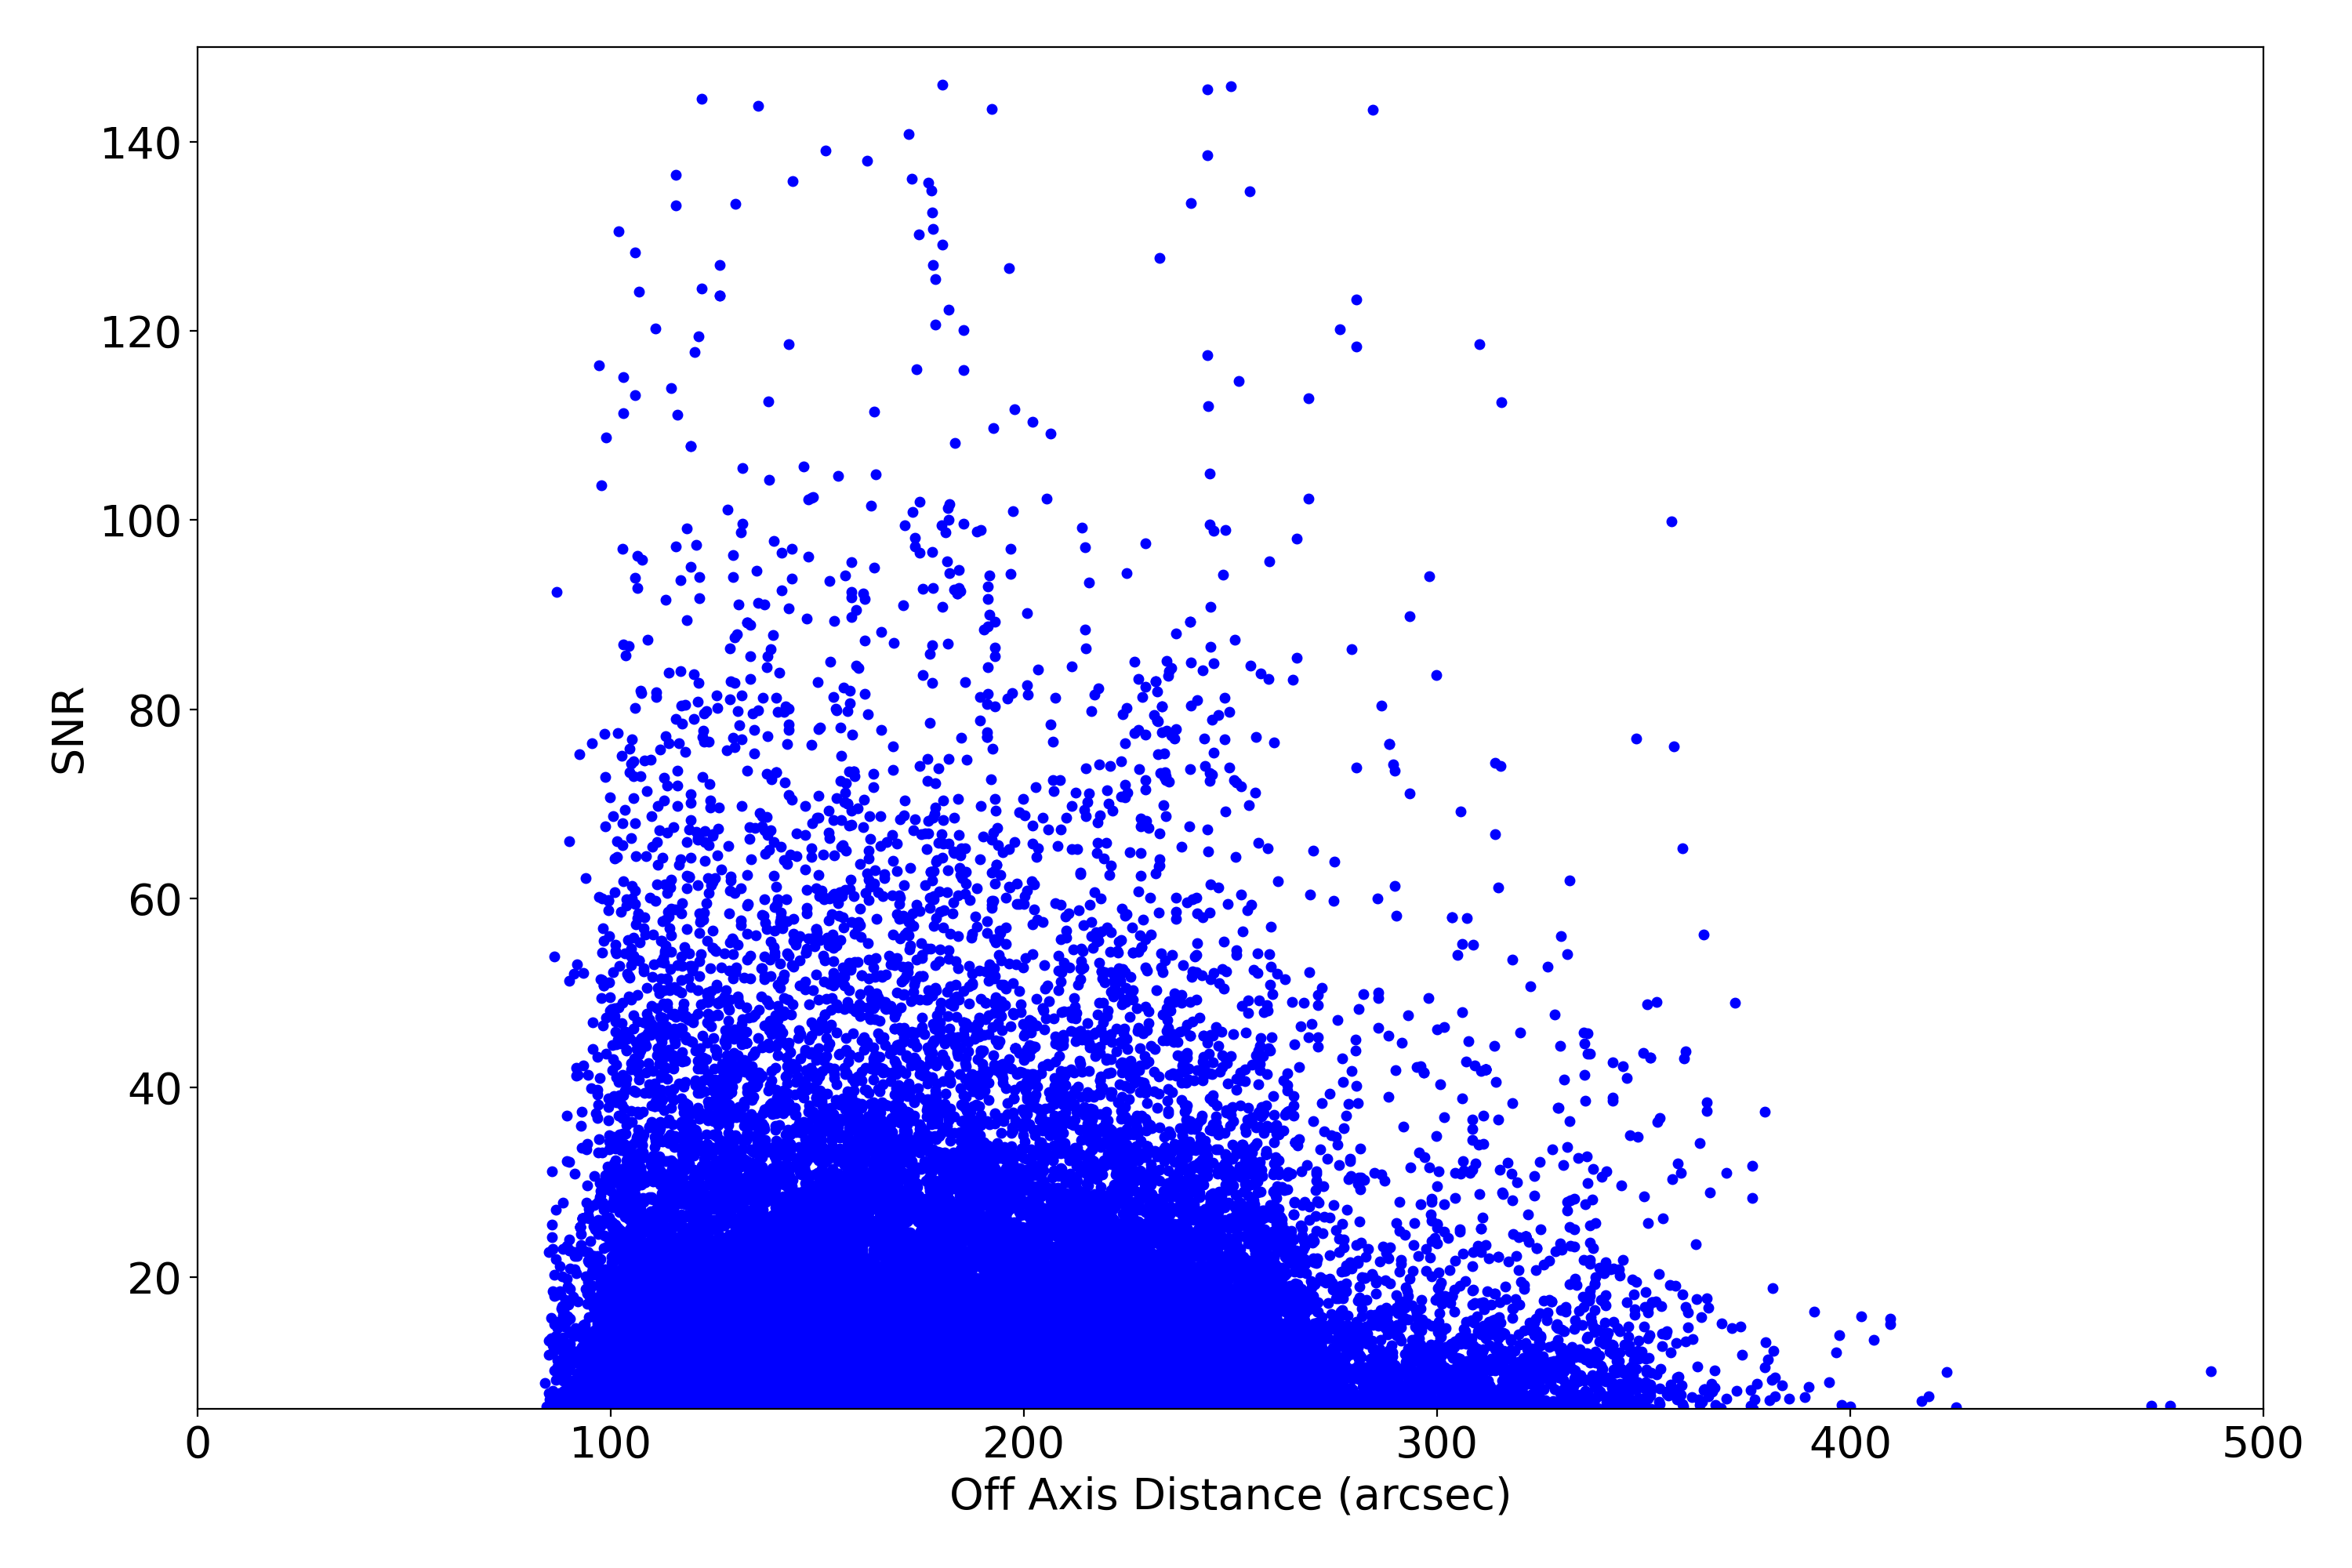
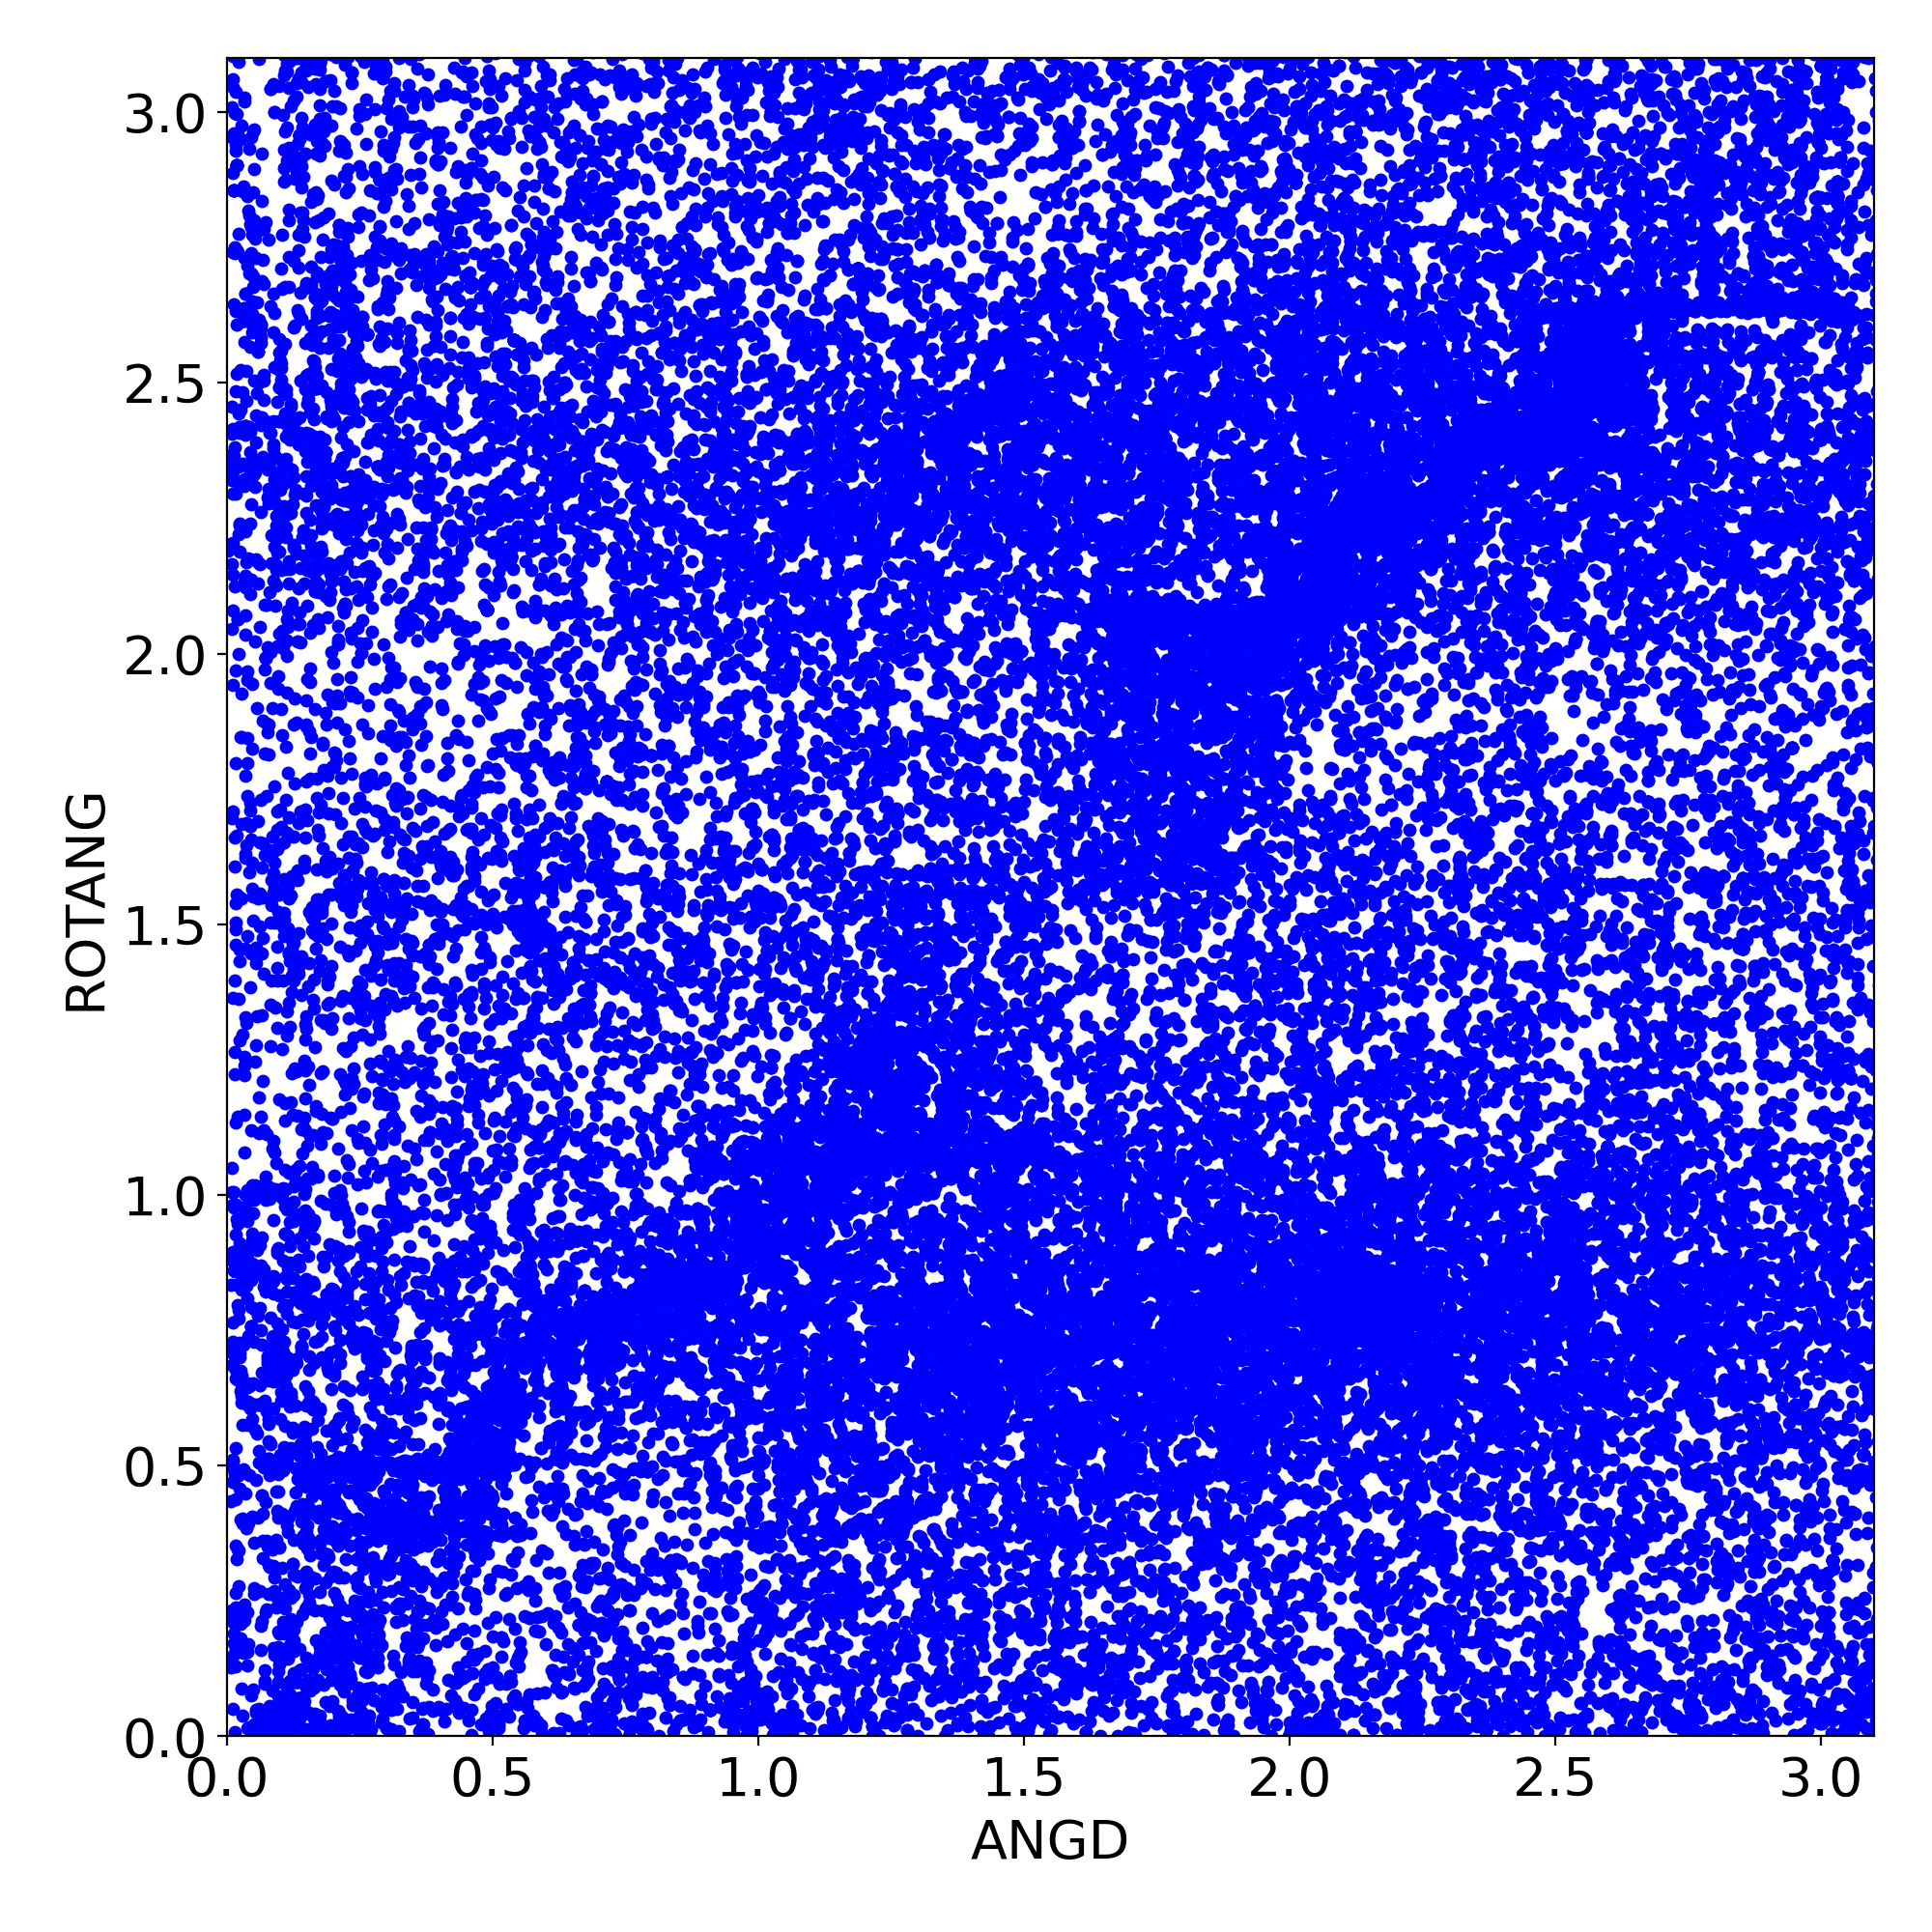
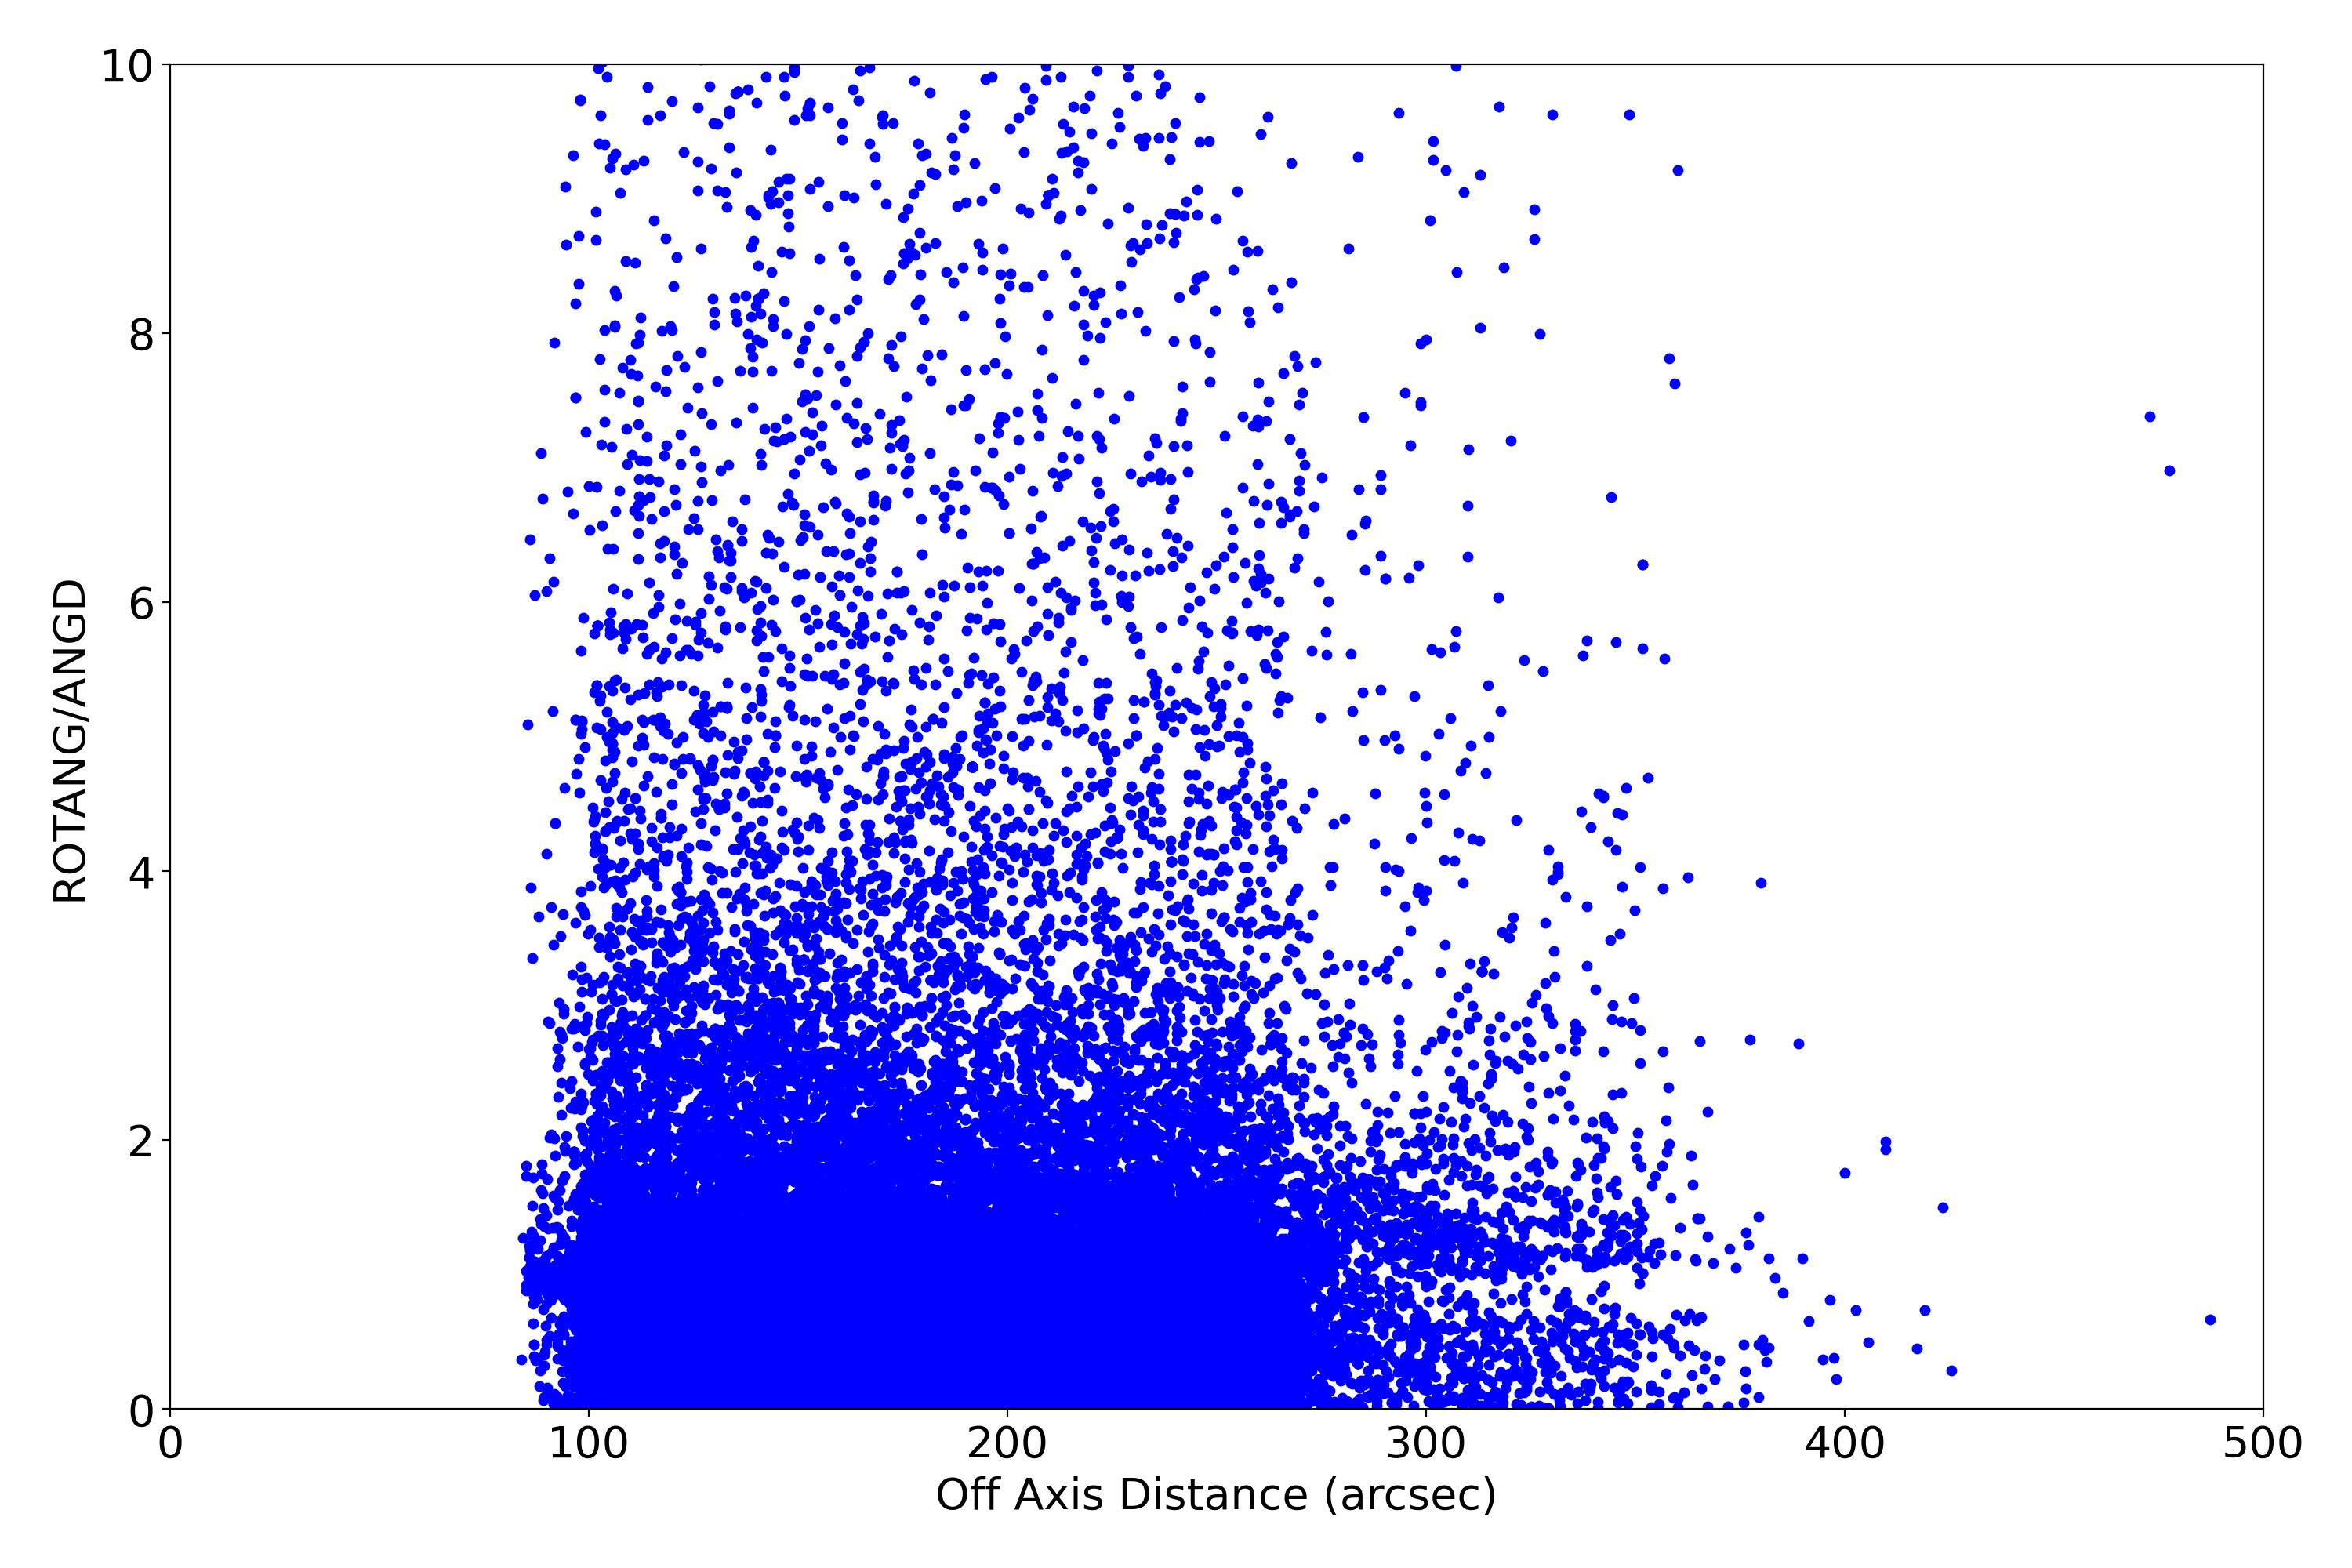
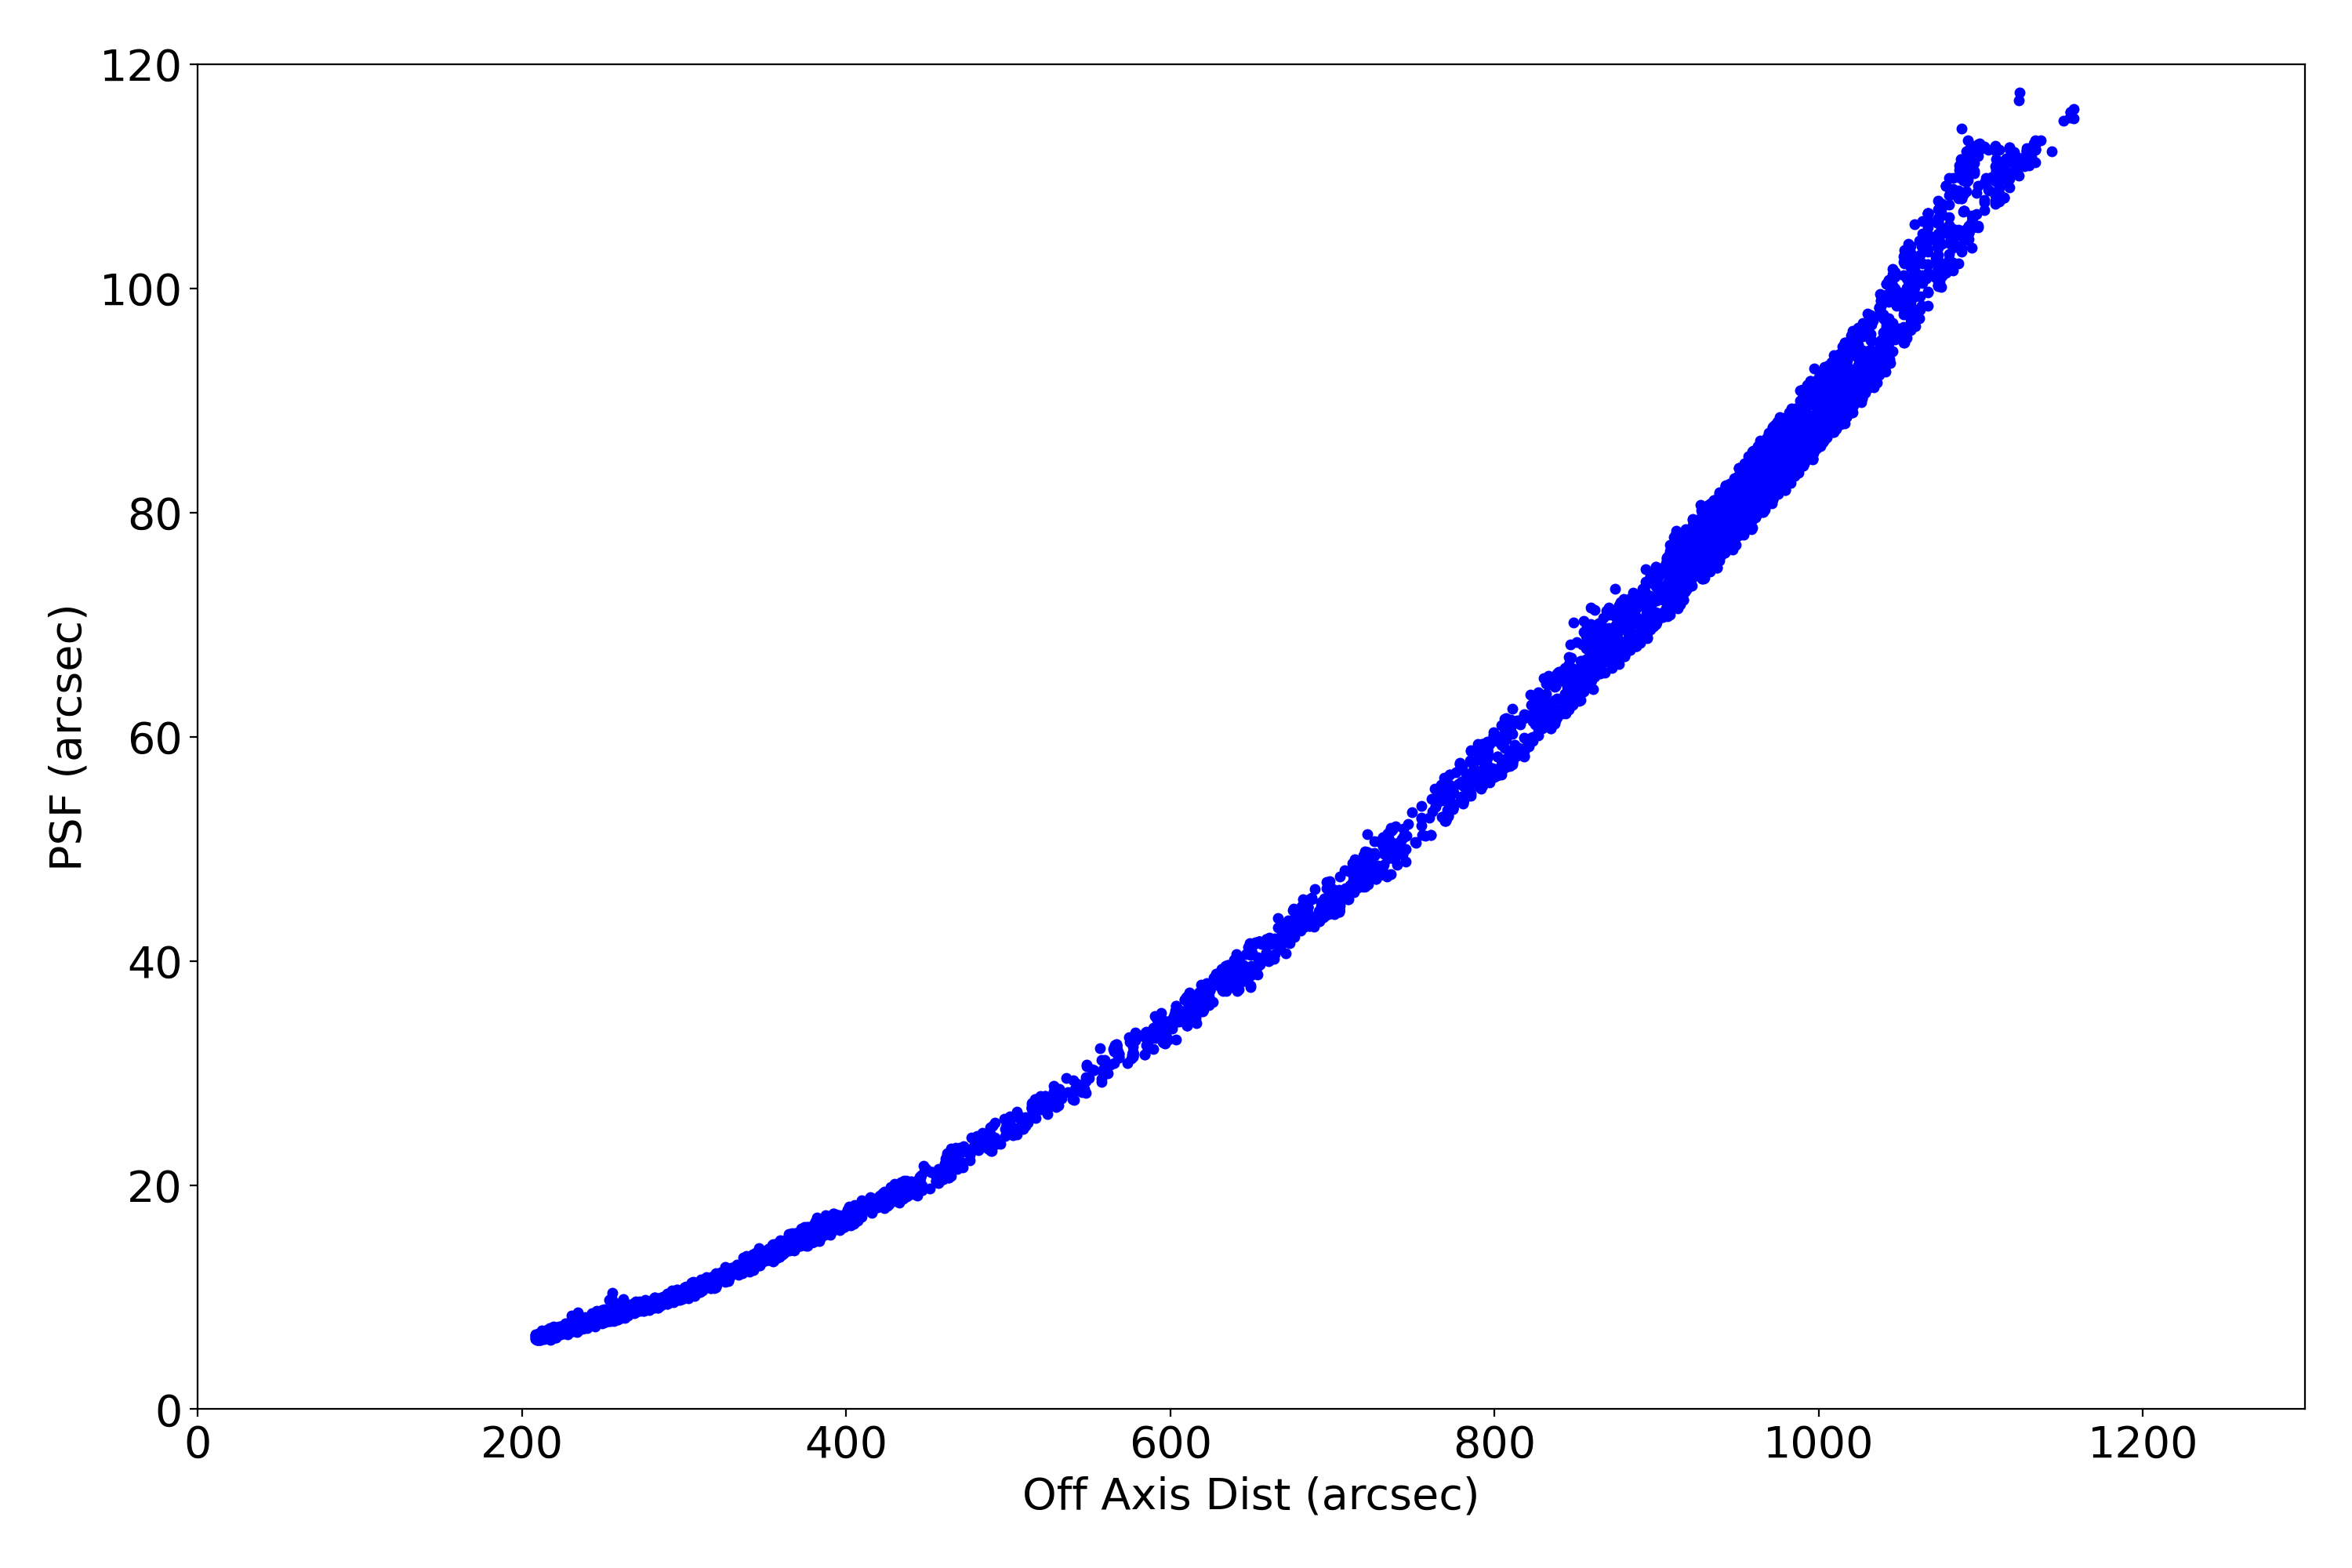
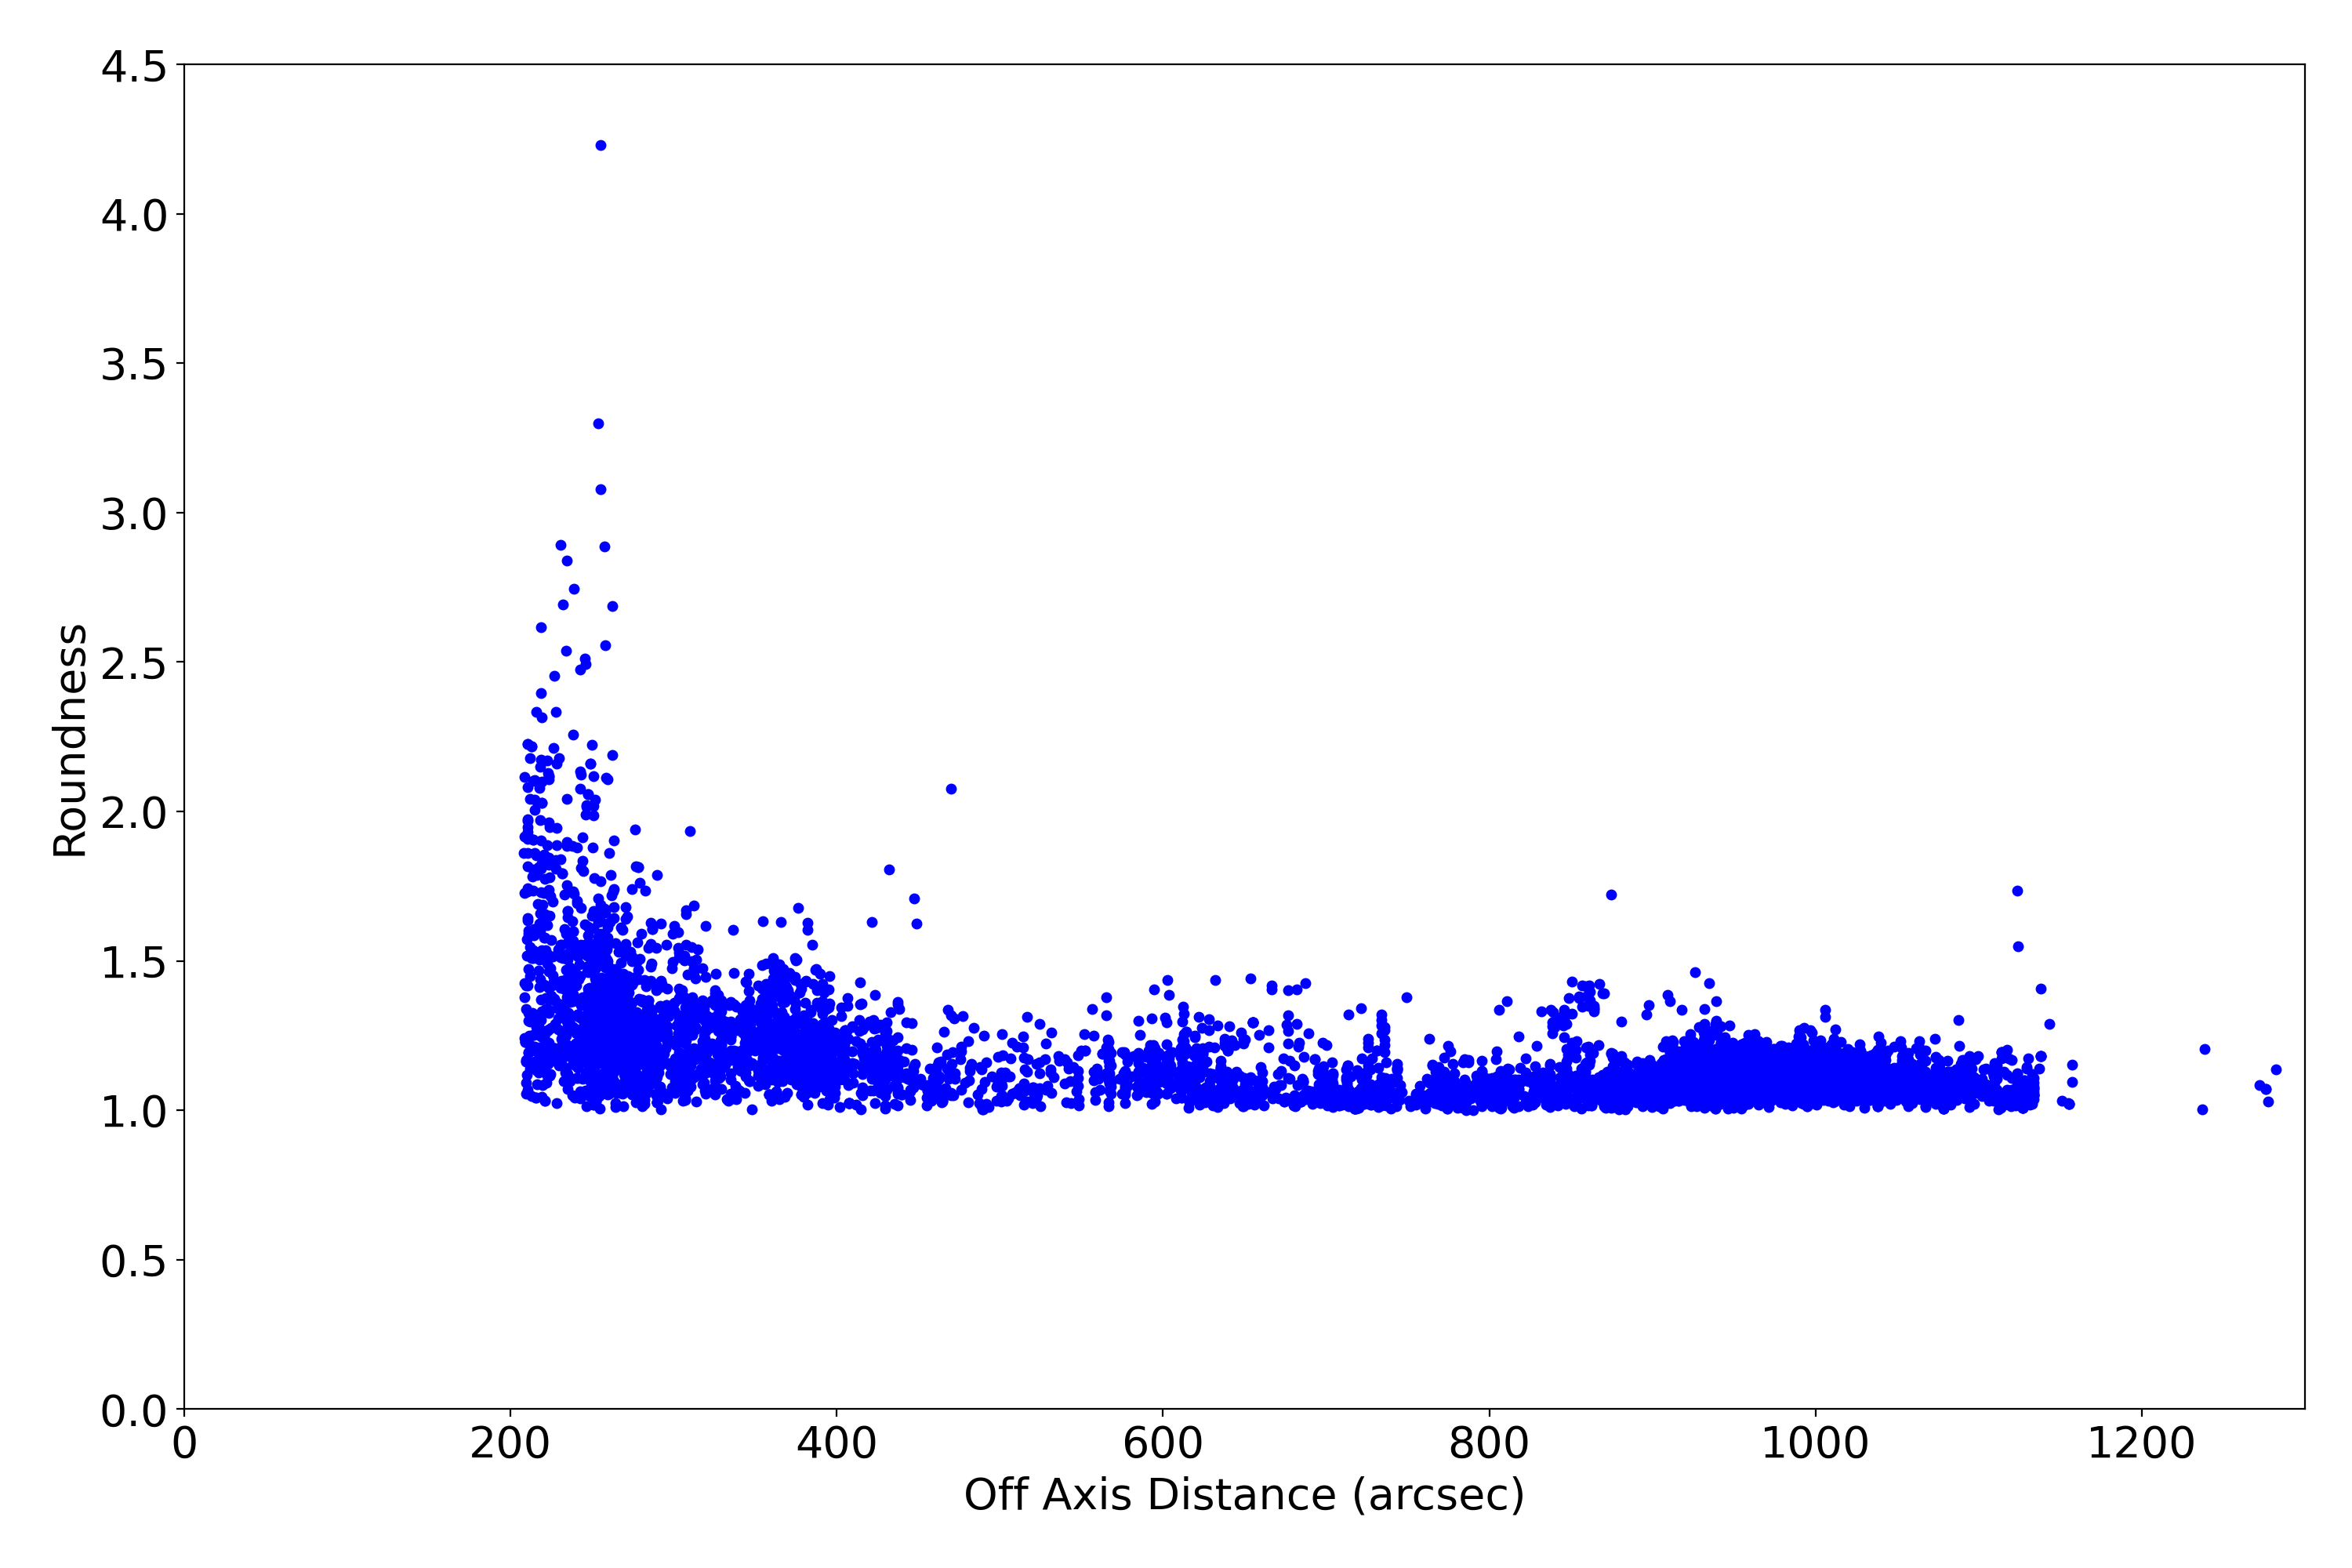
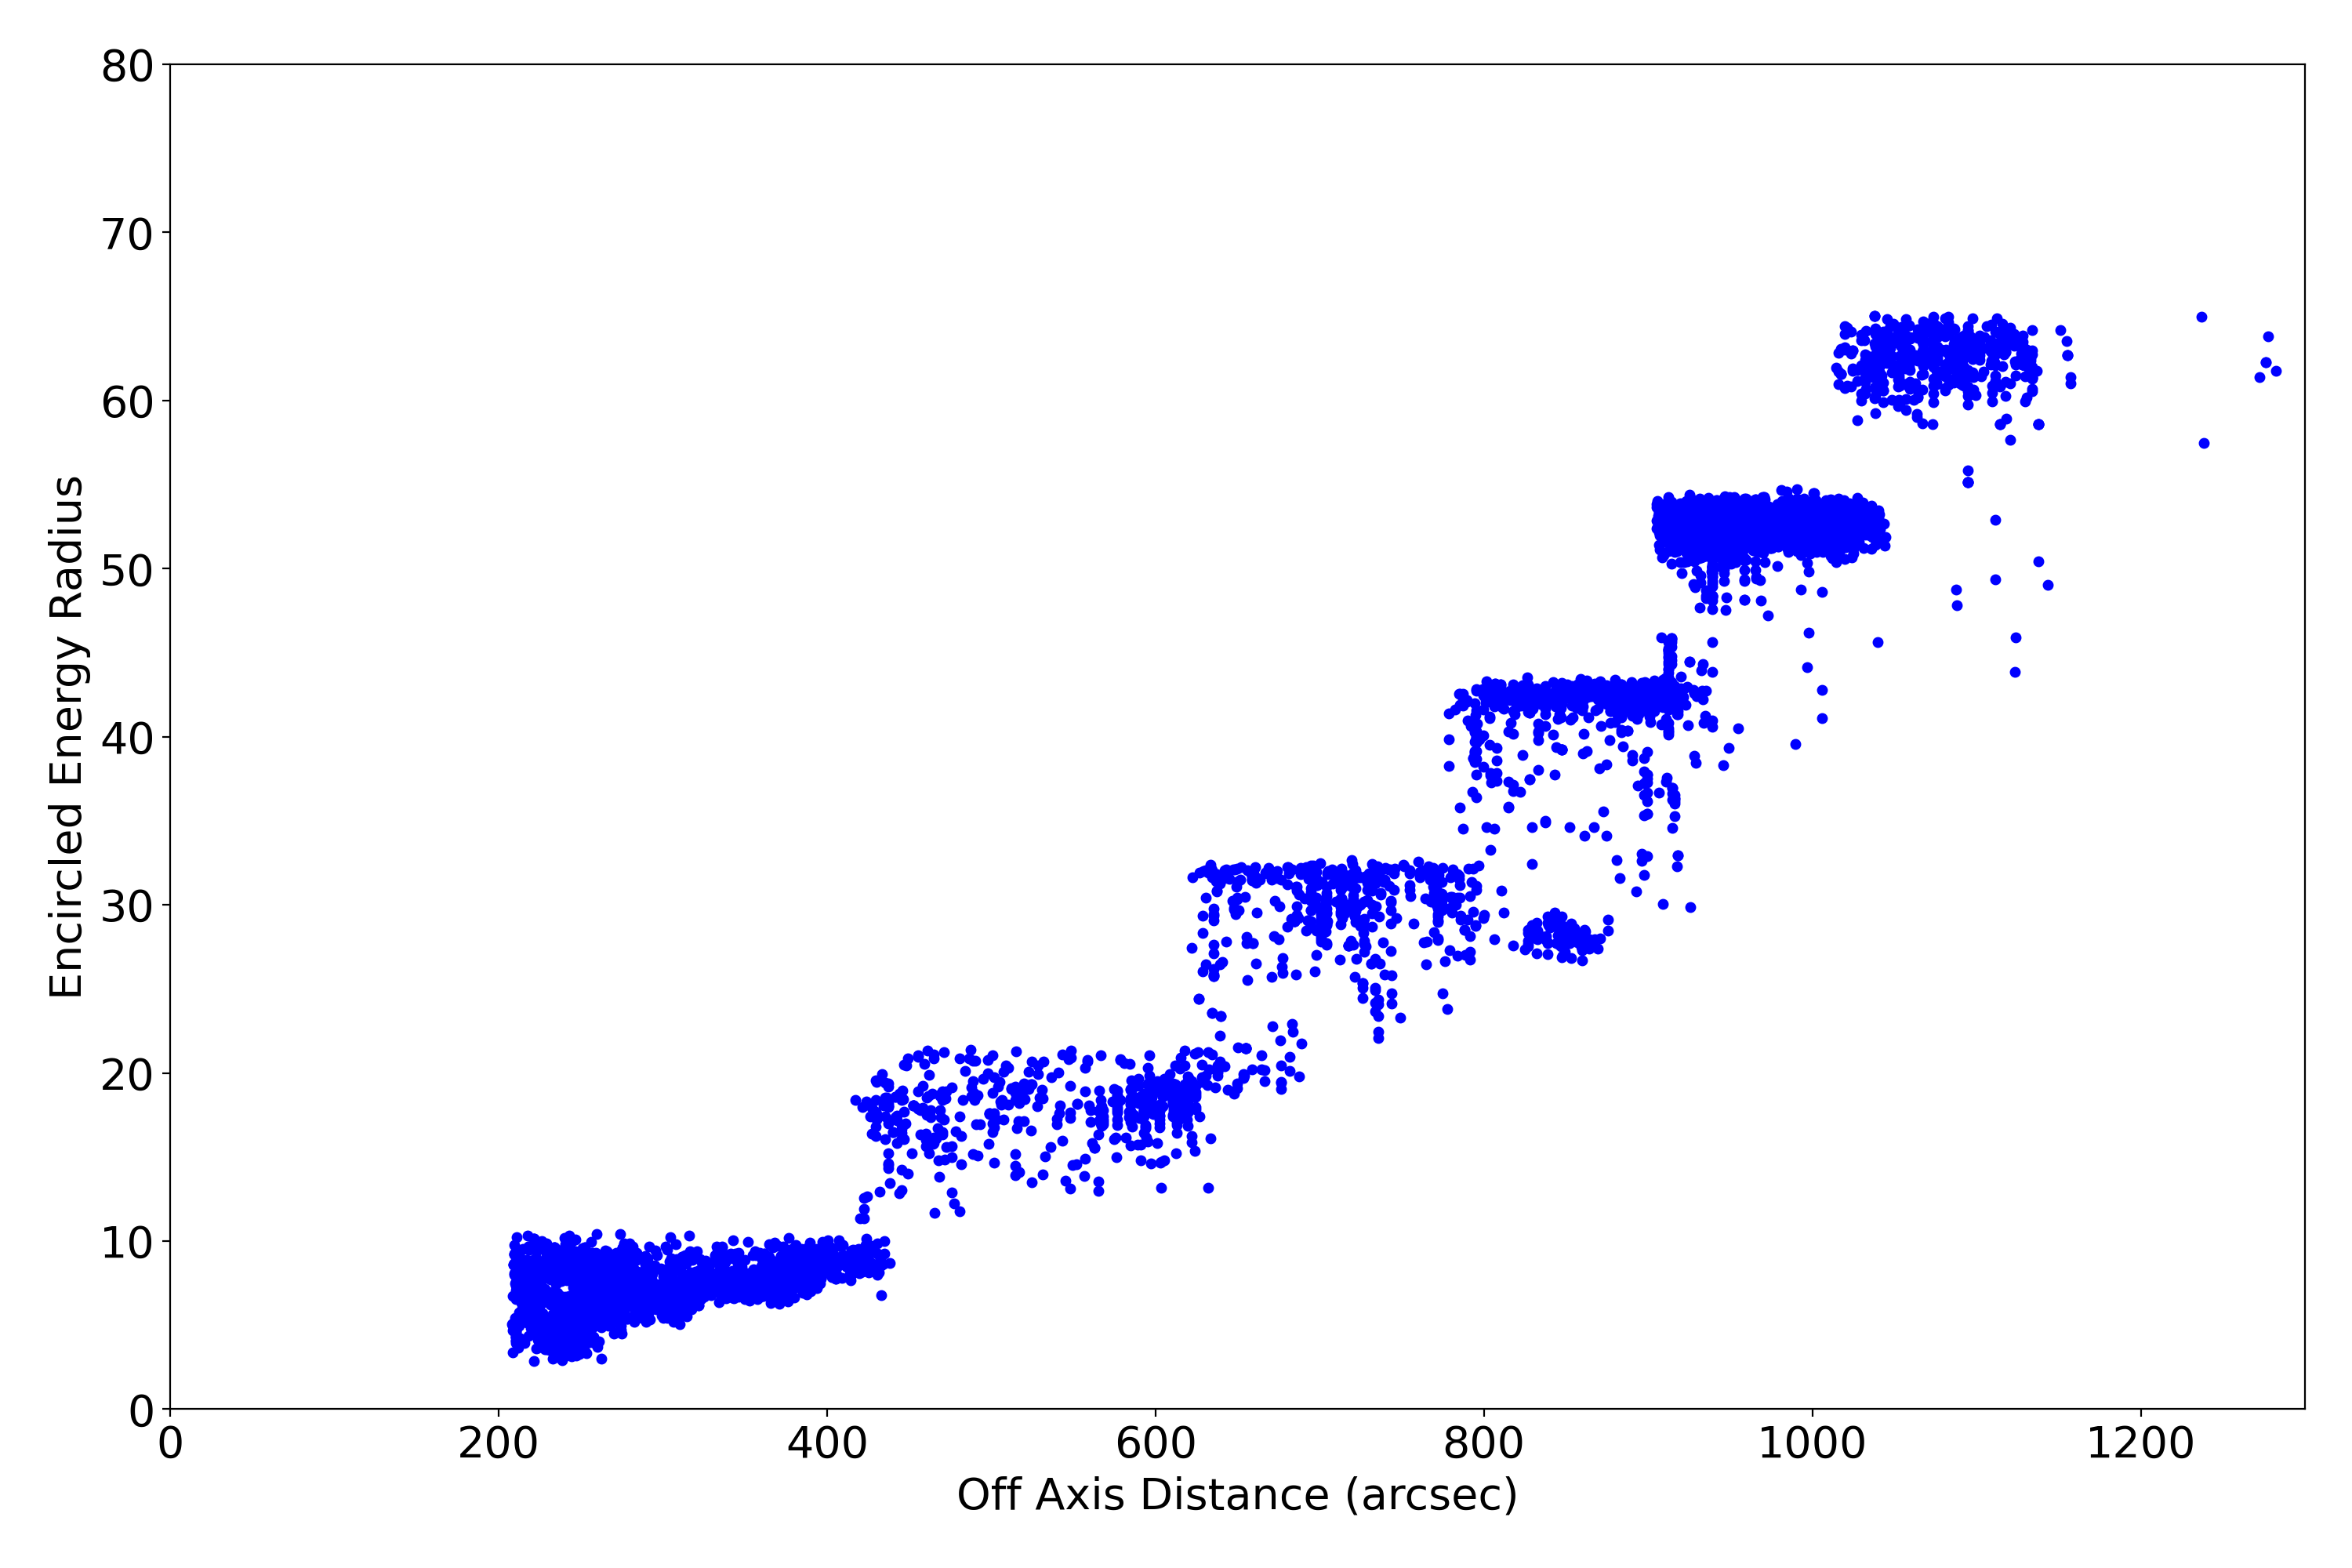
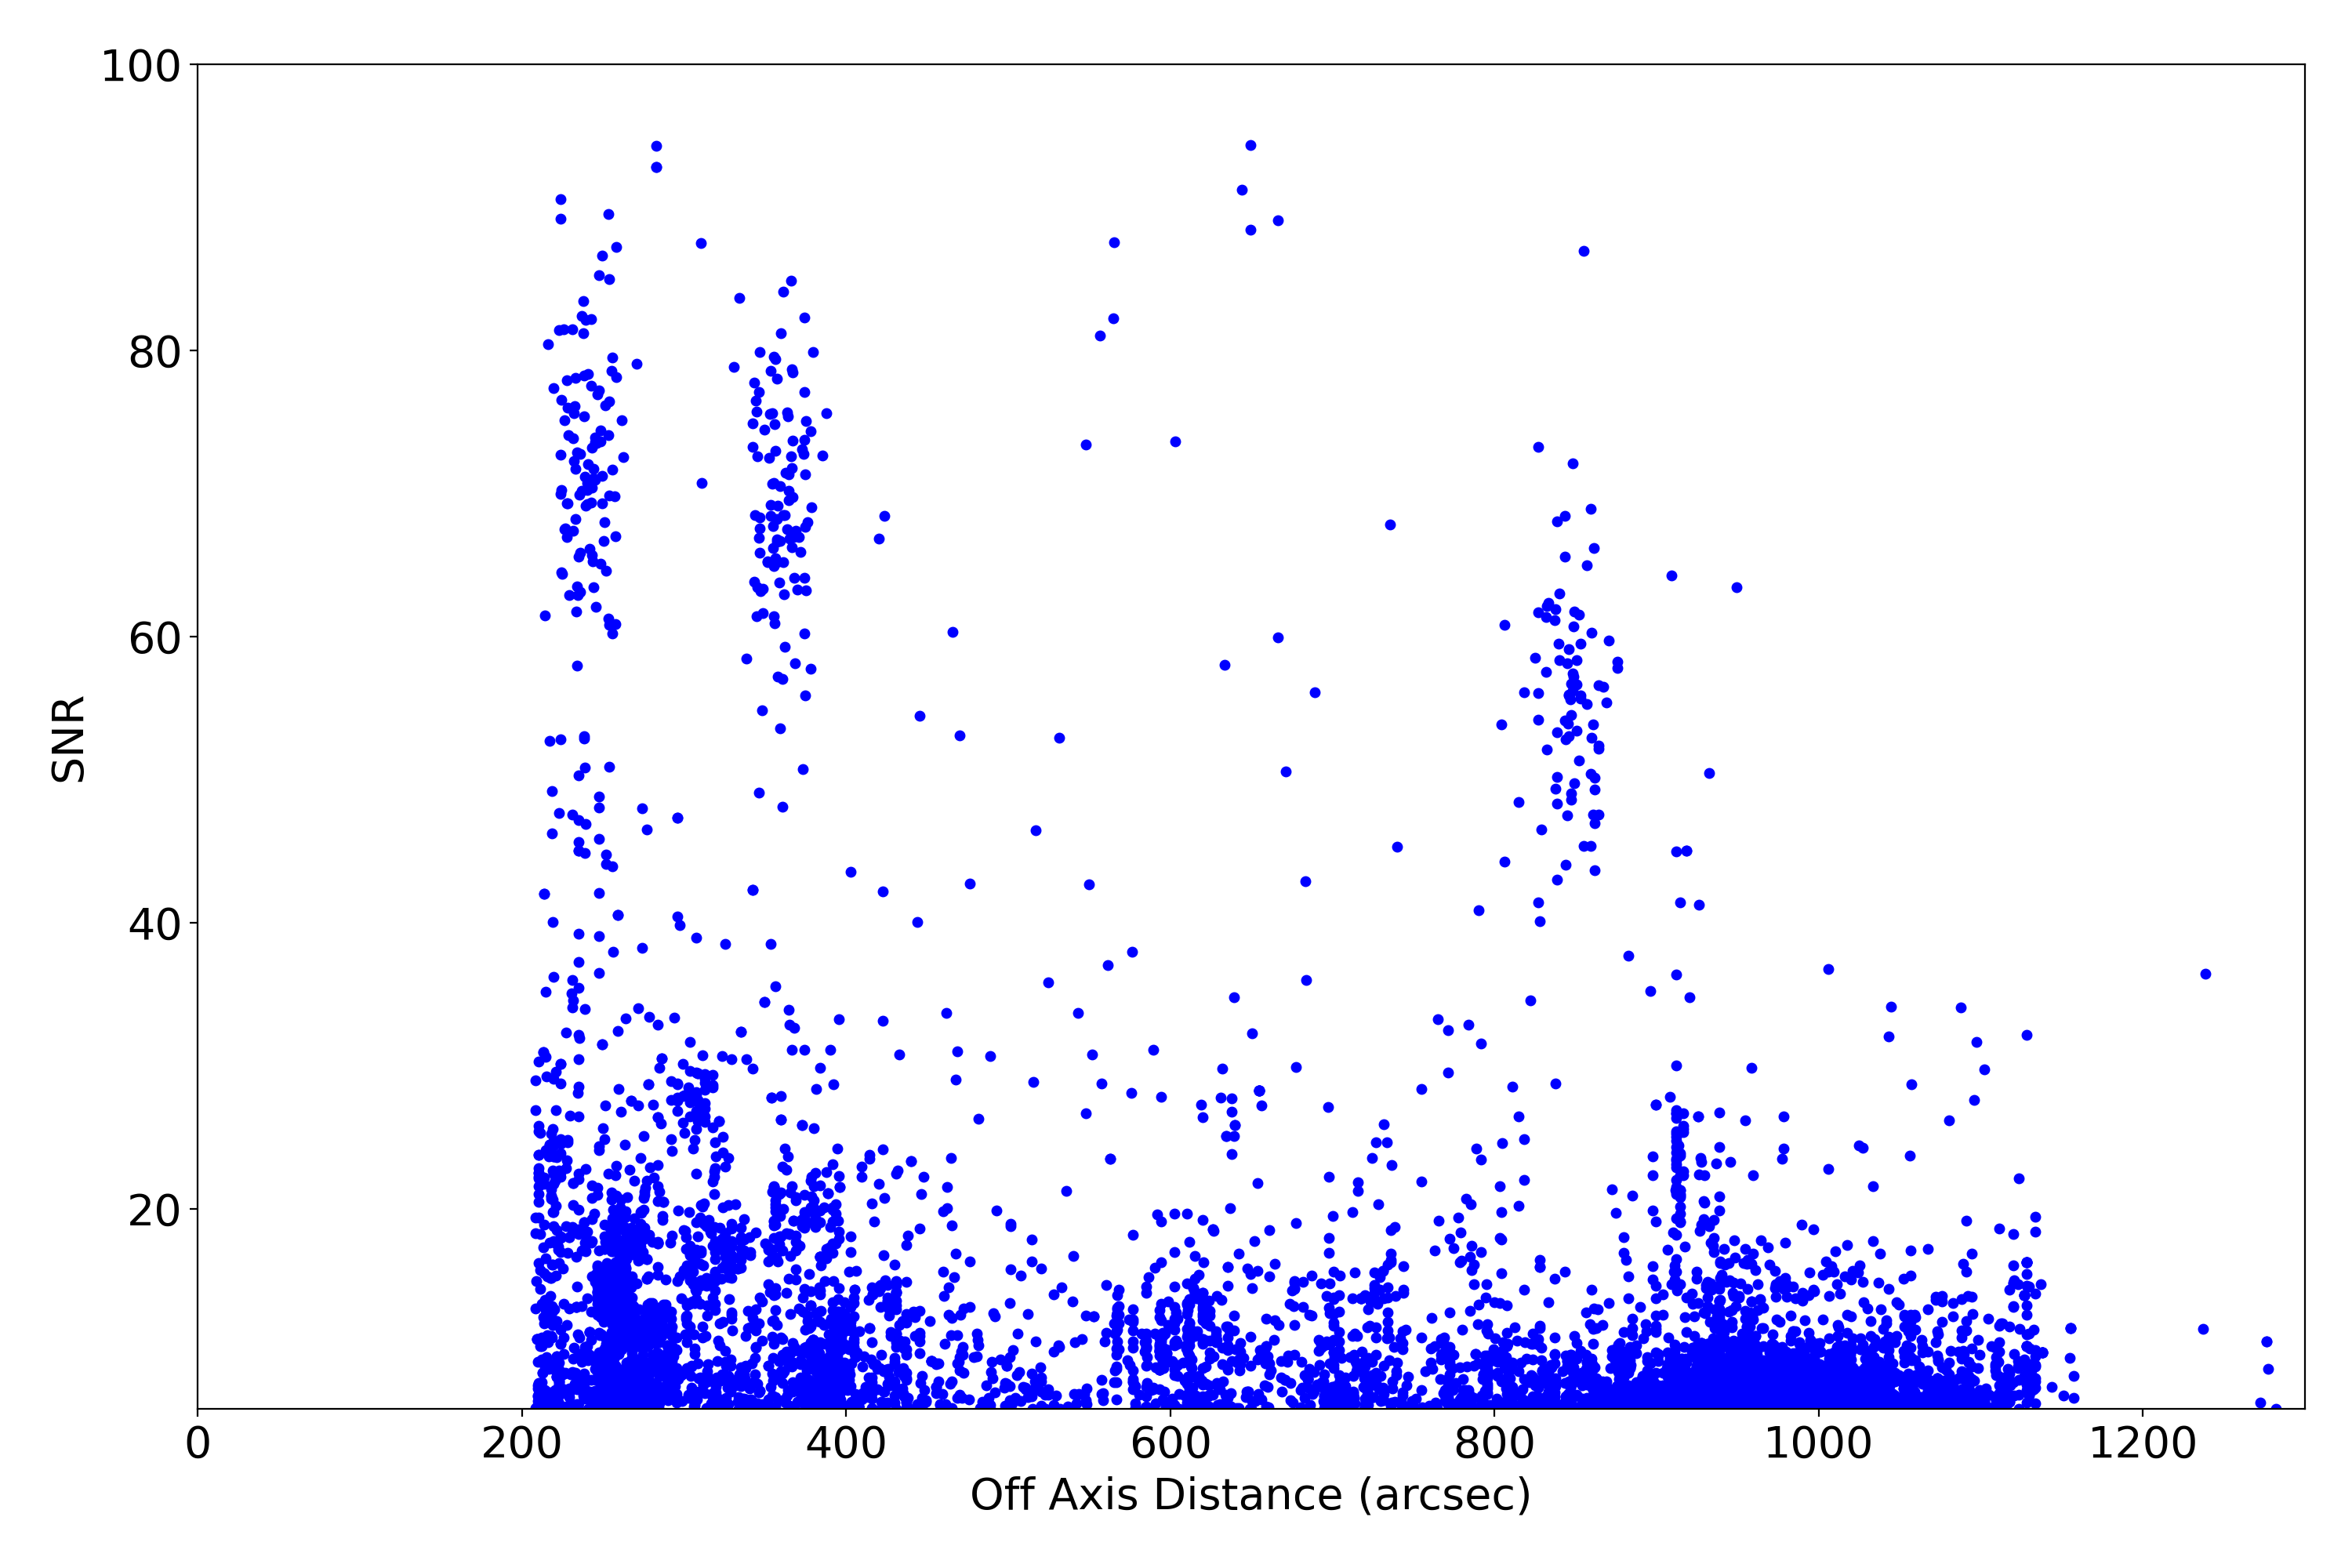
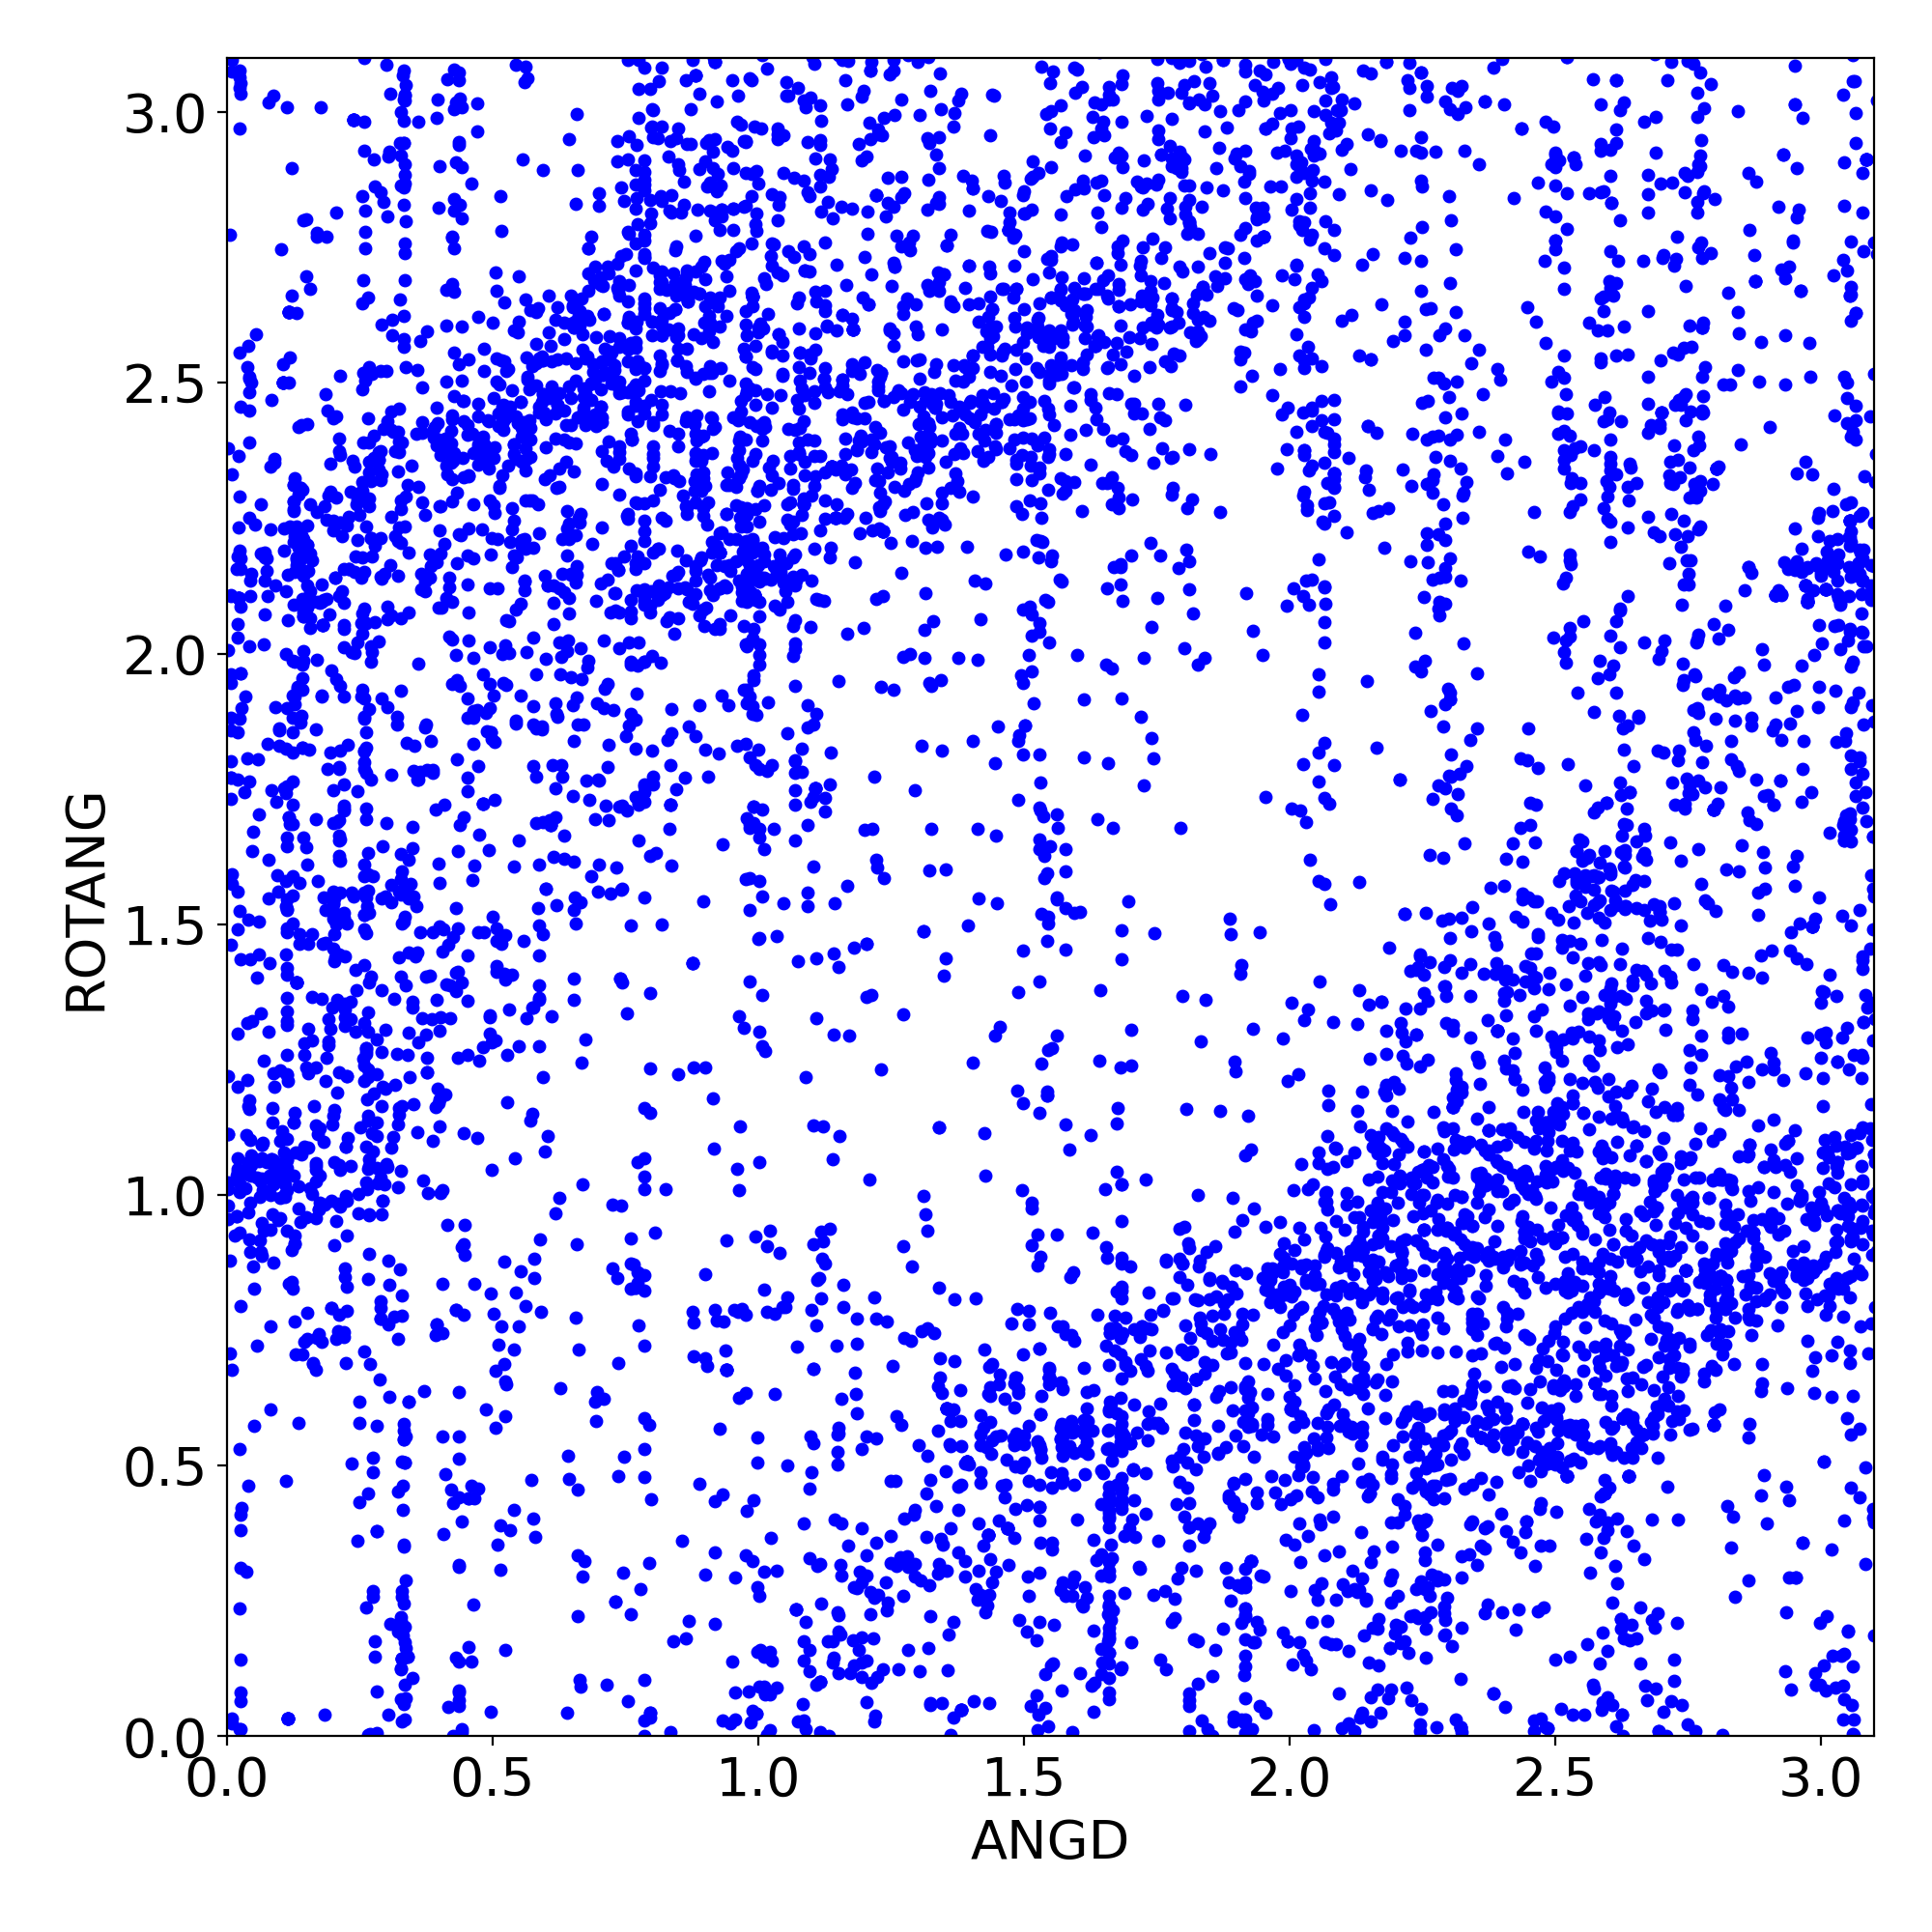
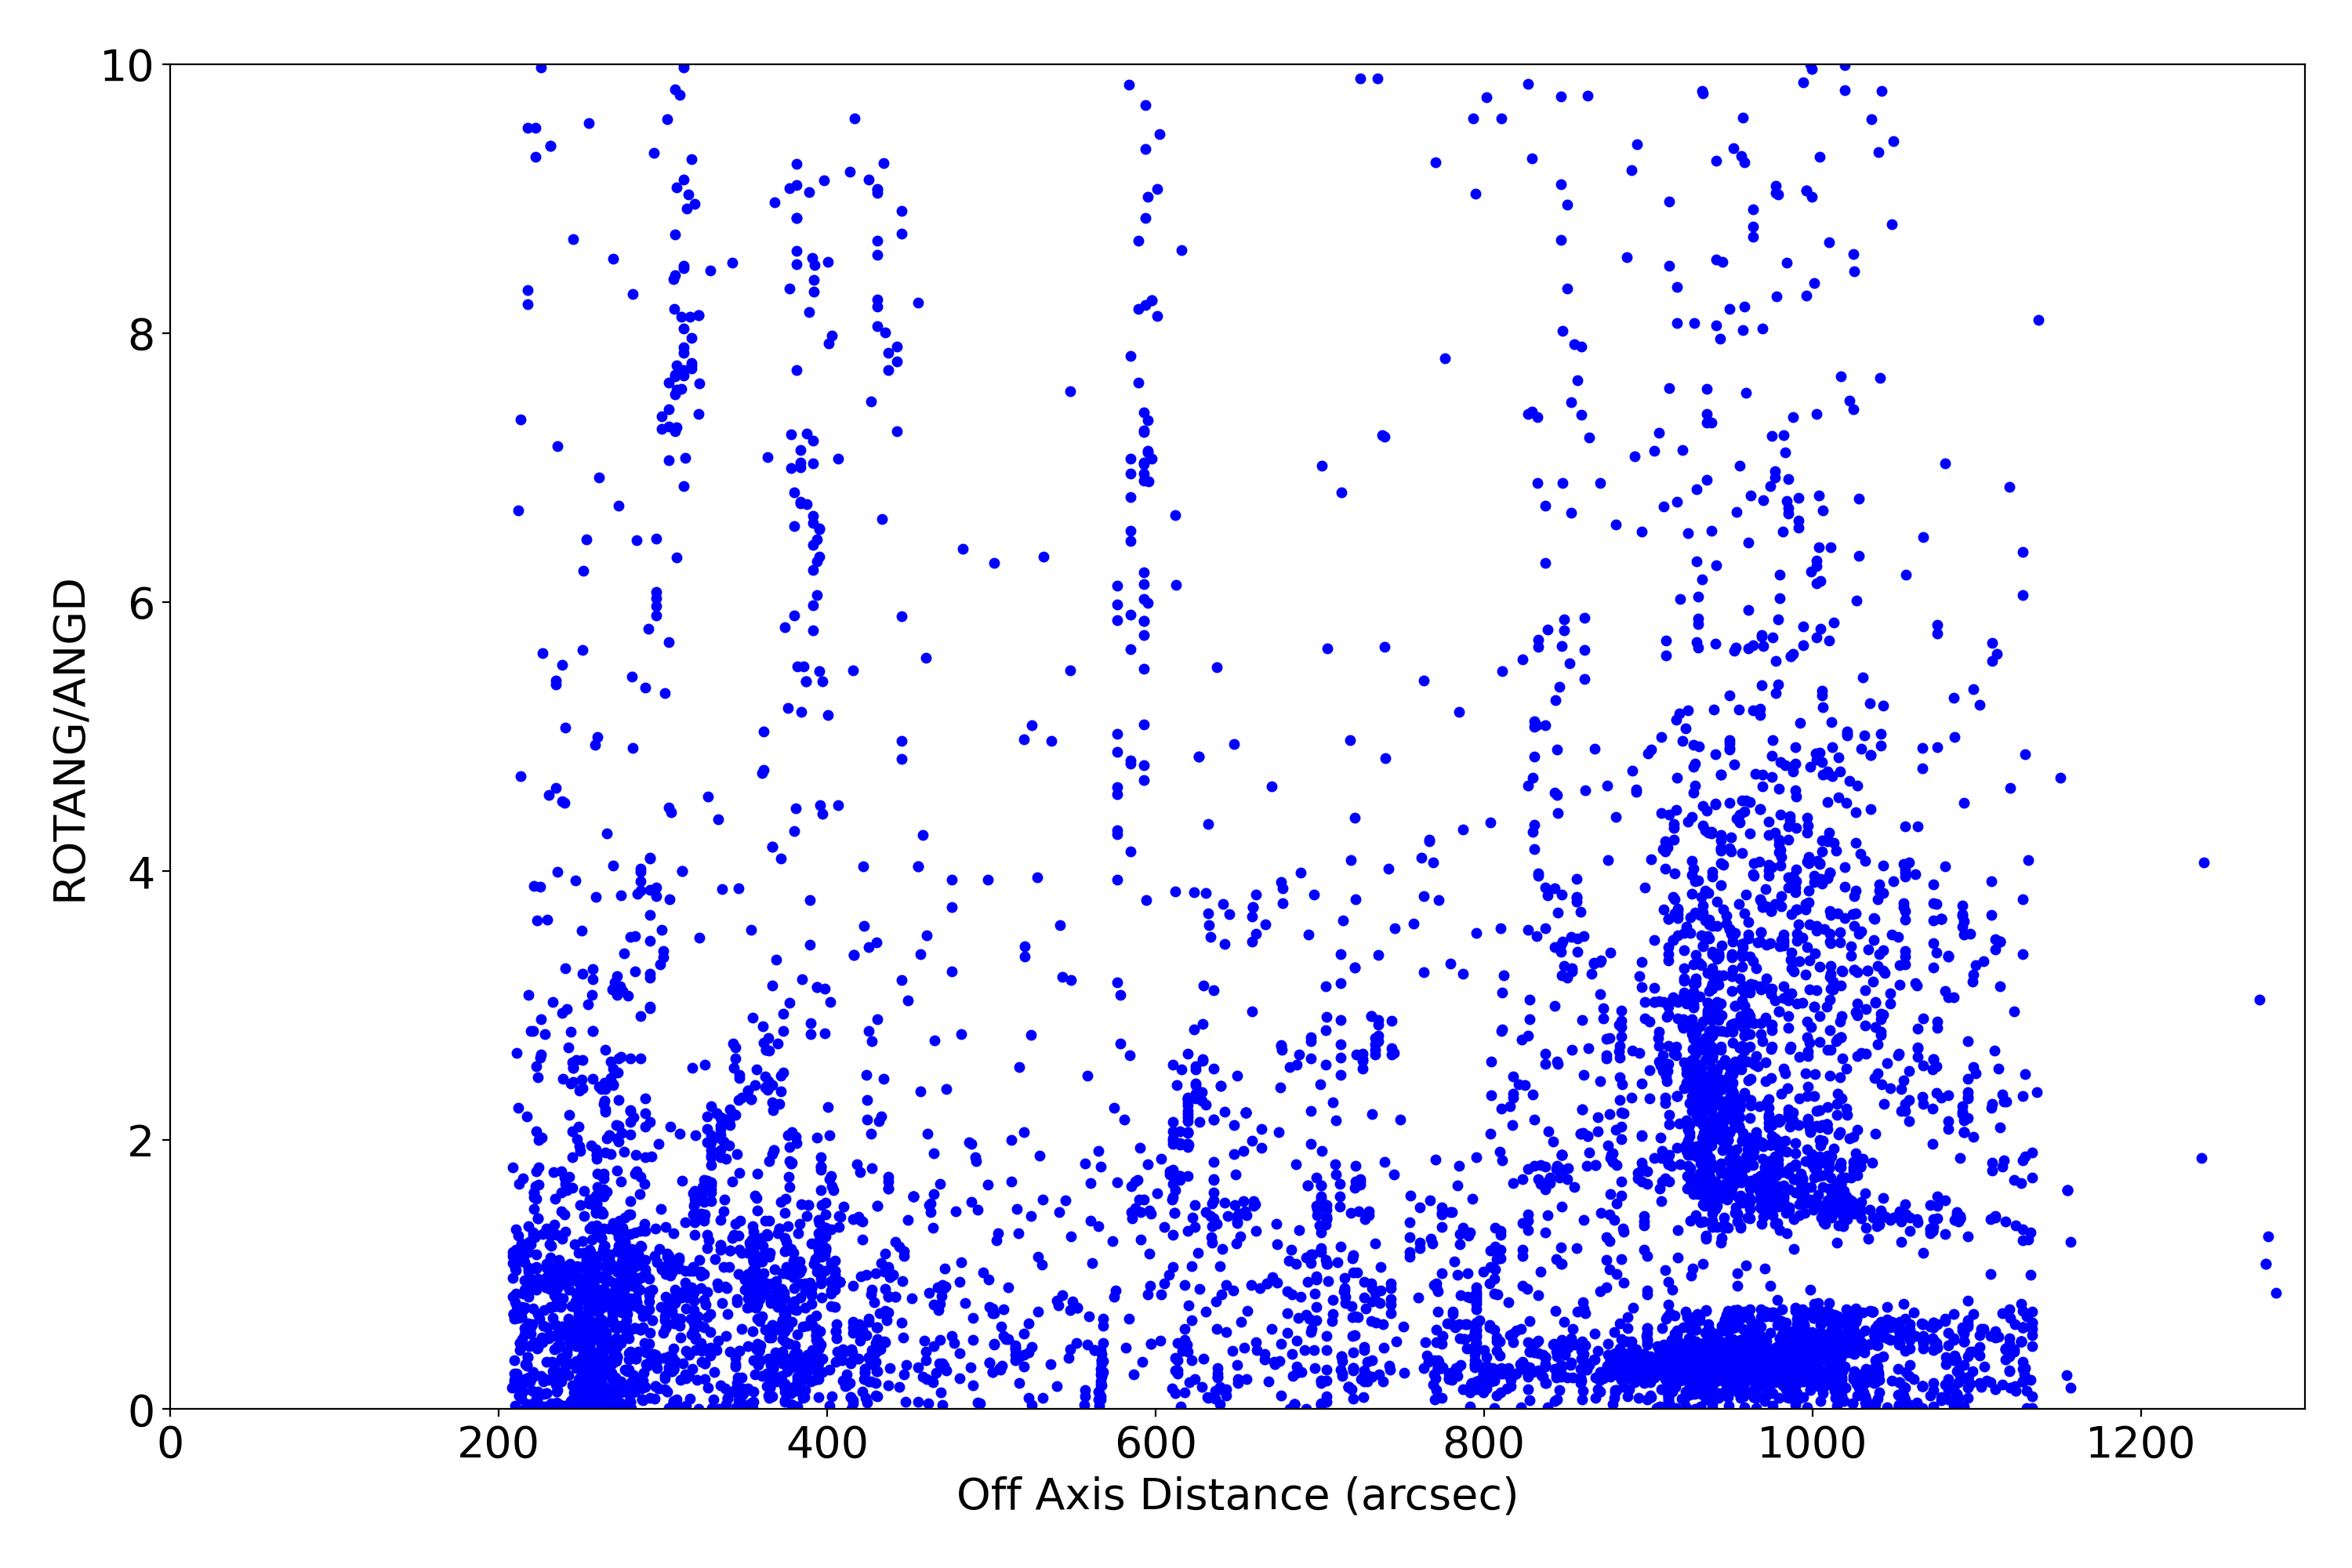
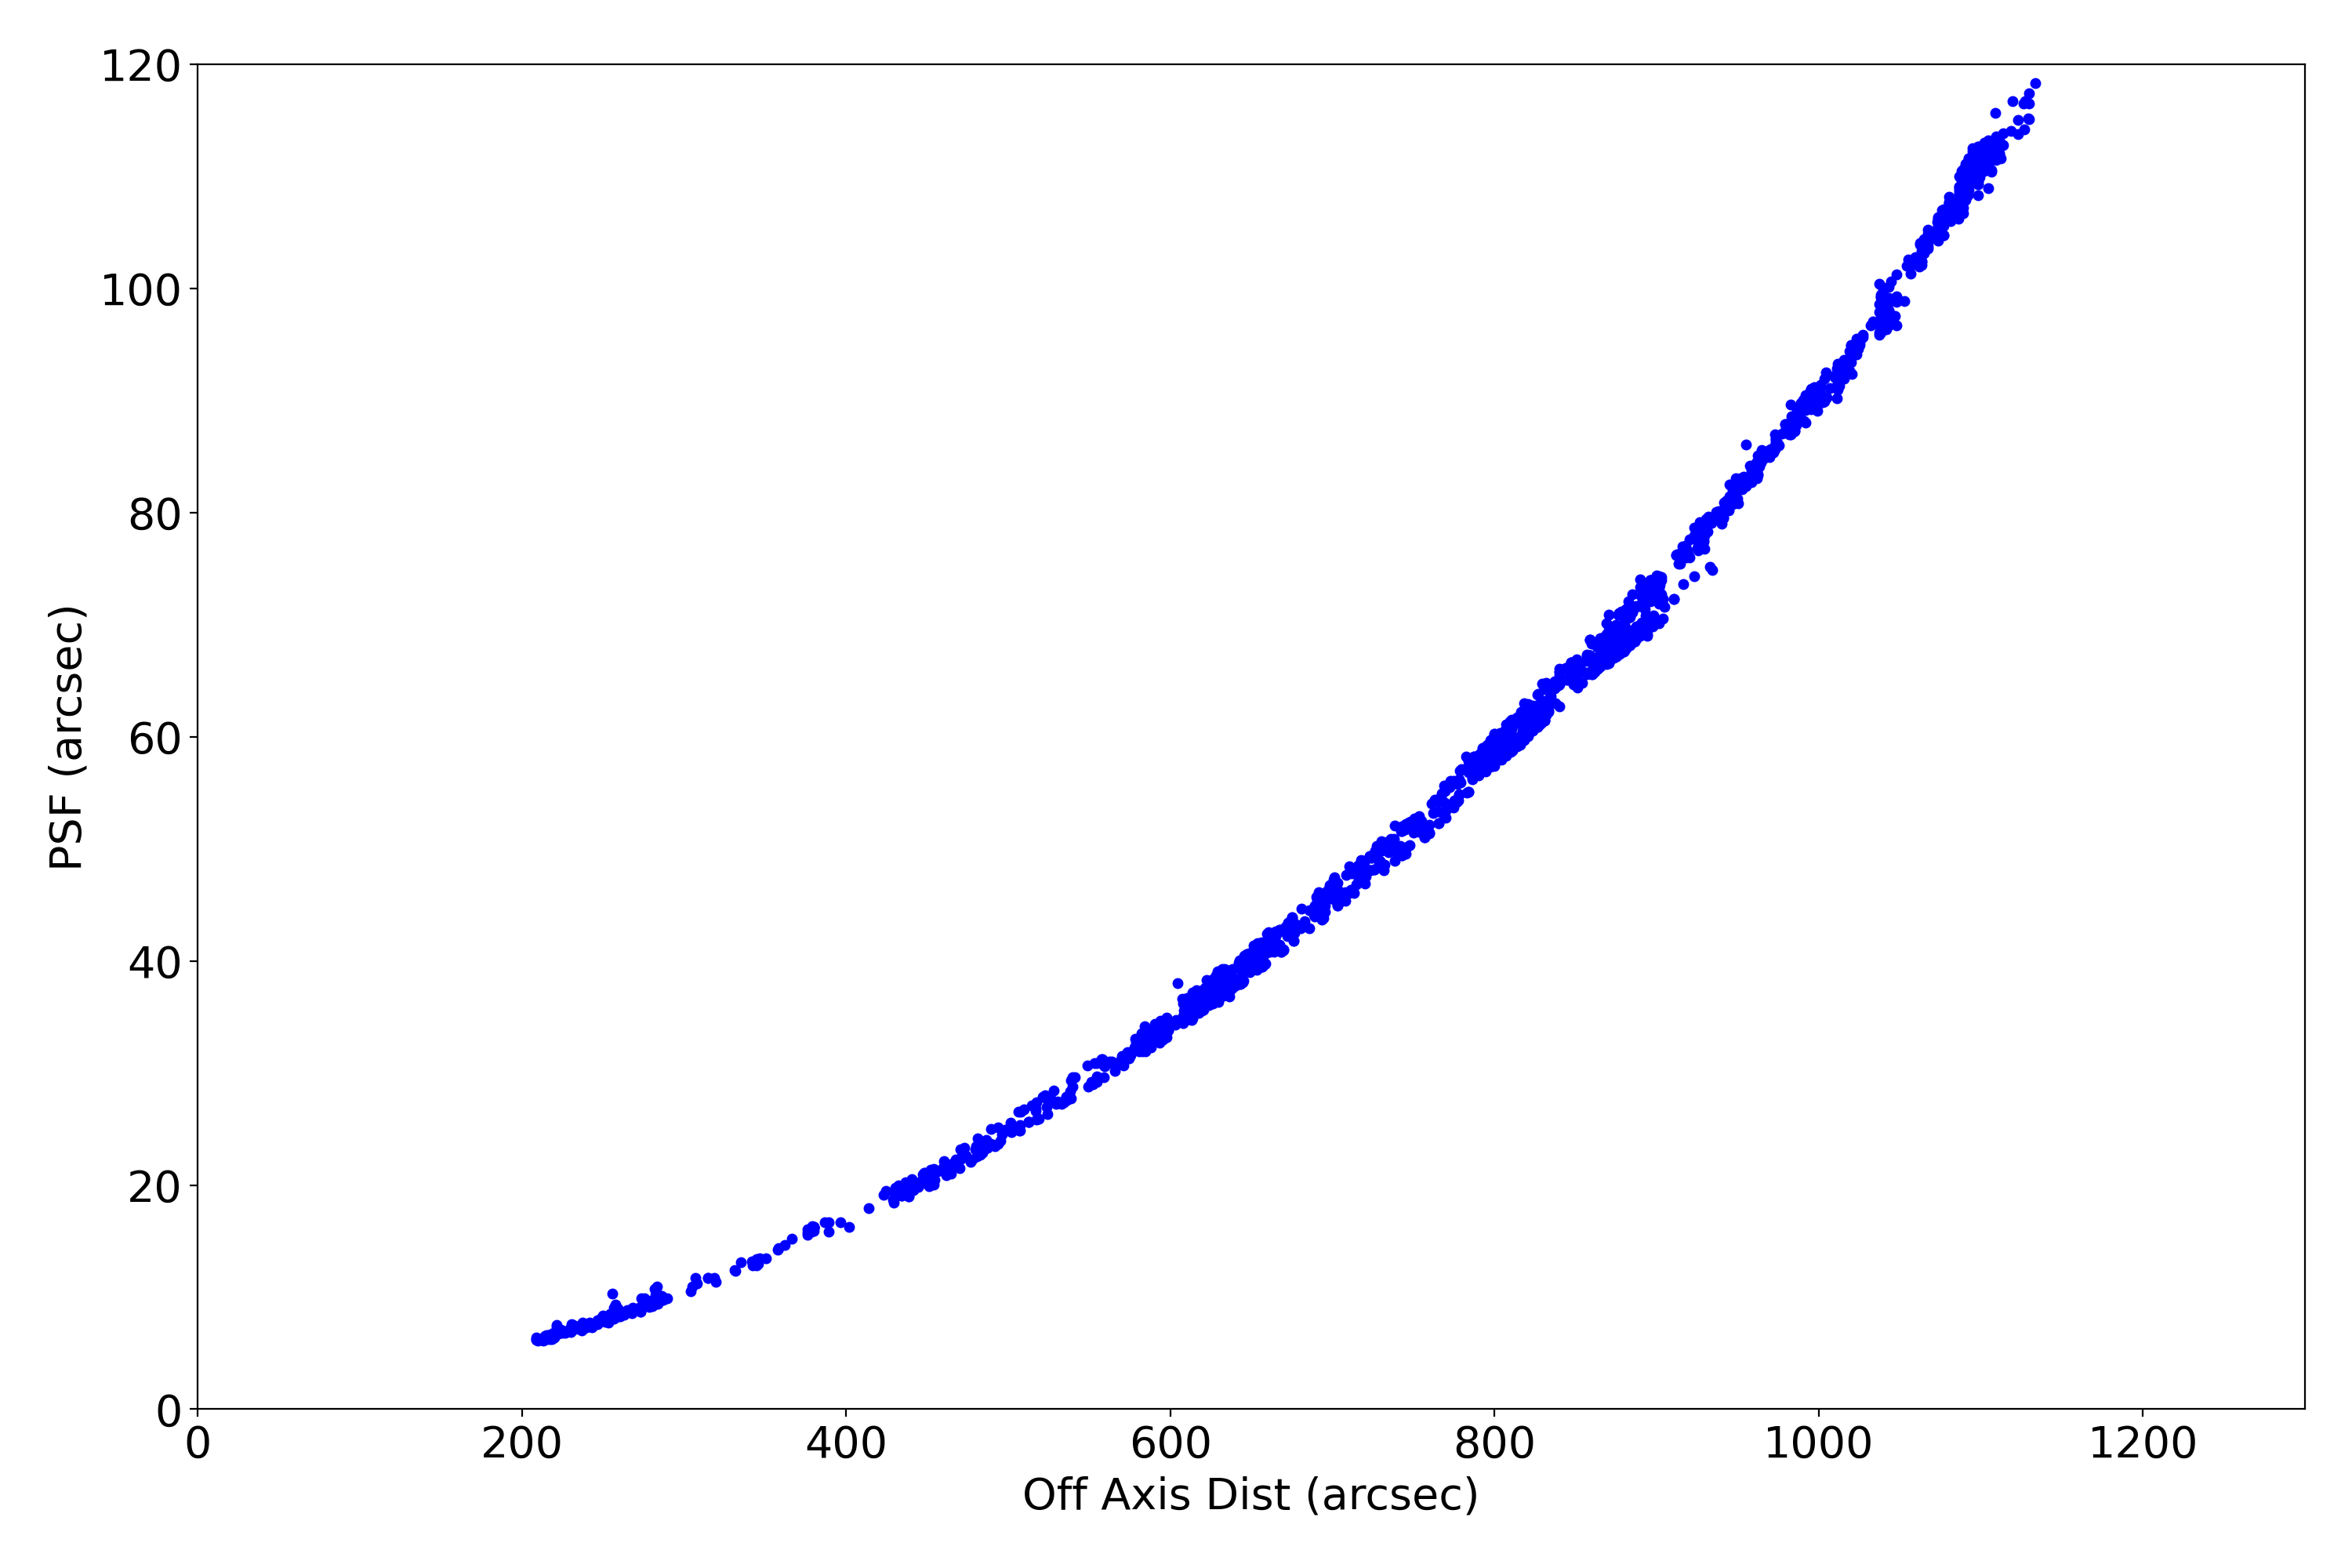
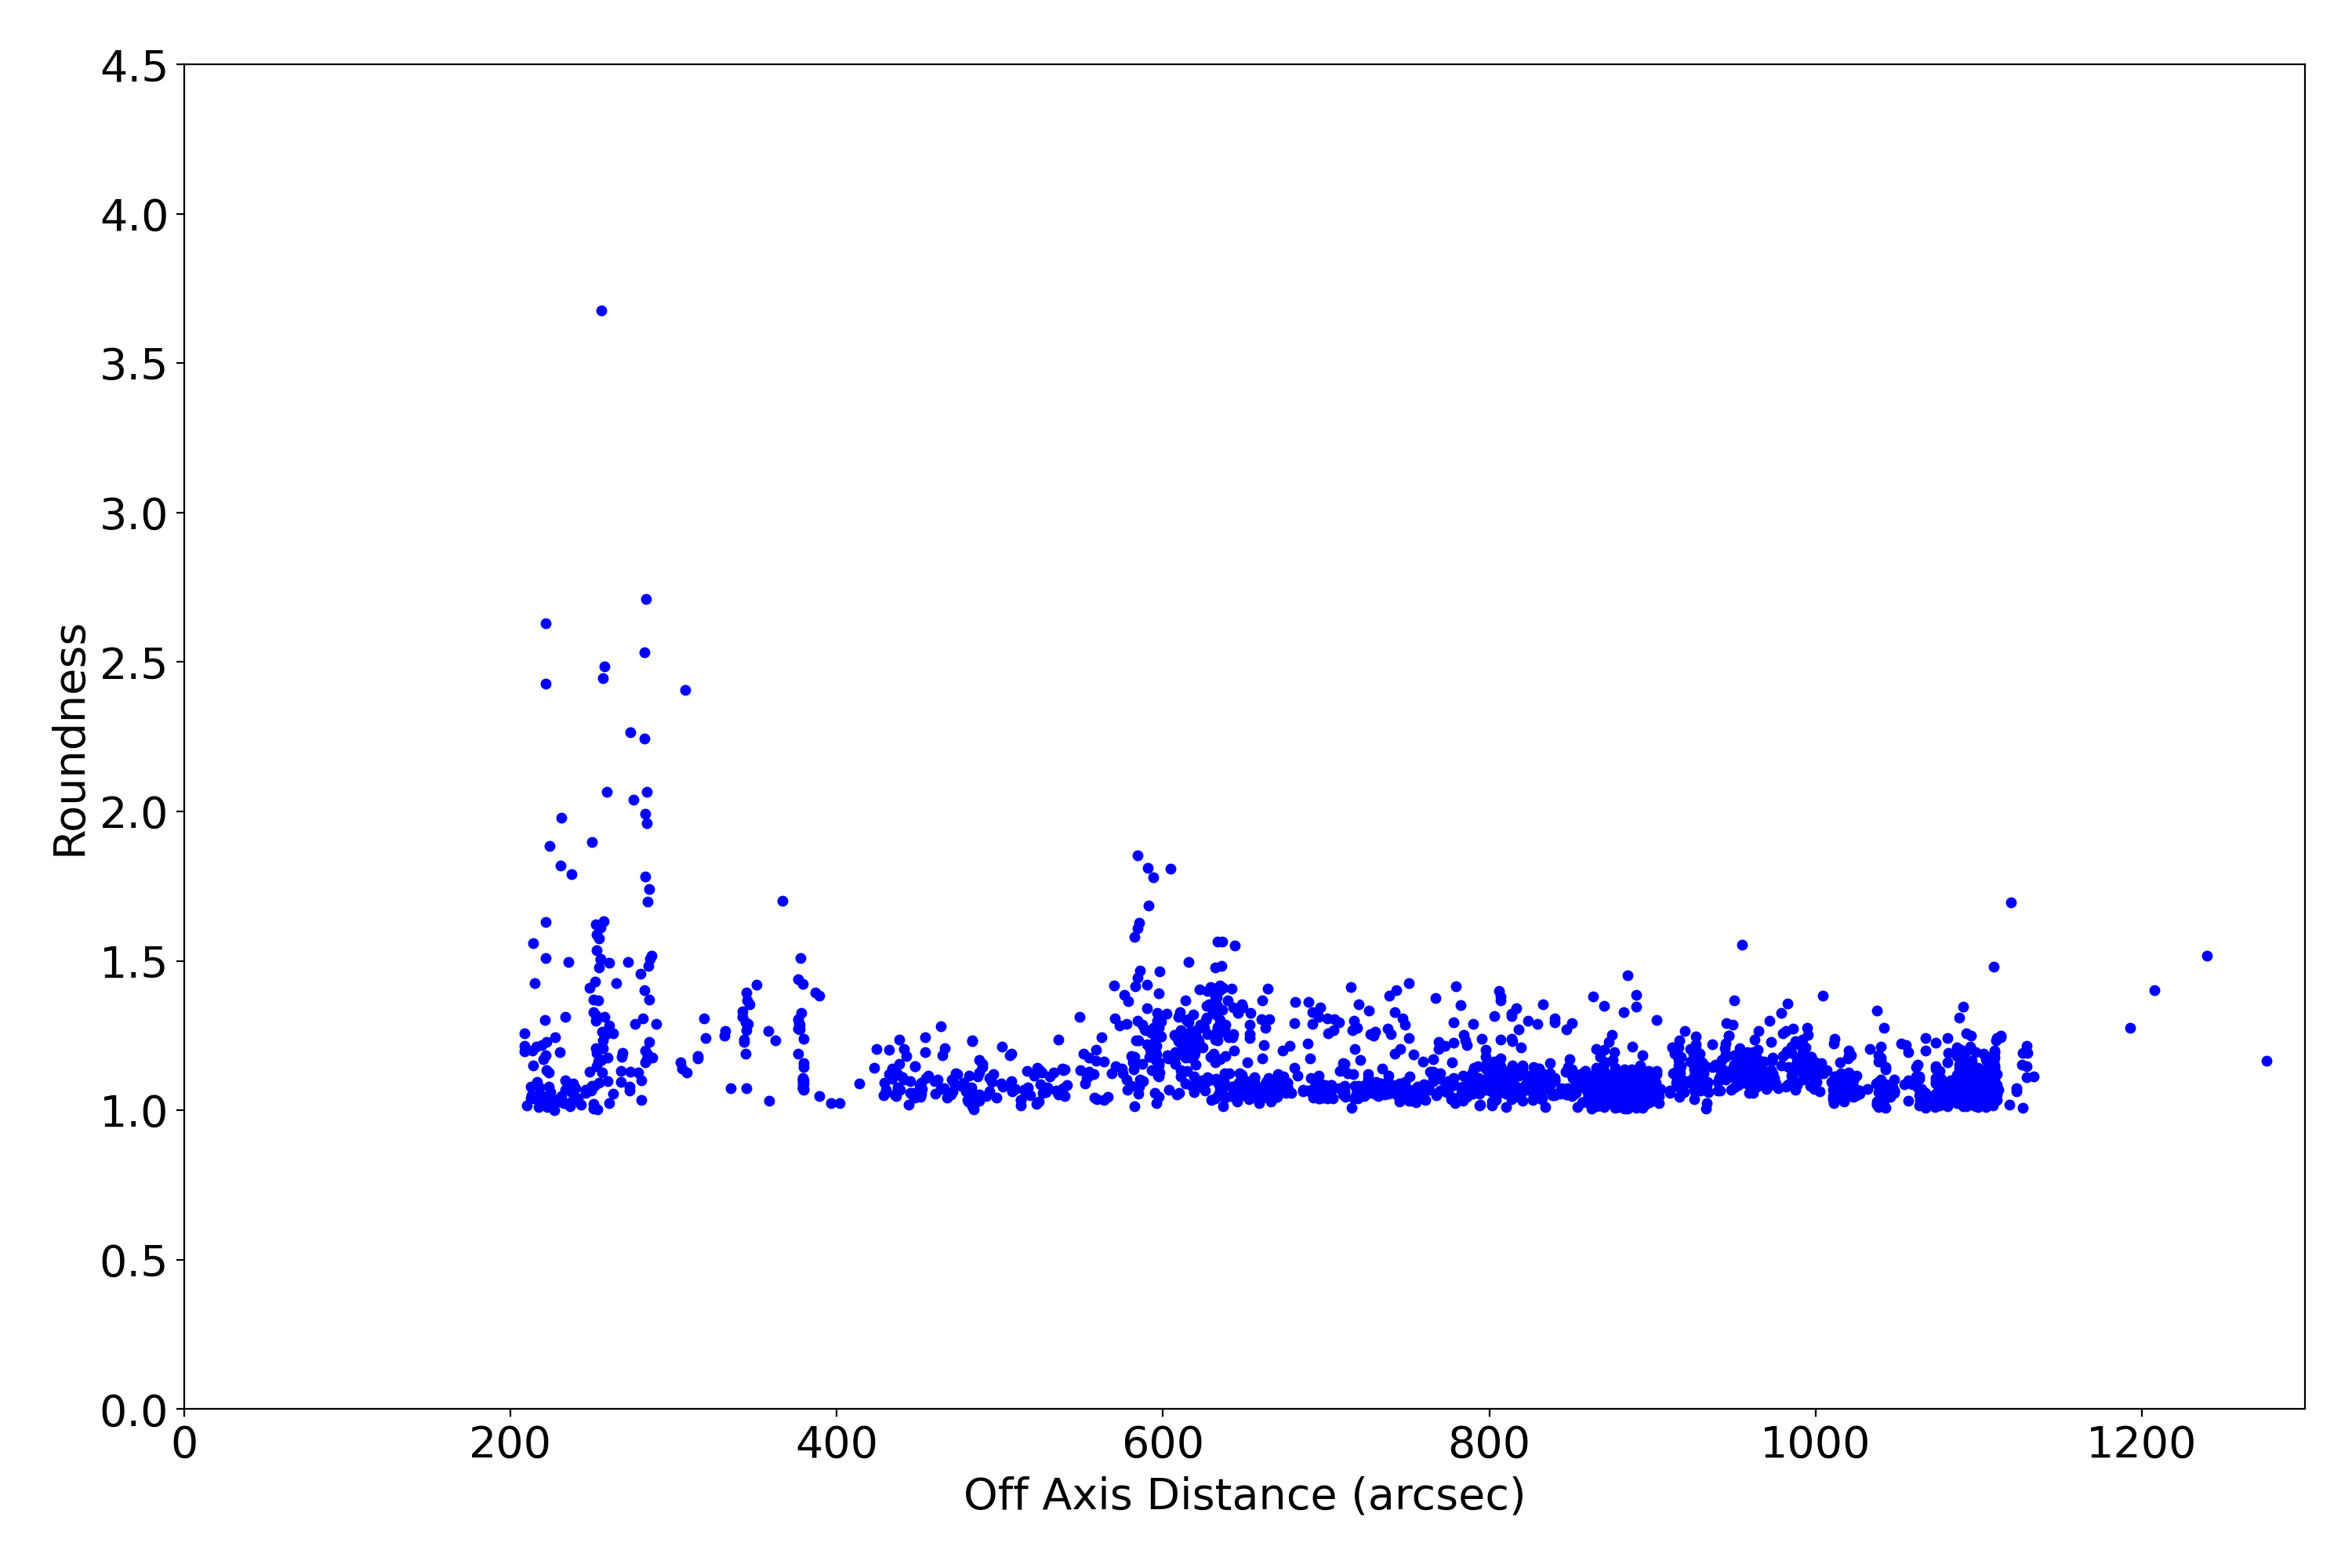
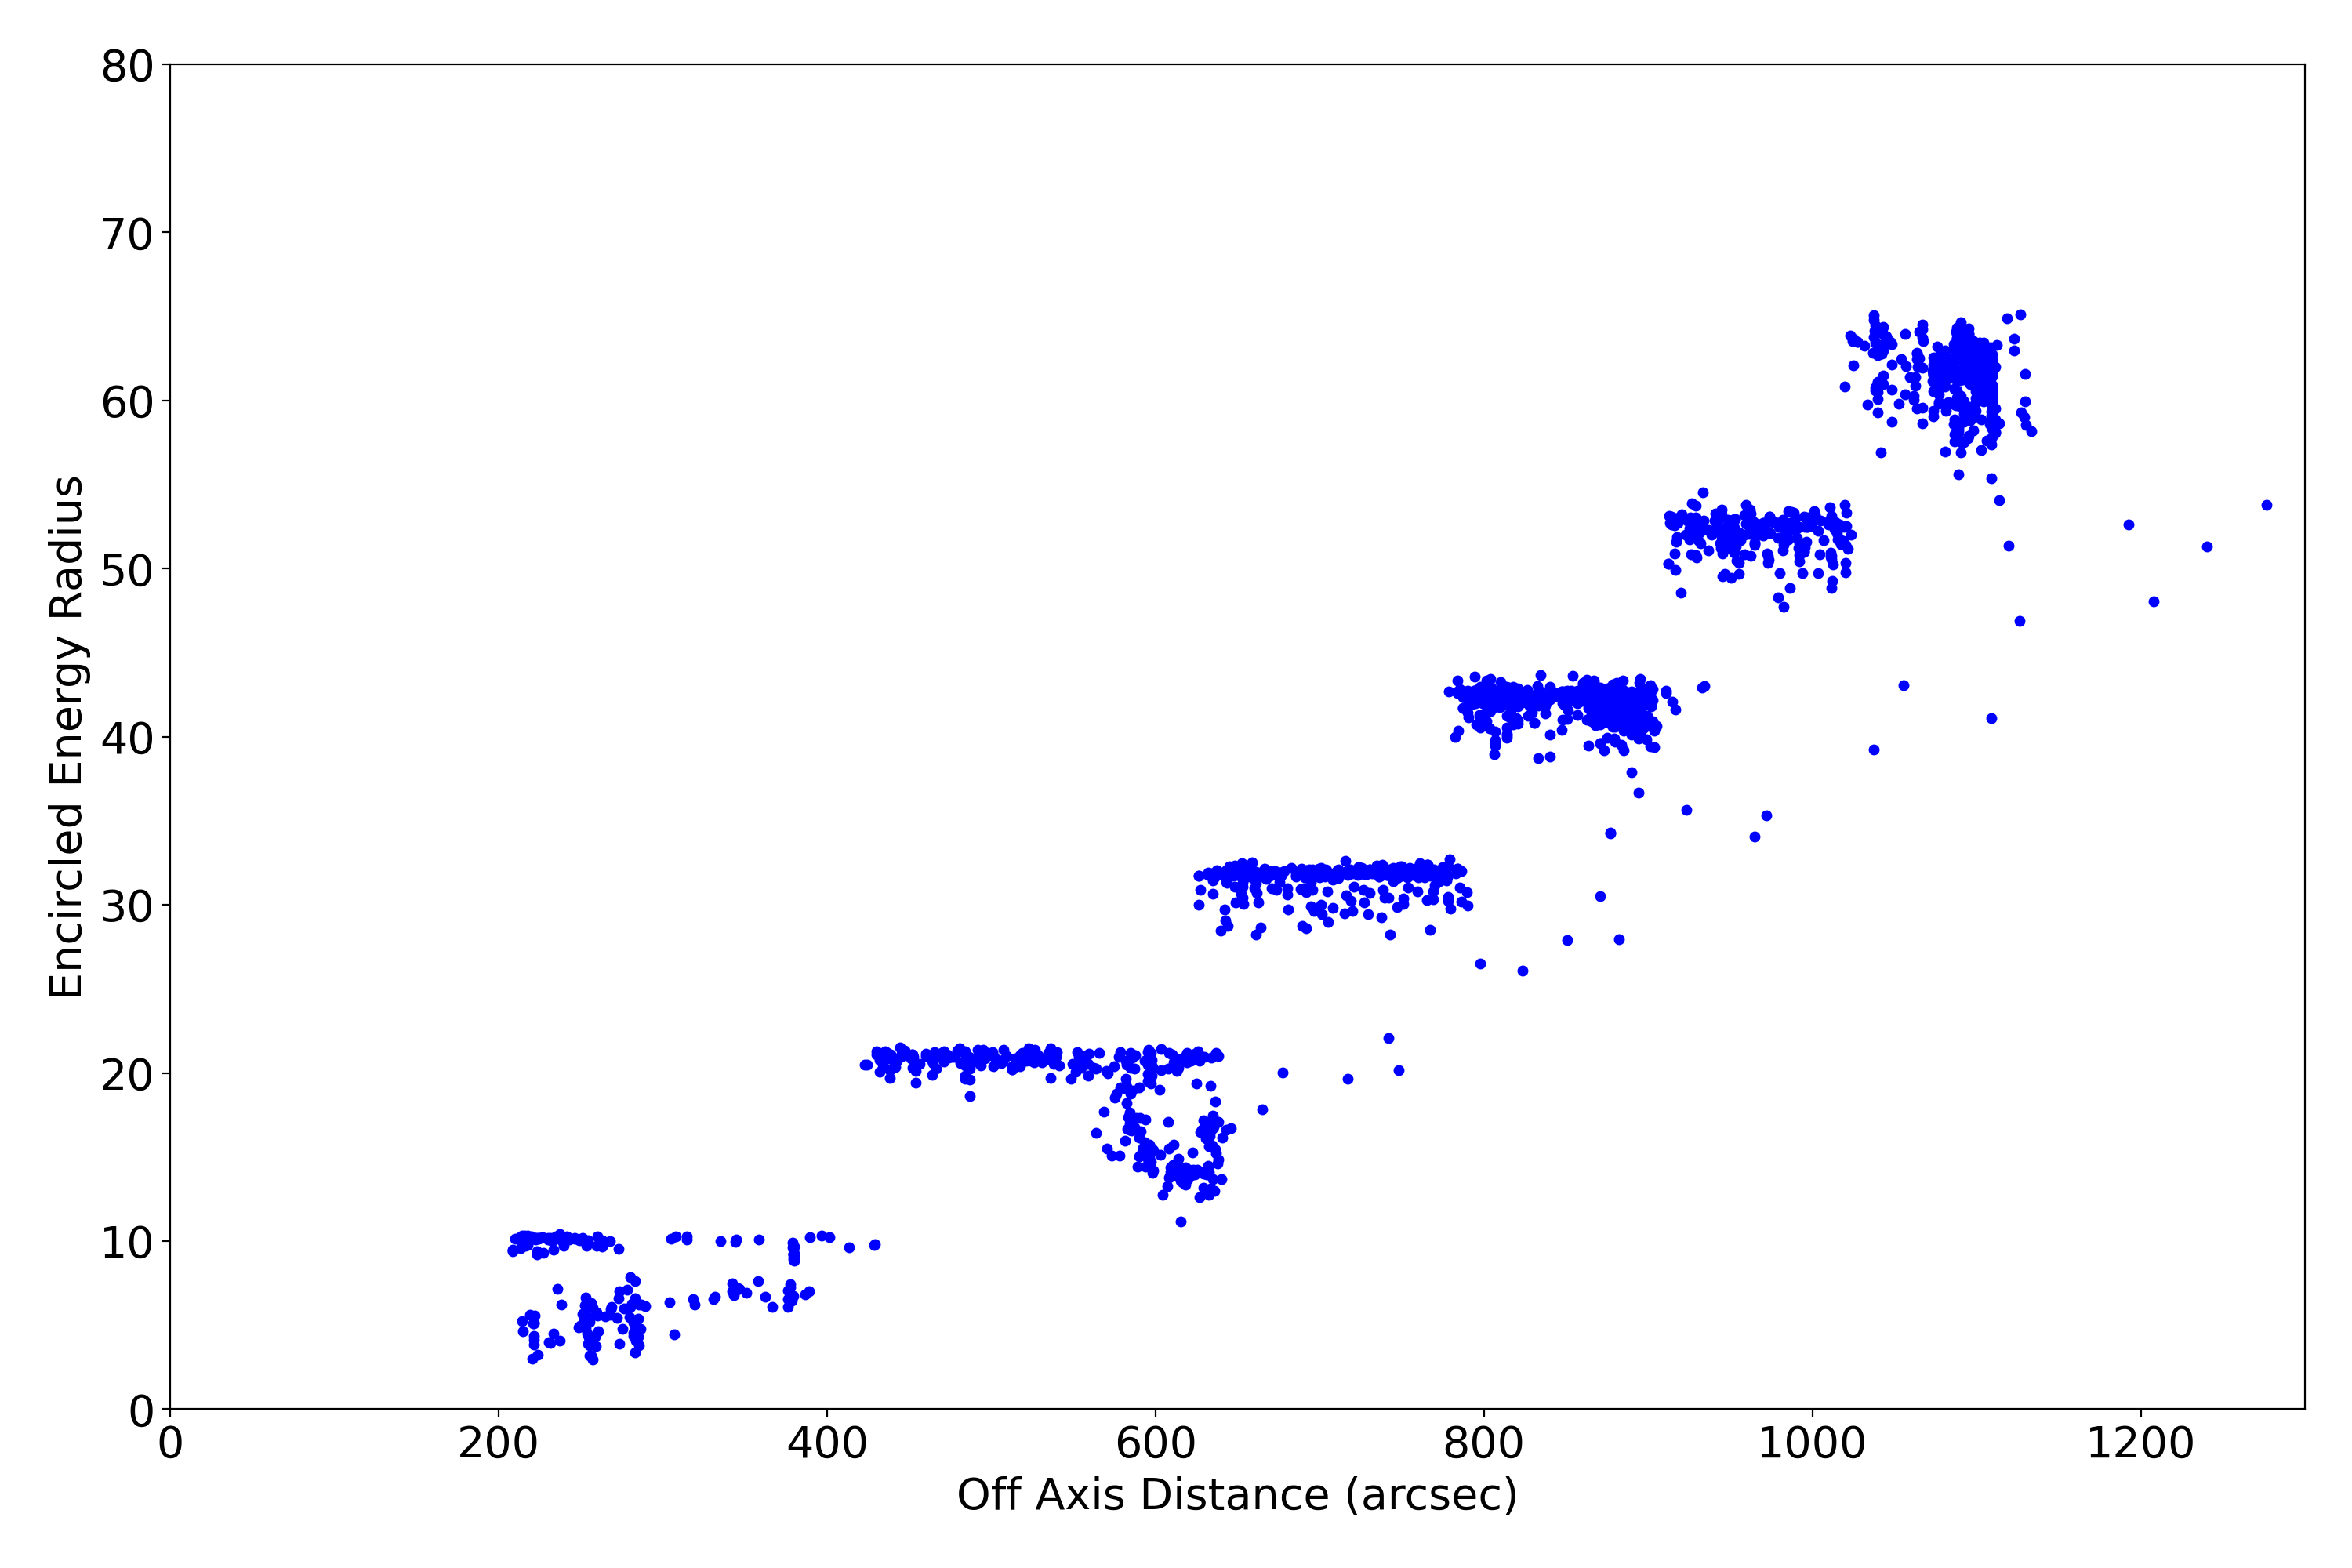
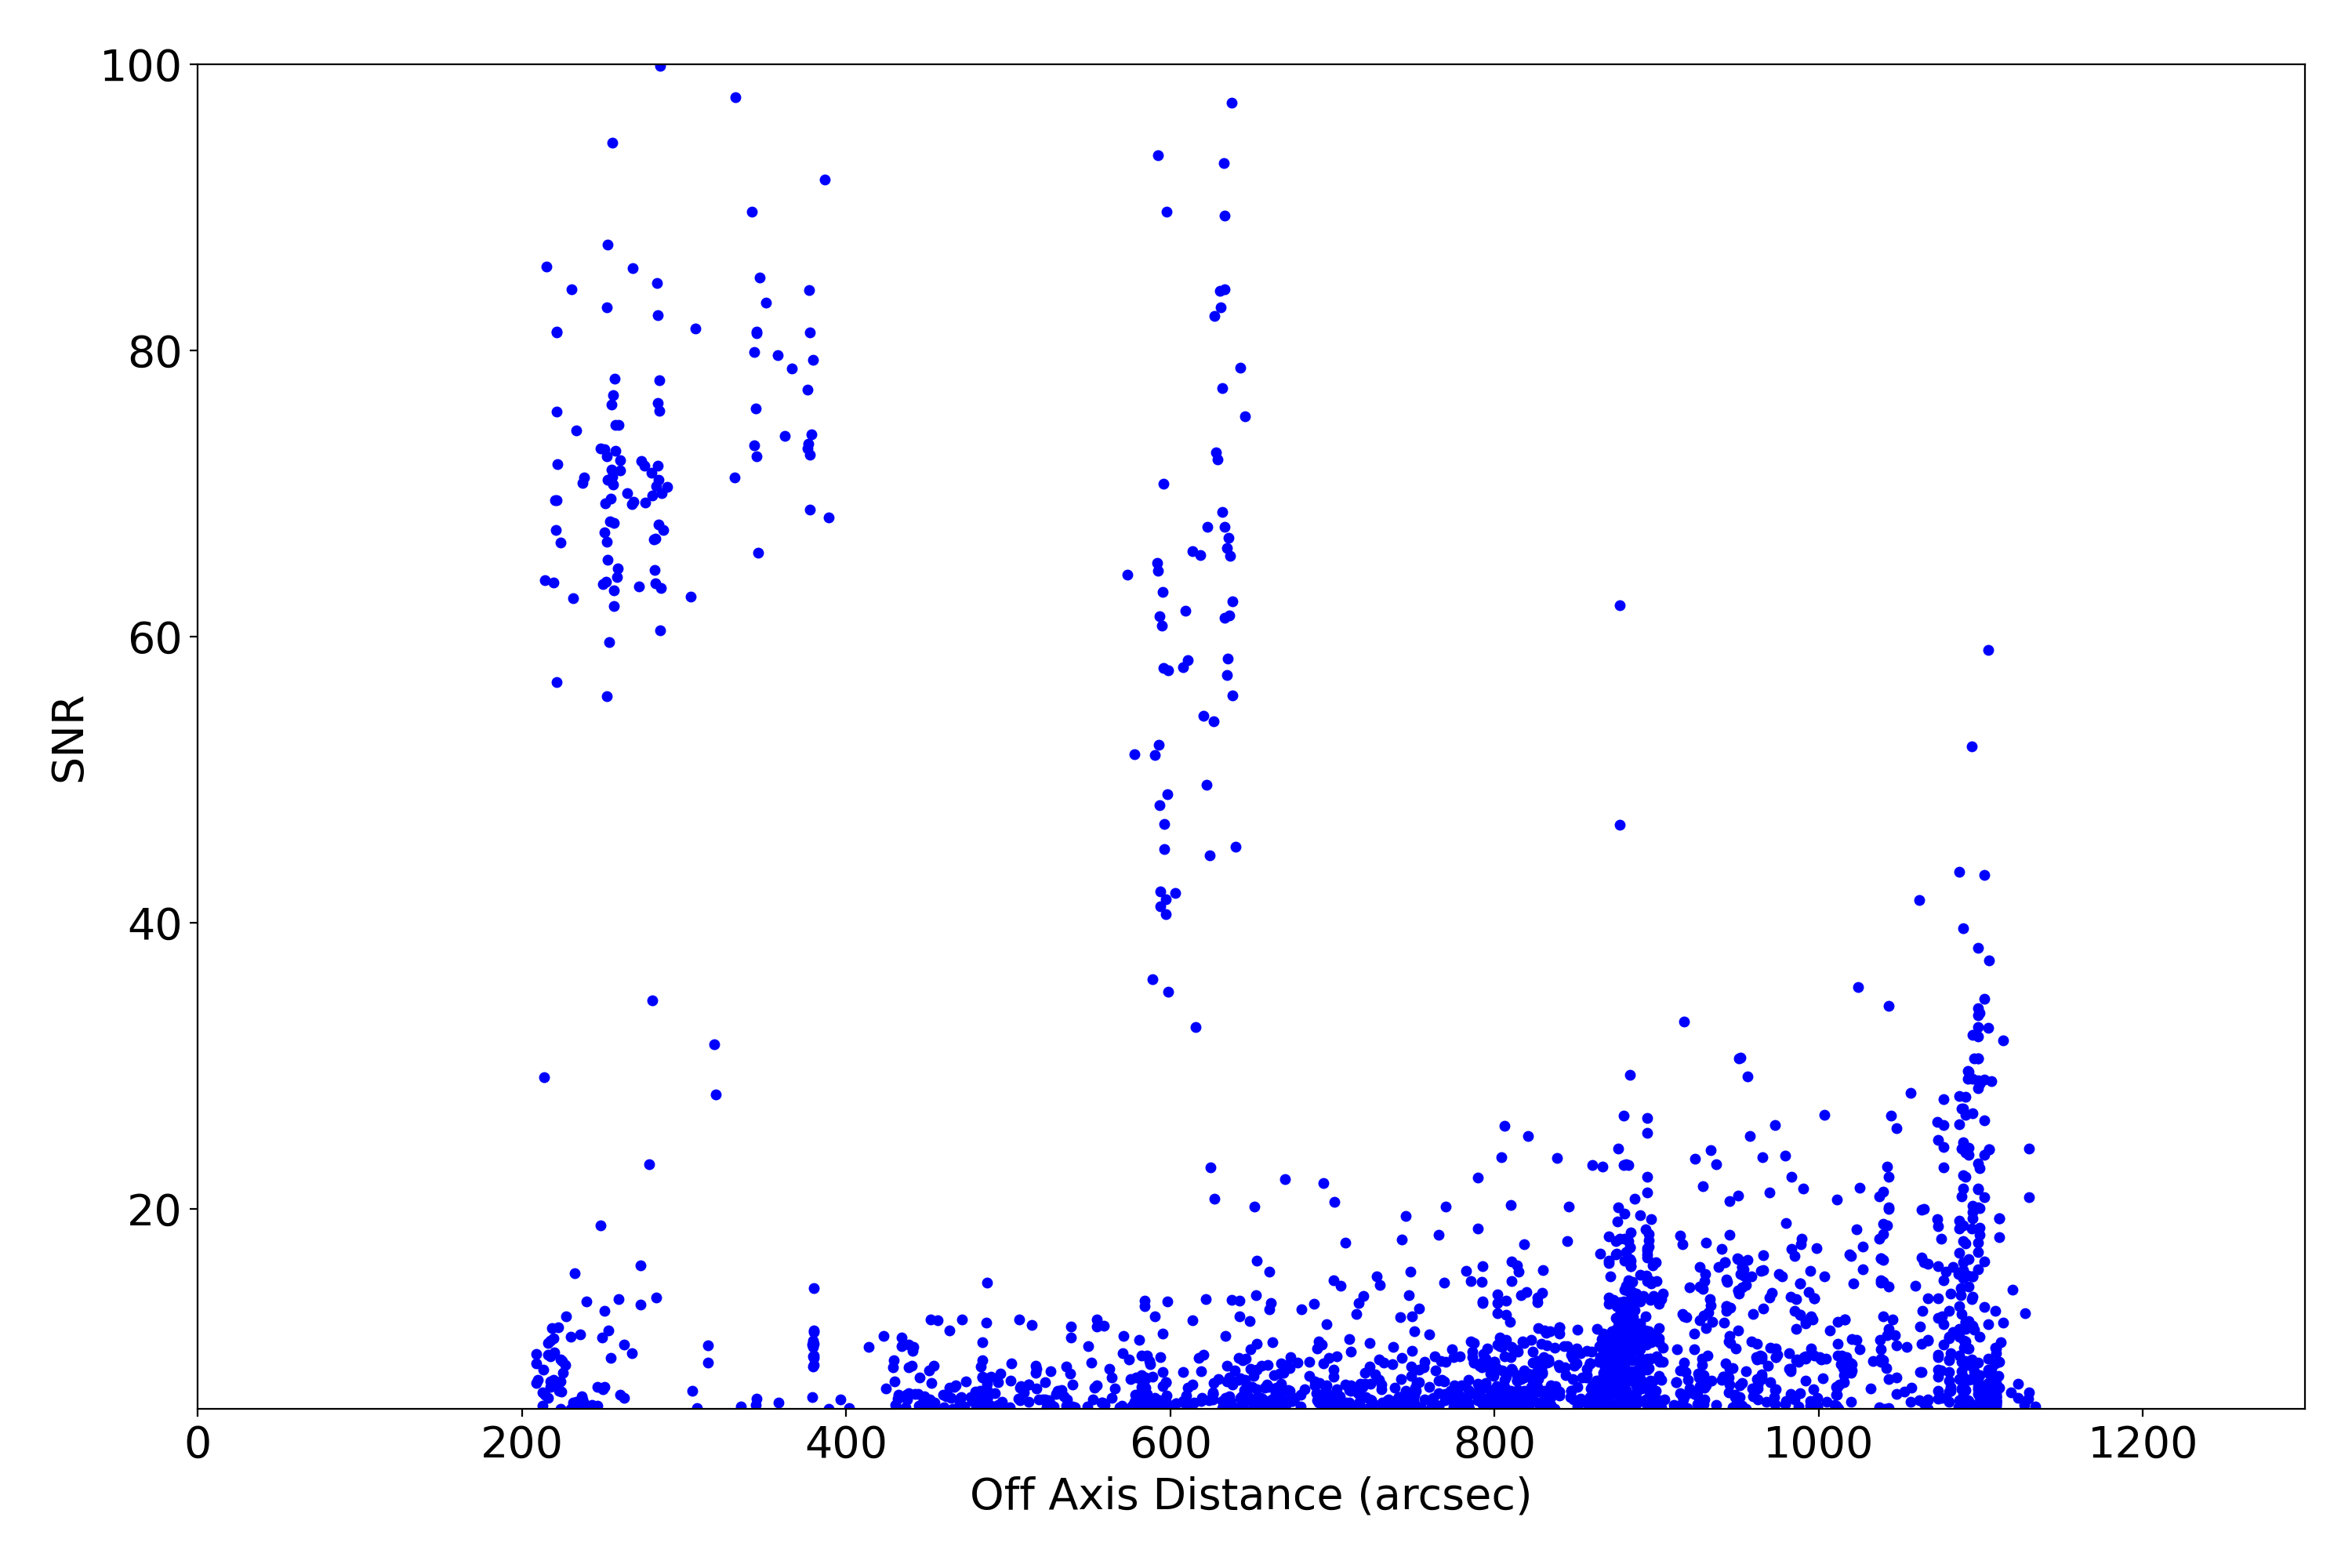
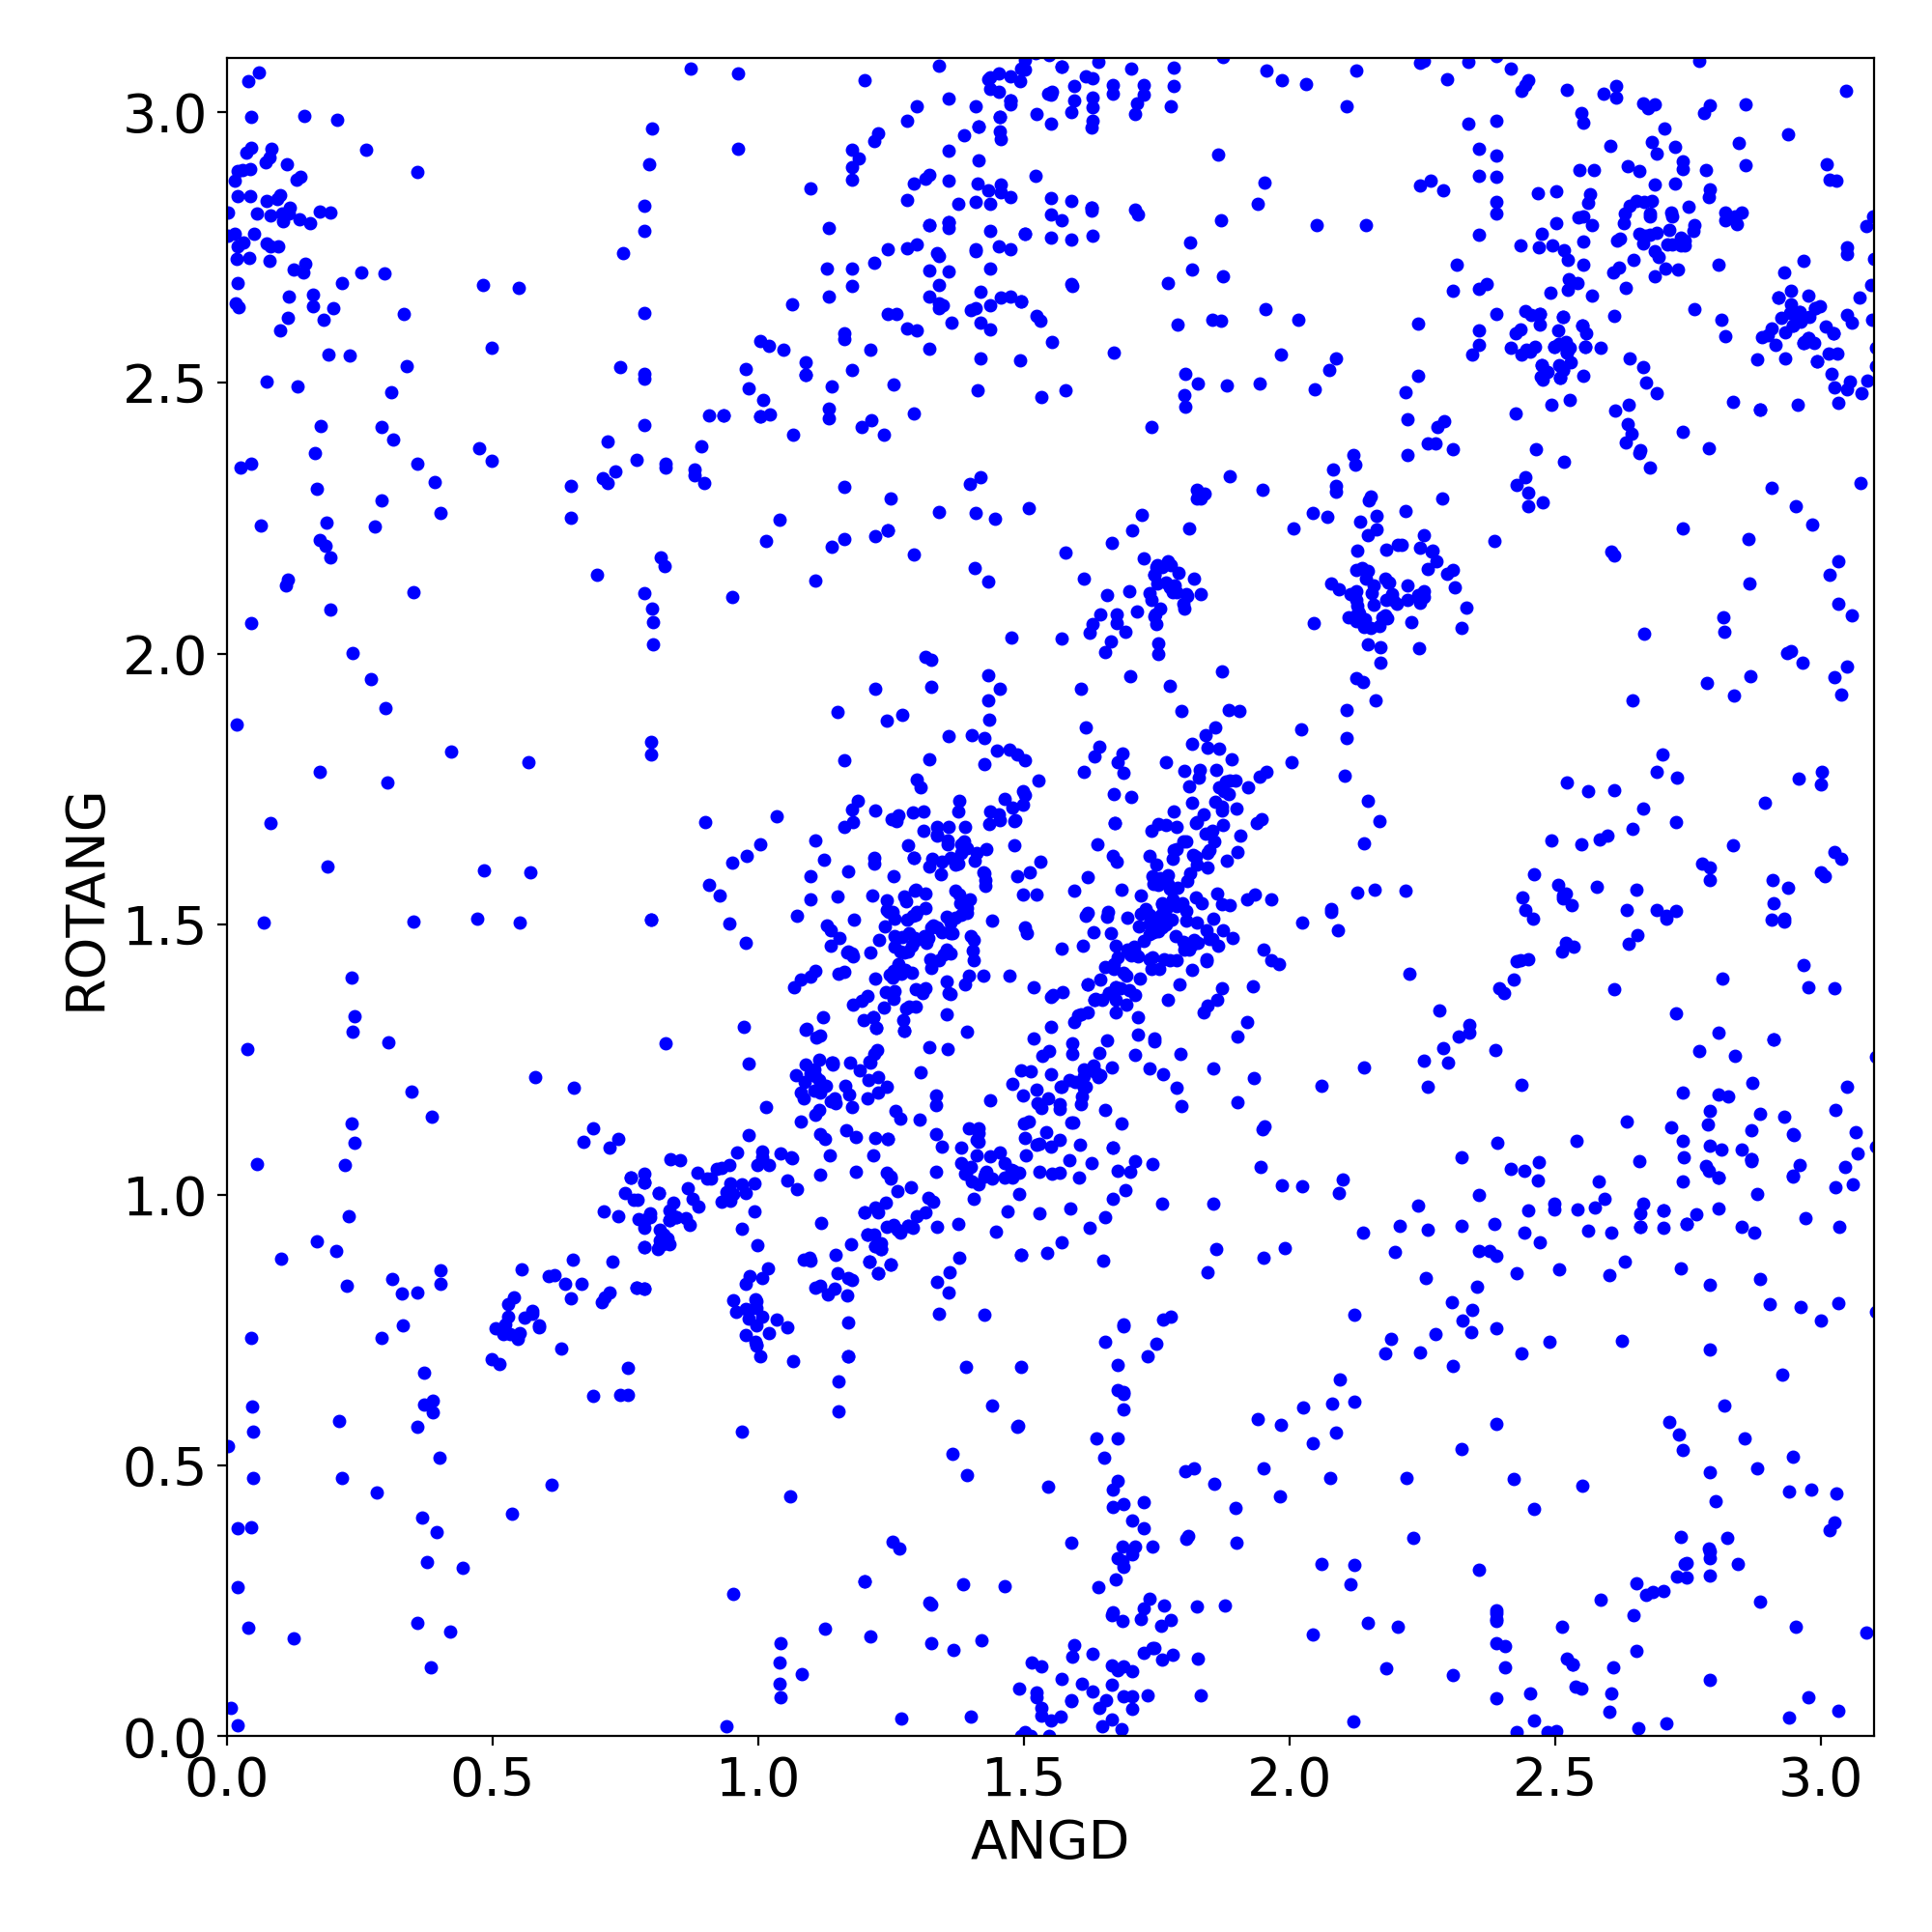
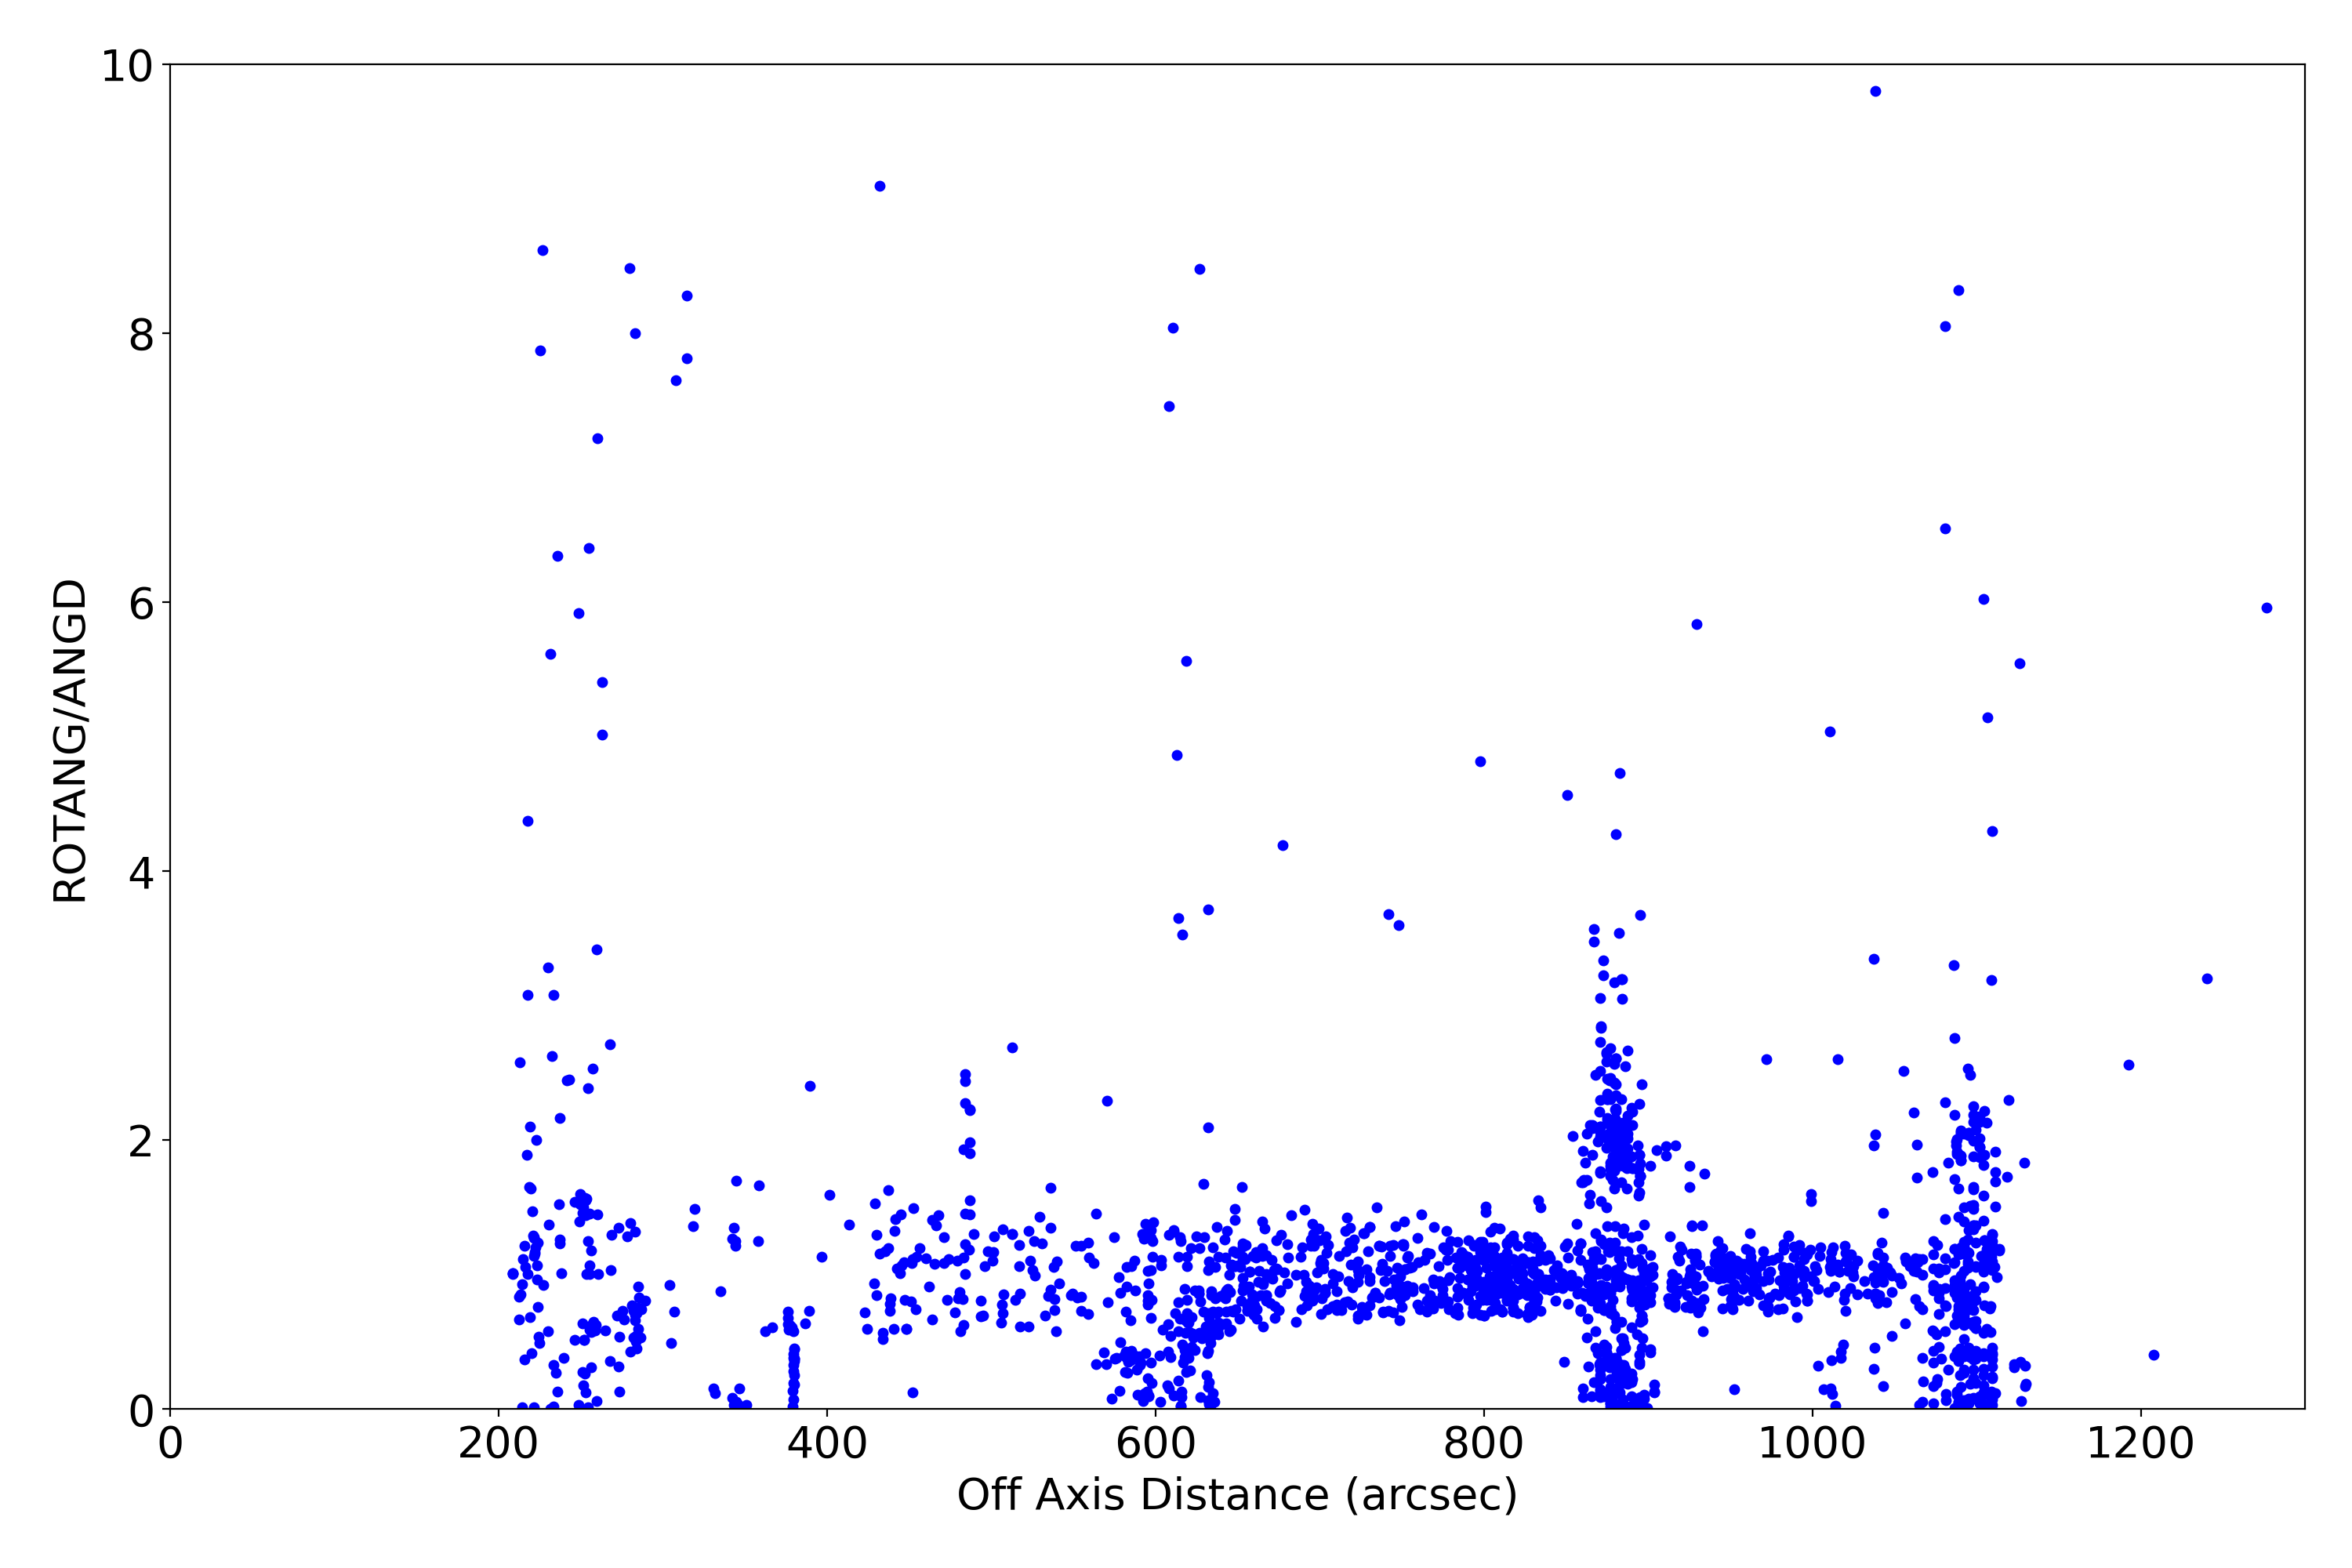
Plots below show various characteristics of detected imaging sources. Standard level 2 data products (*src2.fits) are used. Only observations with focus (sim_x) within 0.01 mm of nominal value for given SI configuration are used. Sources are also filtered for strength (SNR > 15).
| XY | PSF | Roundness | EE Radius | SNR | Rotation | Rotation2 | |
|---|---|---|---|---|---|---|---|
| ACIS I | 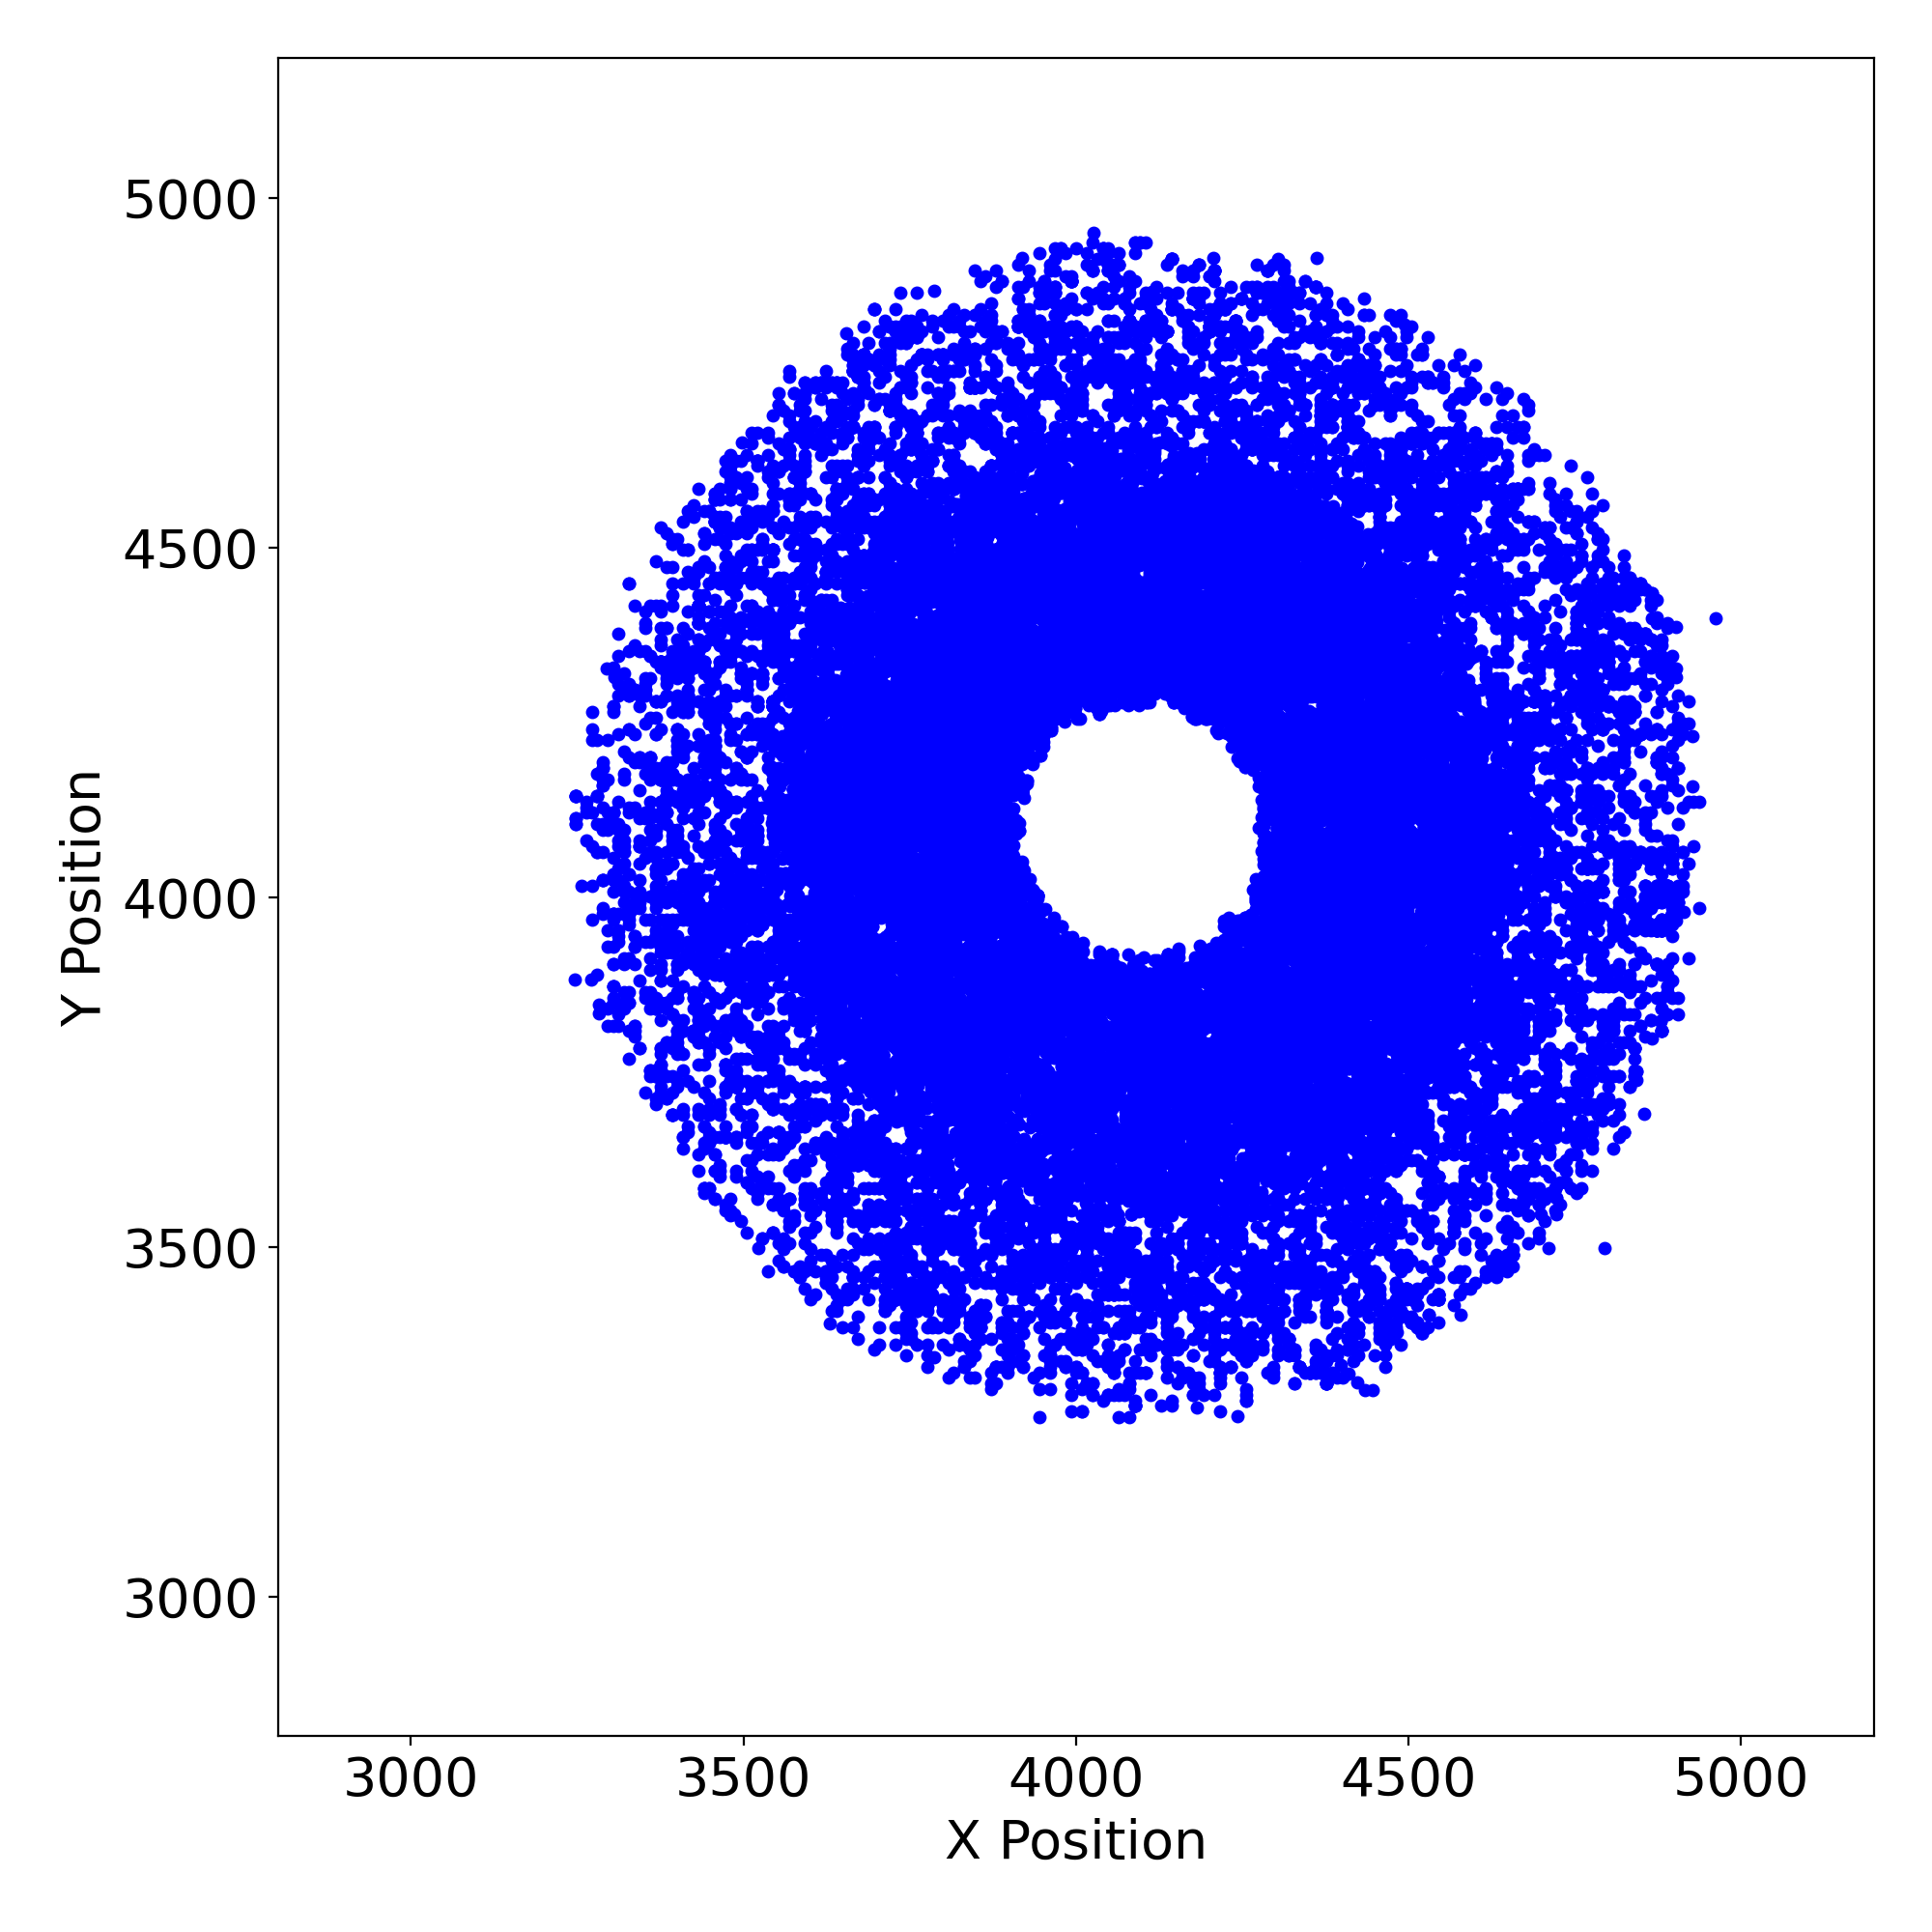 |
 |
 |
 |
 |
 |
 |
| ACIS S | 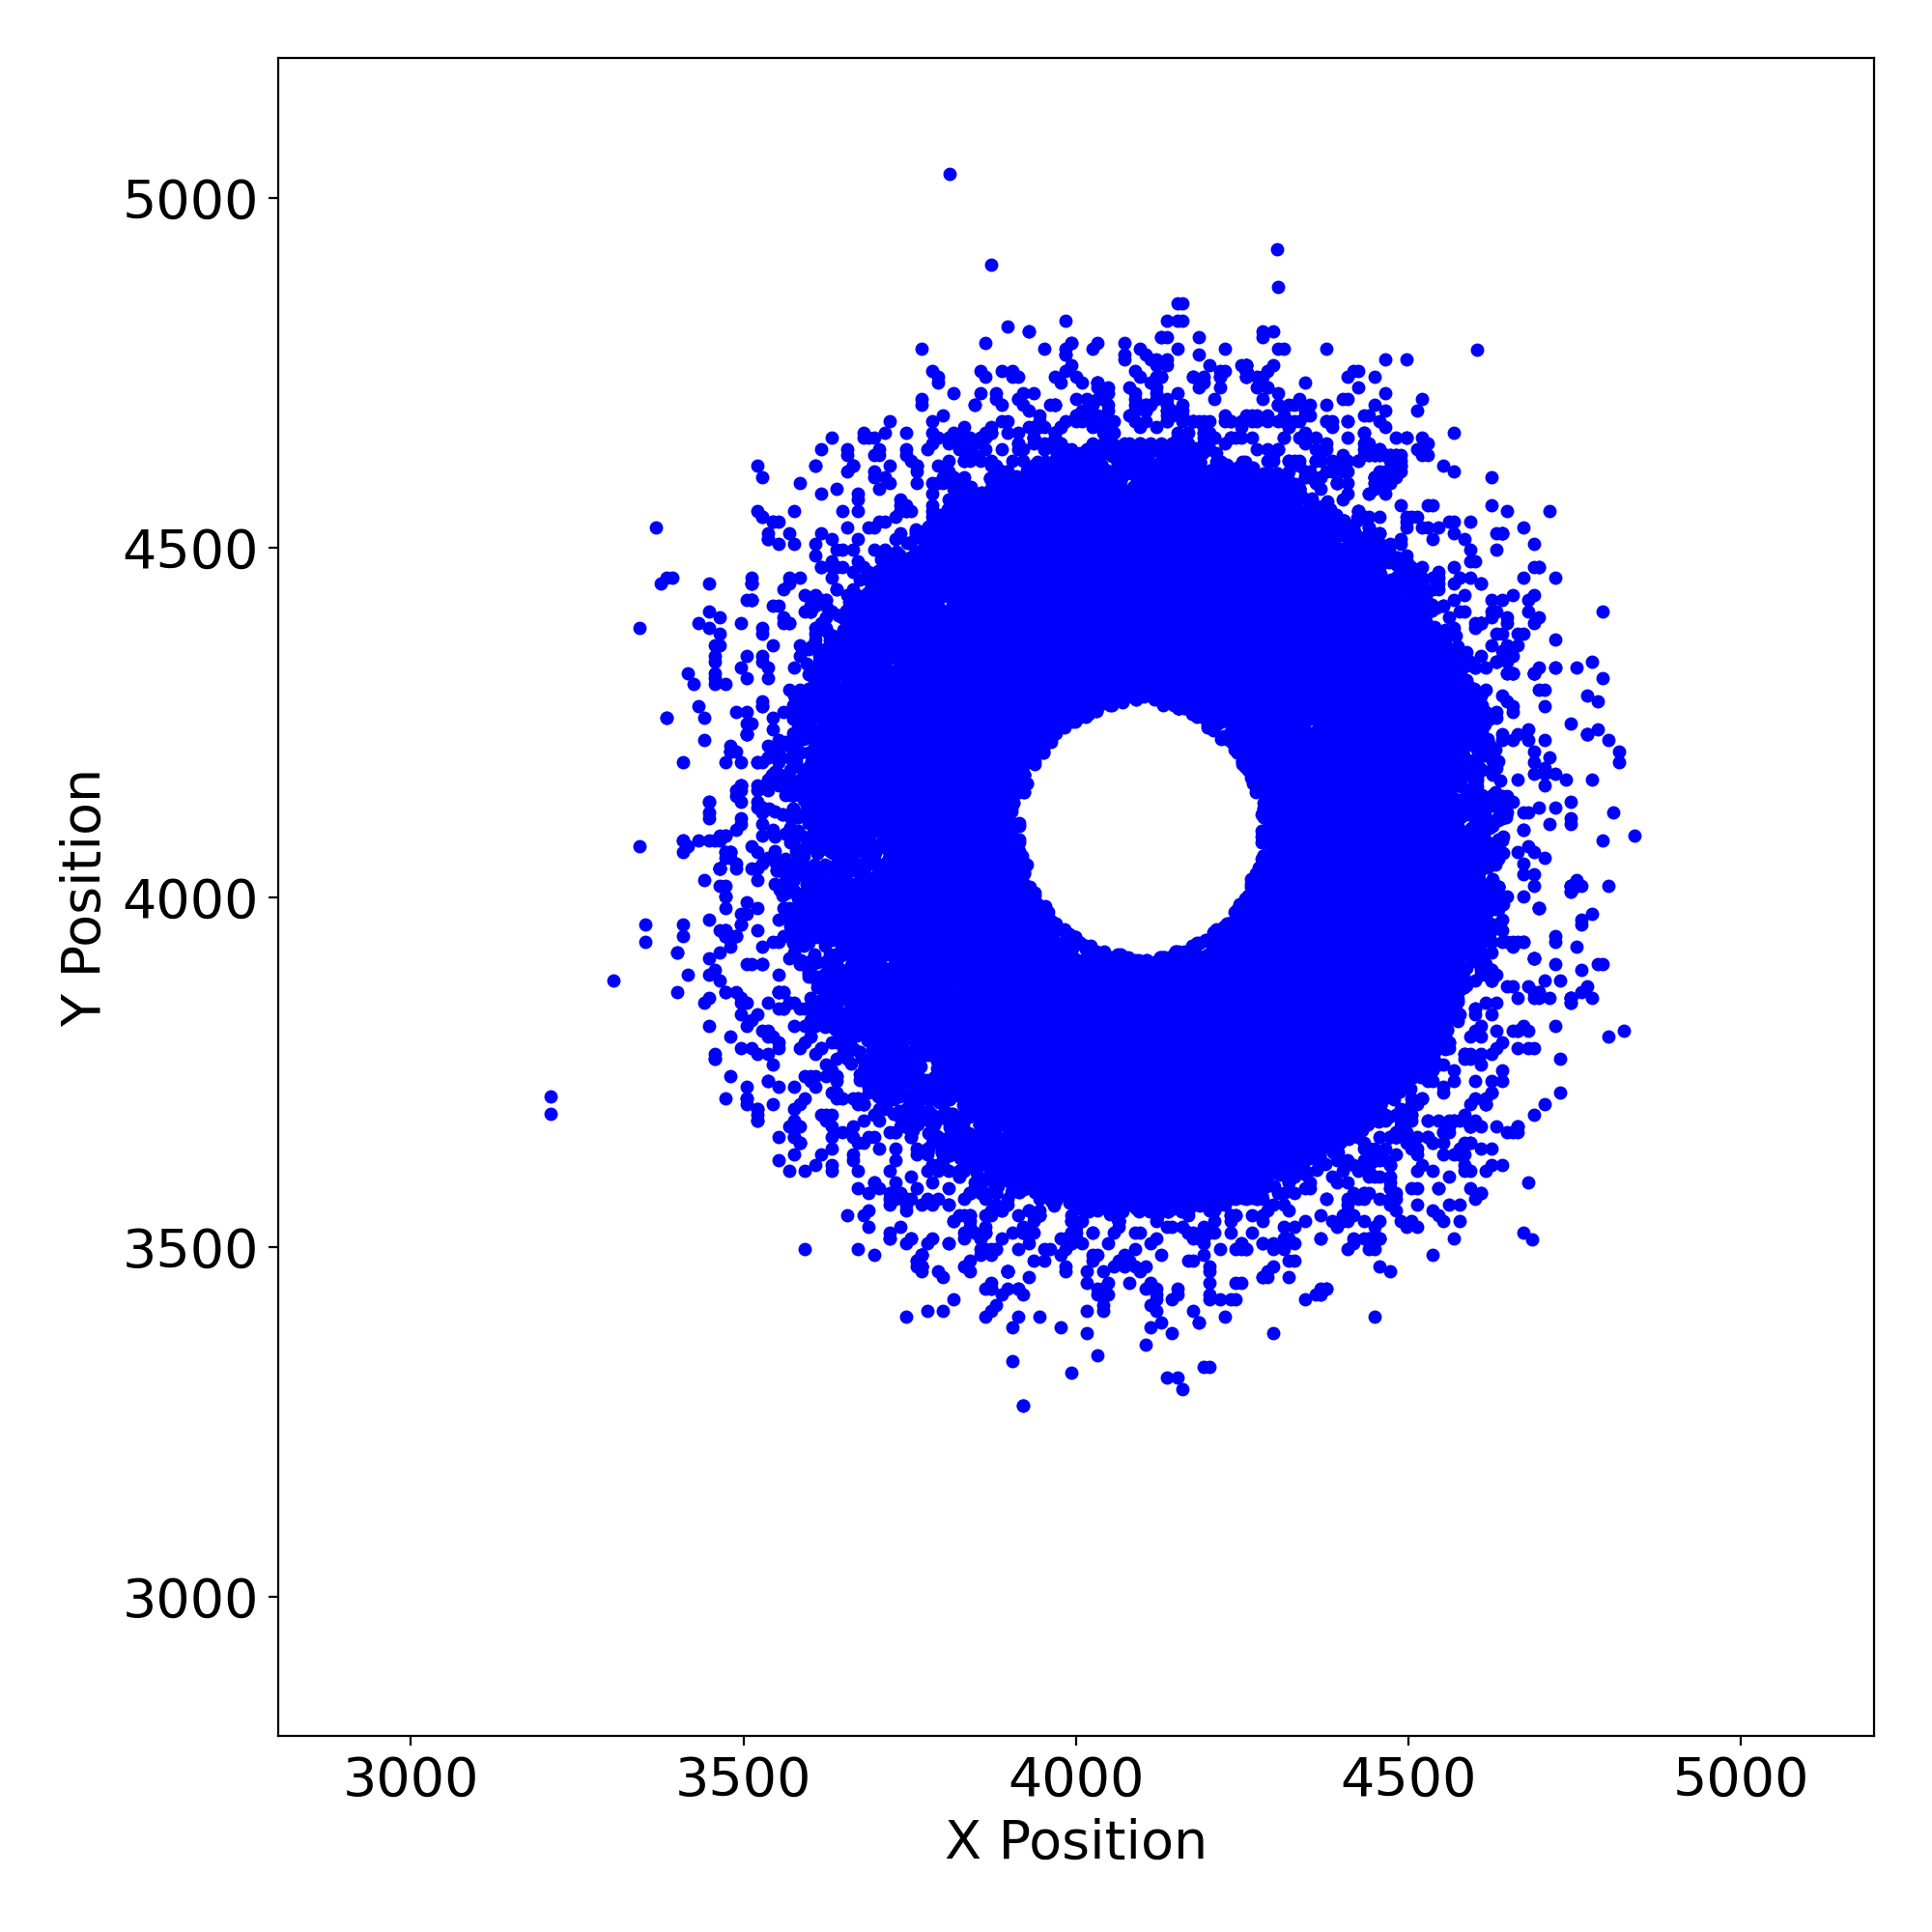 |
 |
 |
 |
 |
 |
 |
| HRC I | 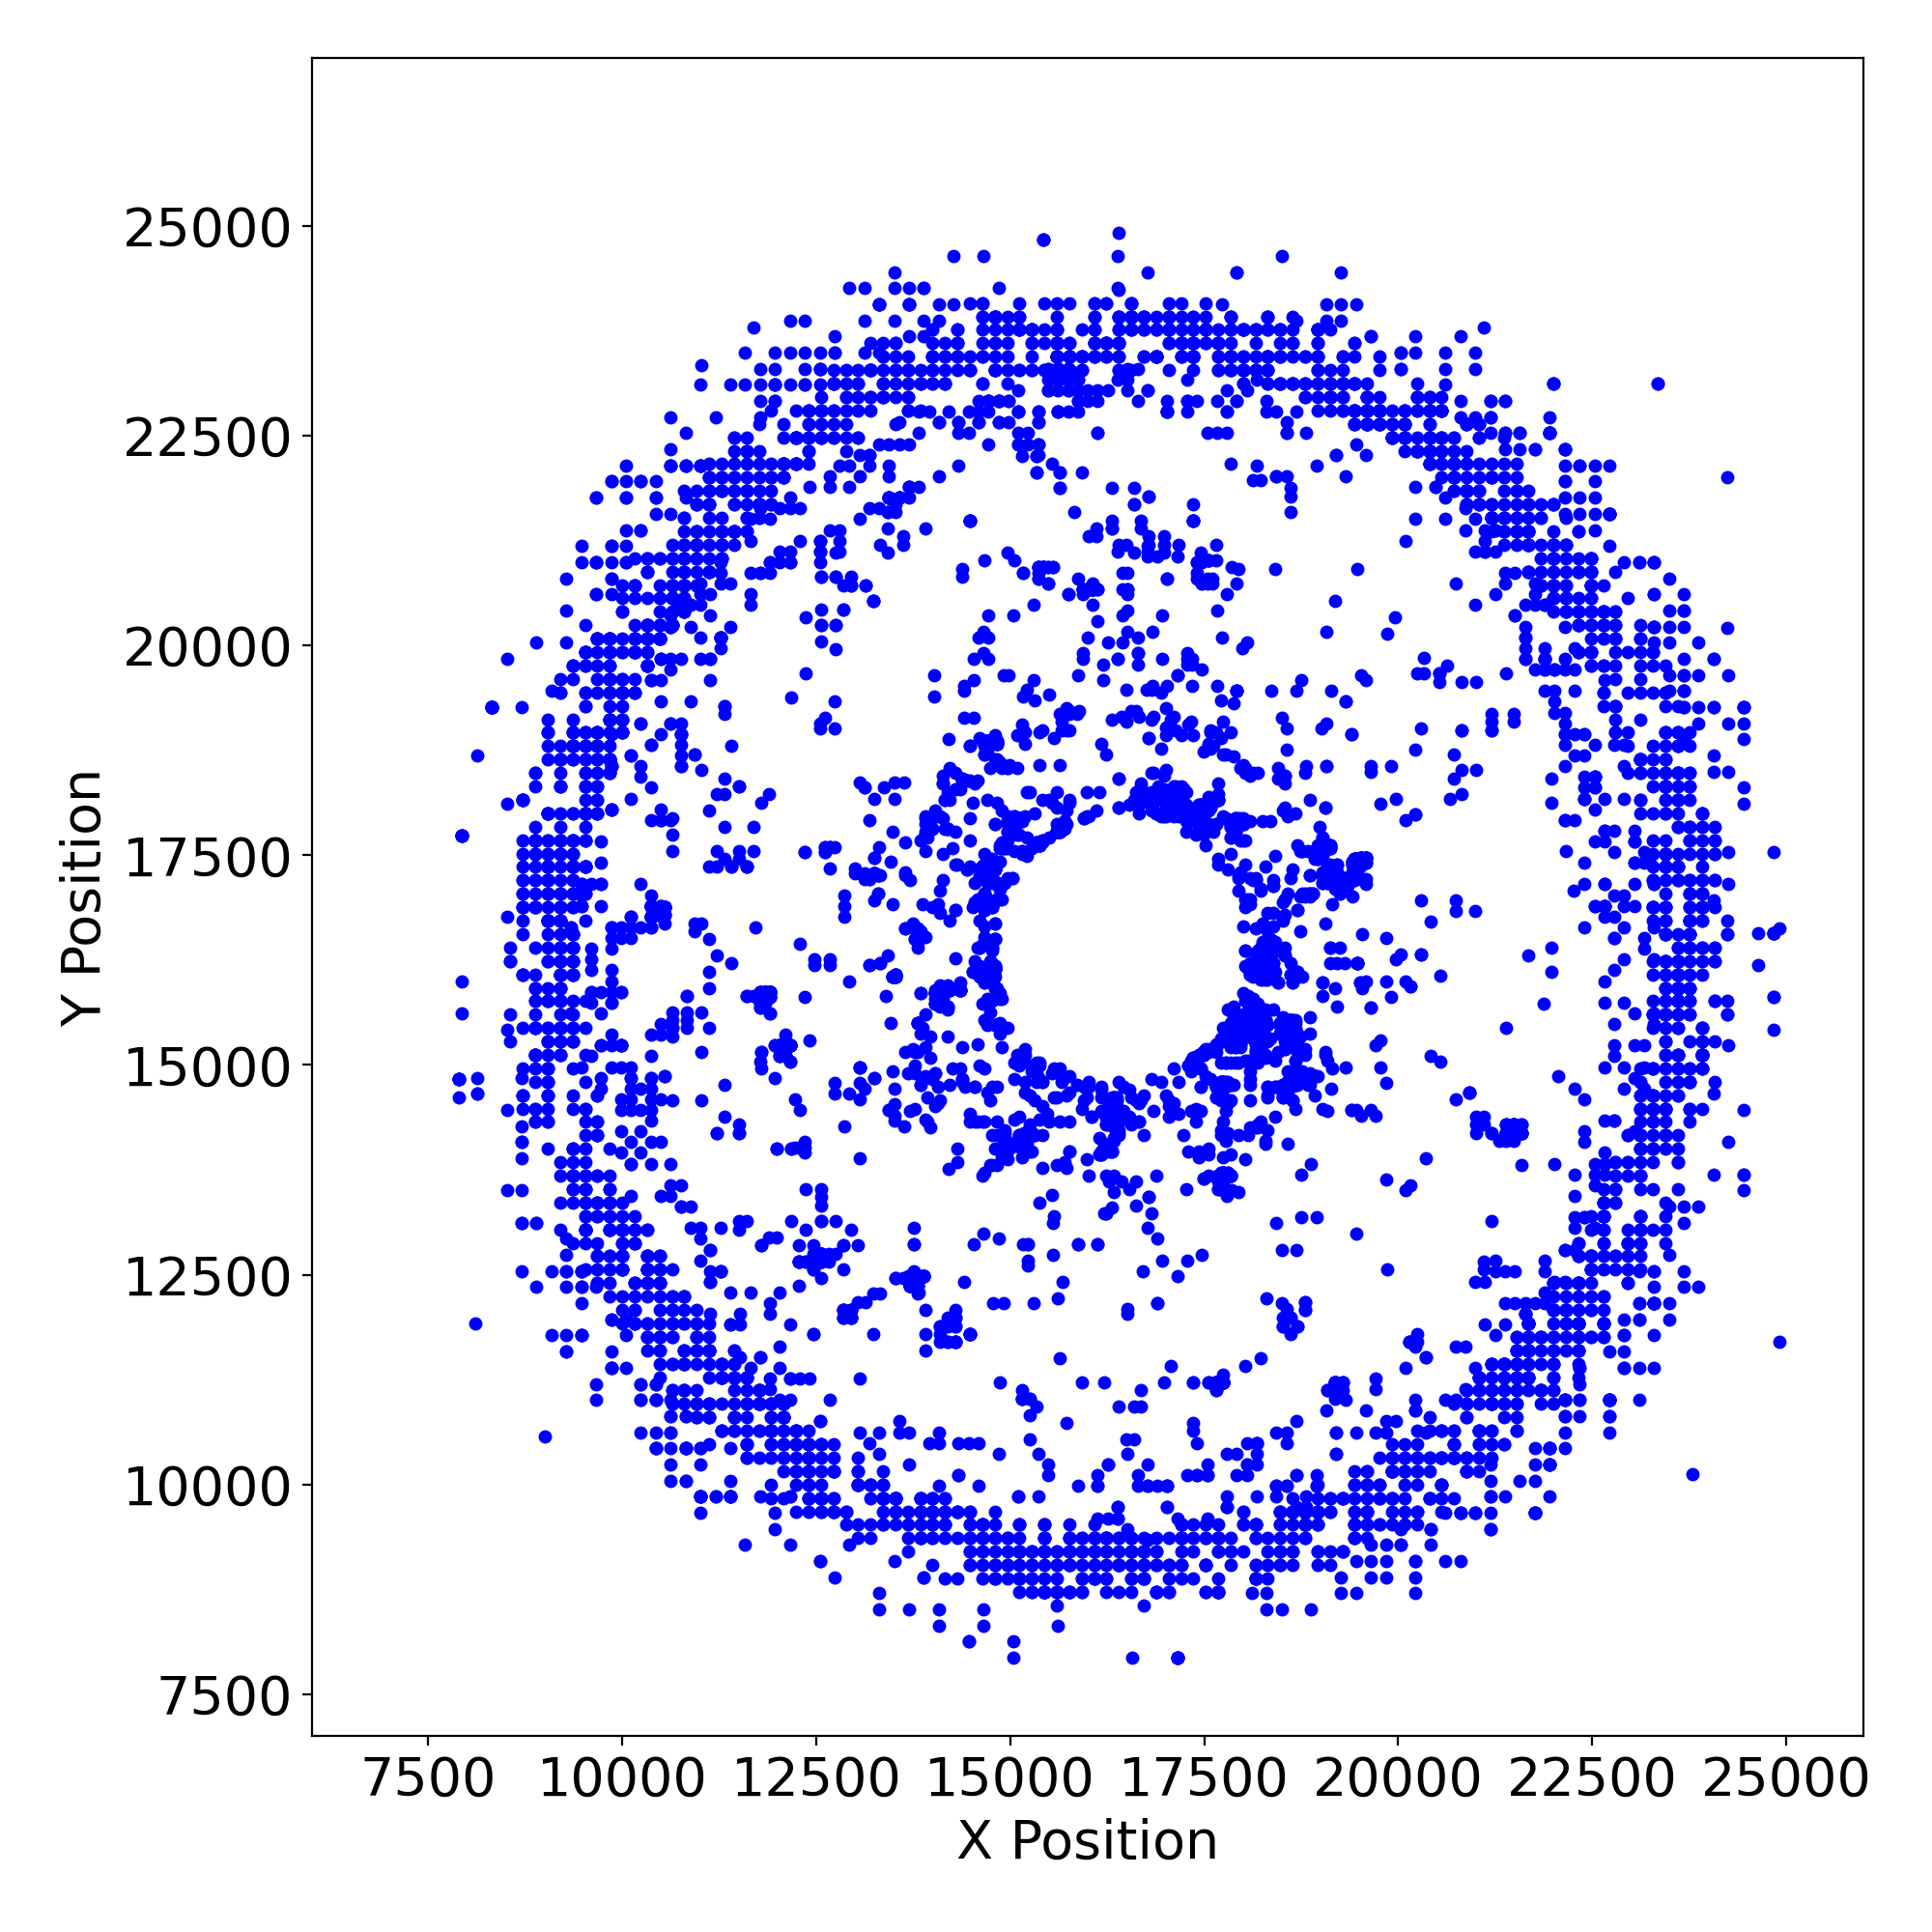 |
 |
 |
 |
 |
 |
 |
| HRC S | 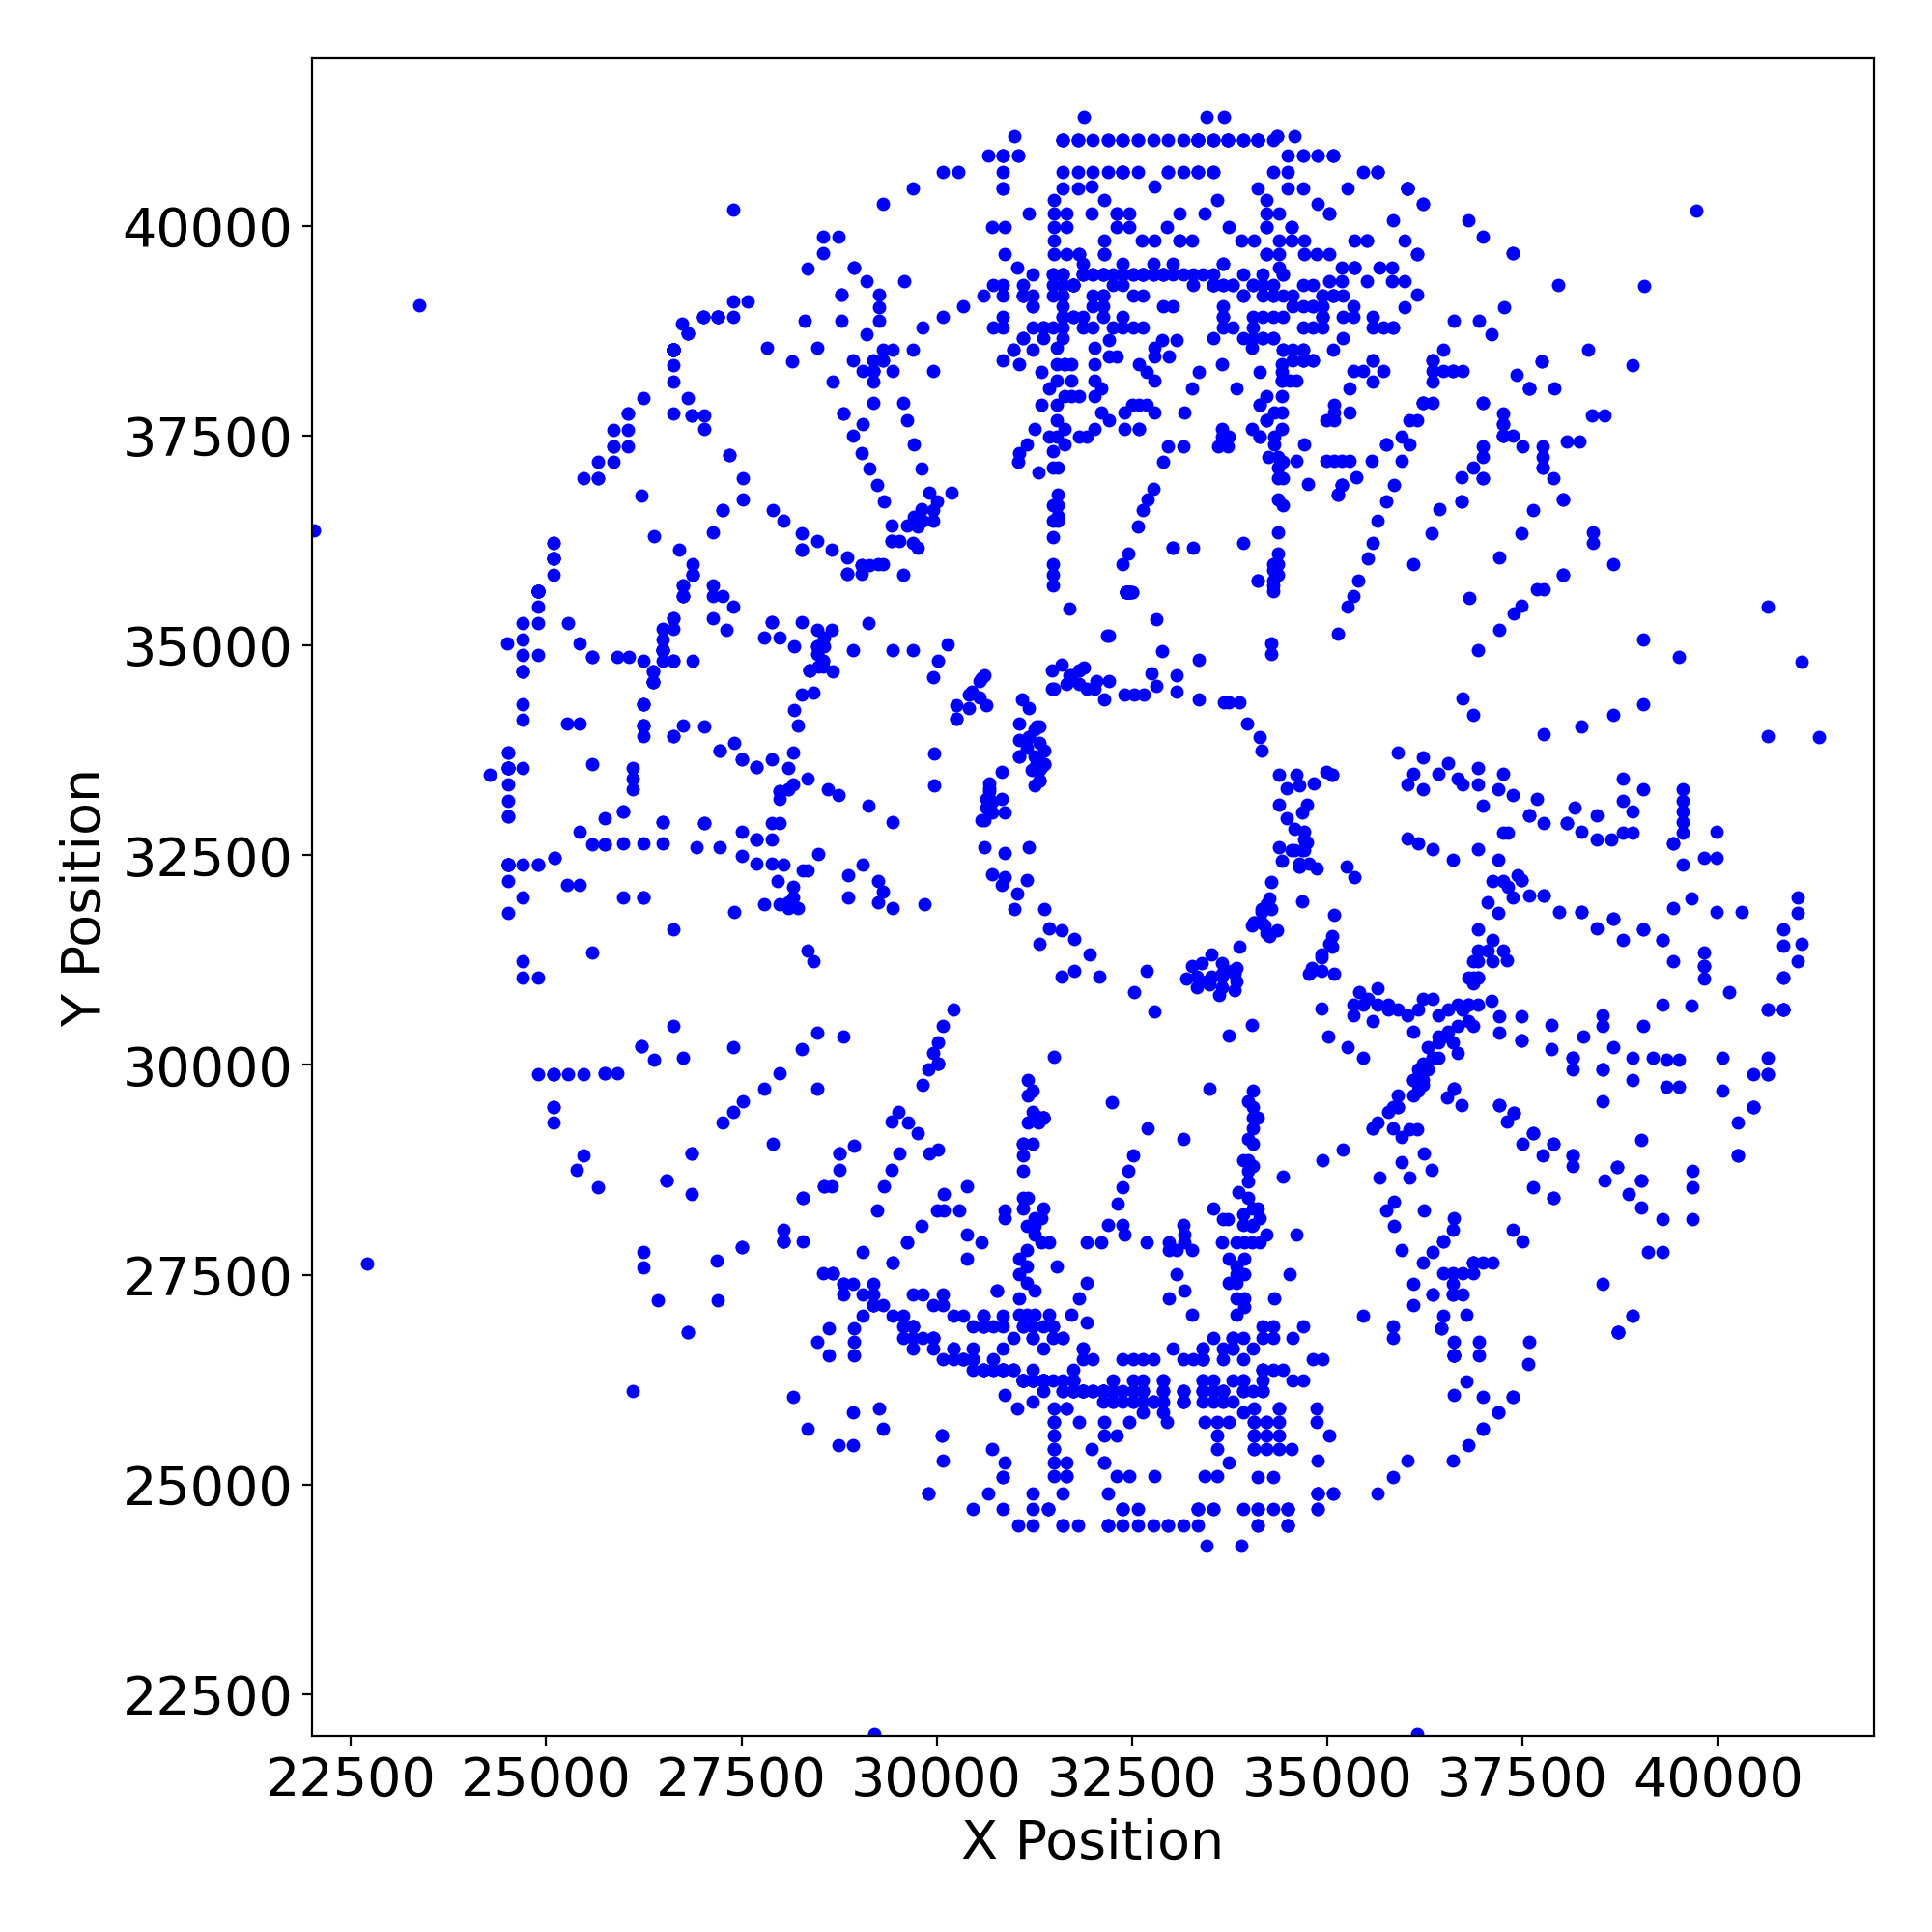 |
 |
 |
 |
 |
 |
 |
Gratings
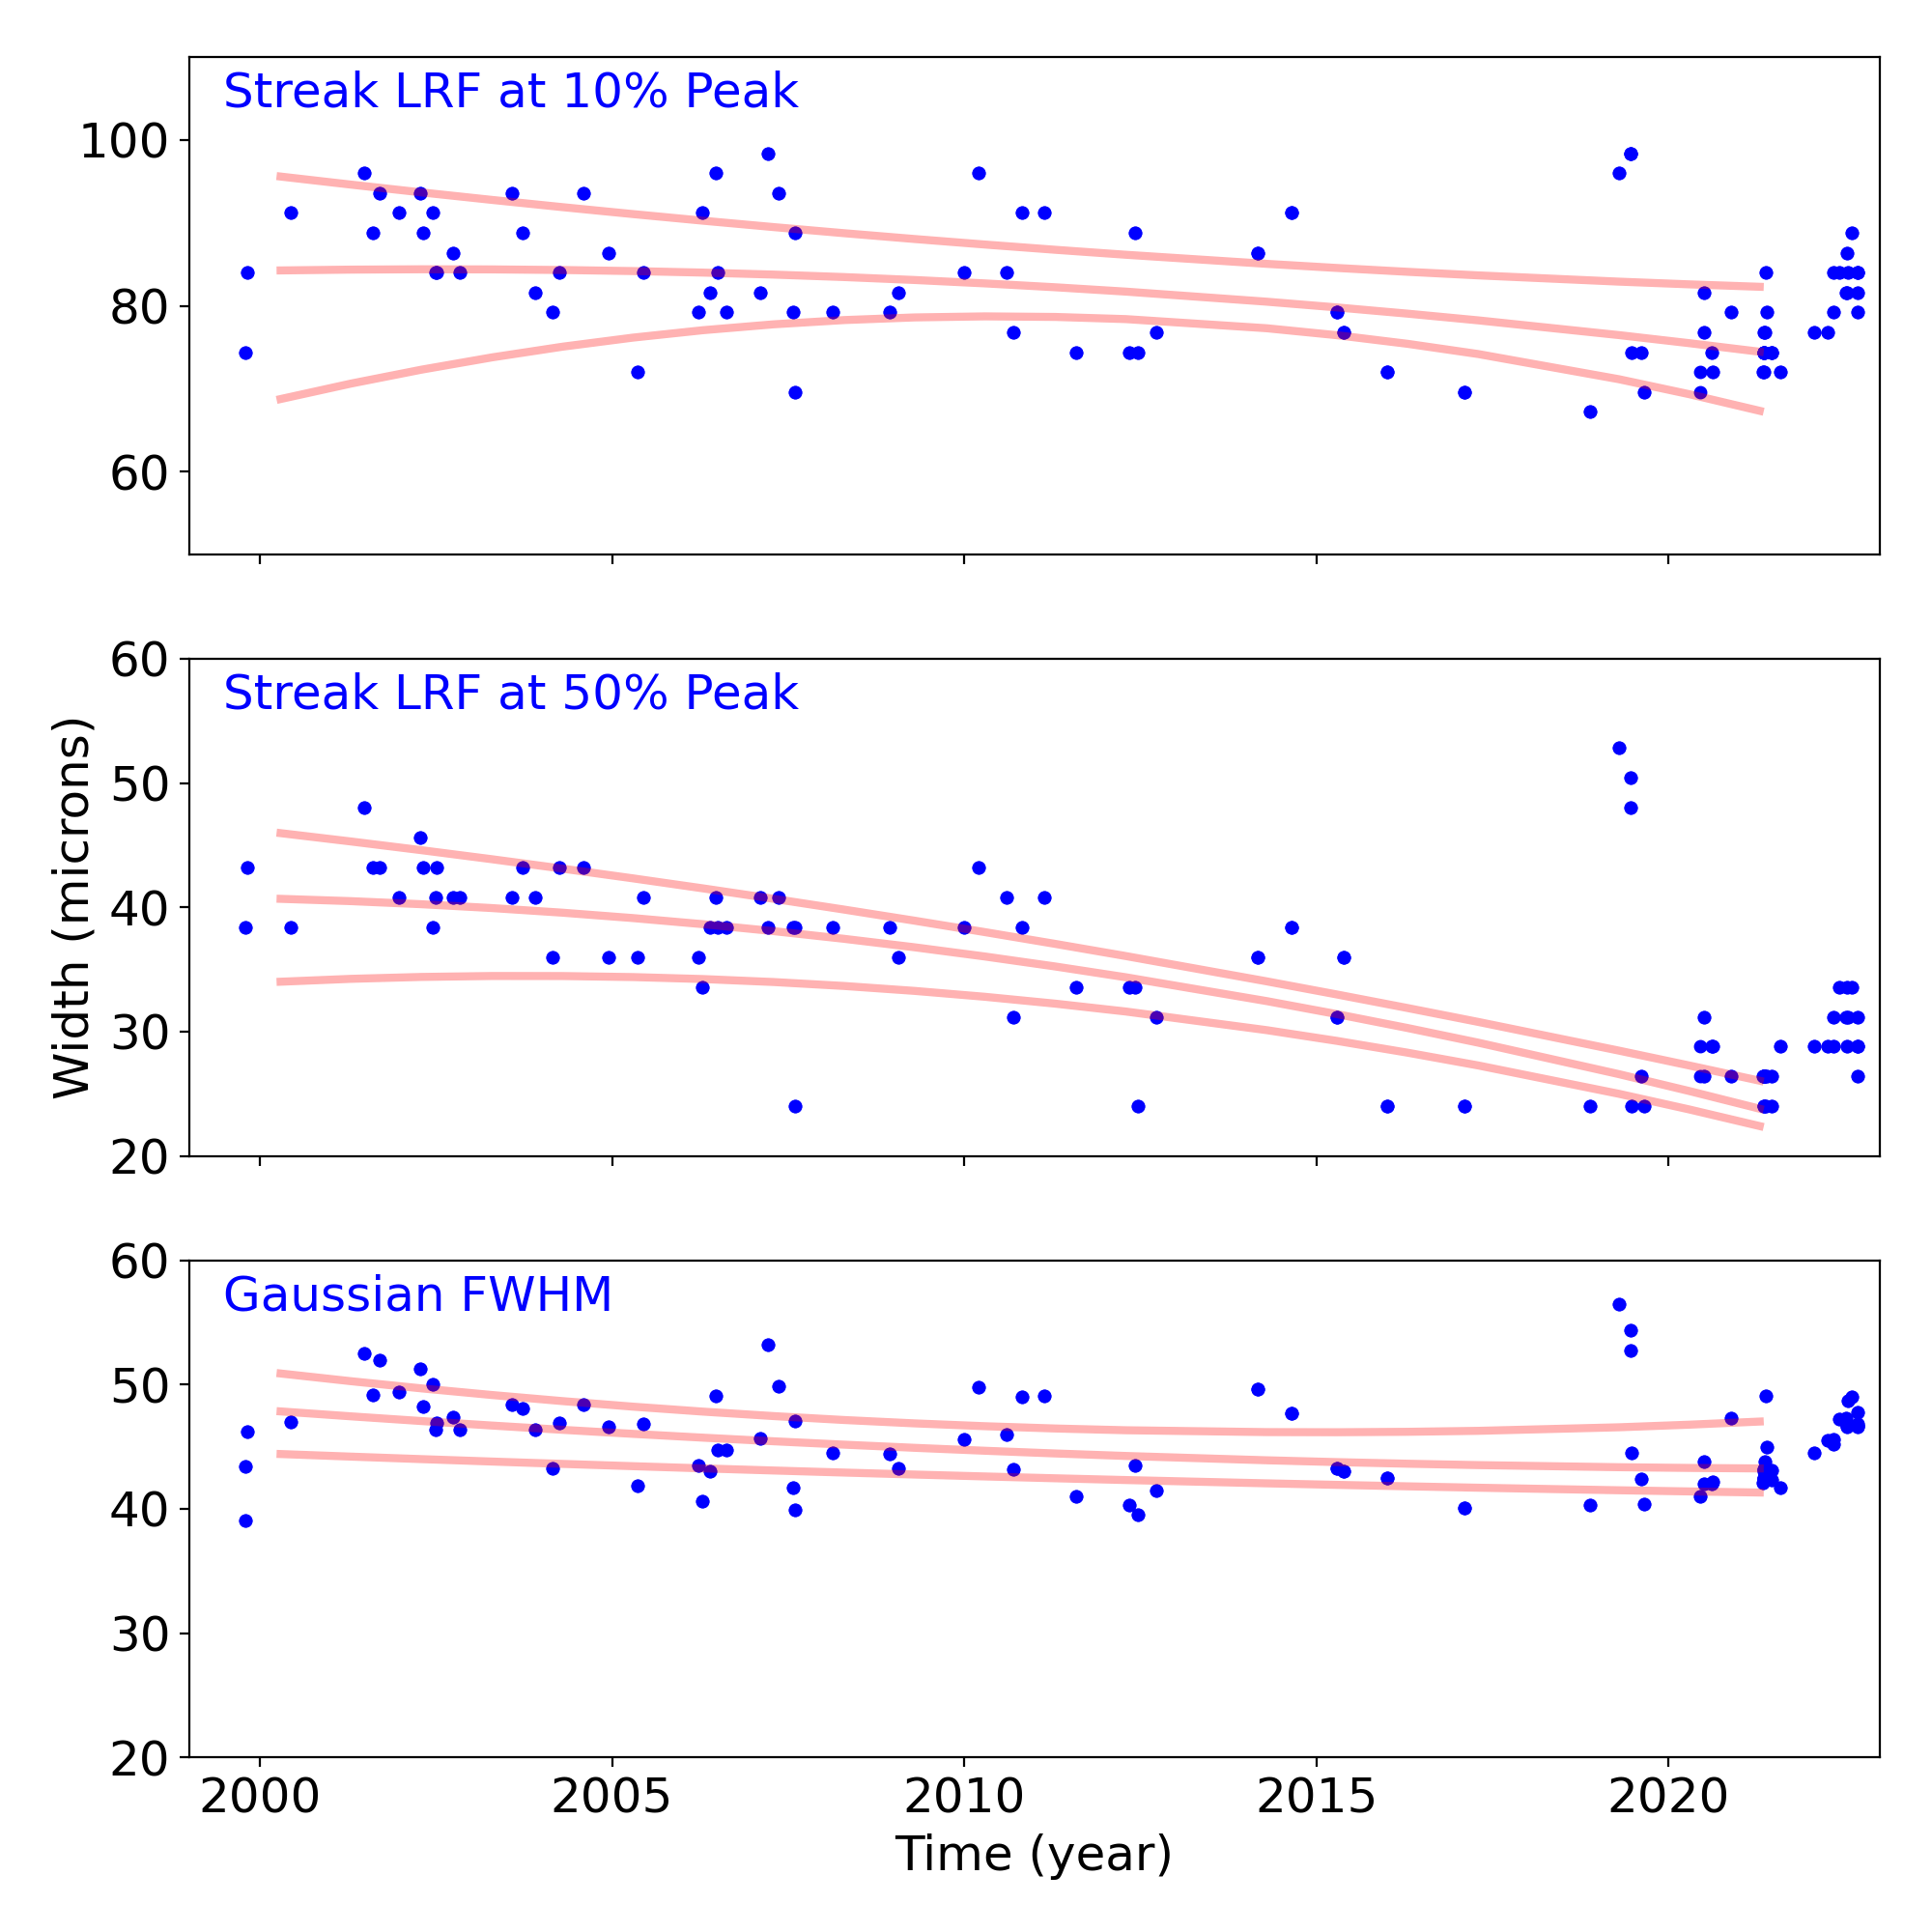
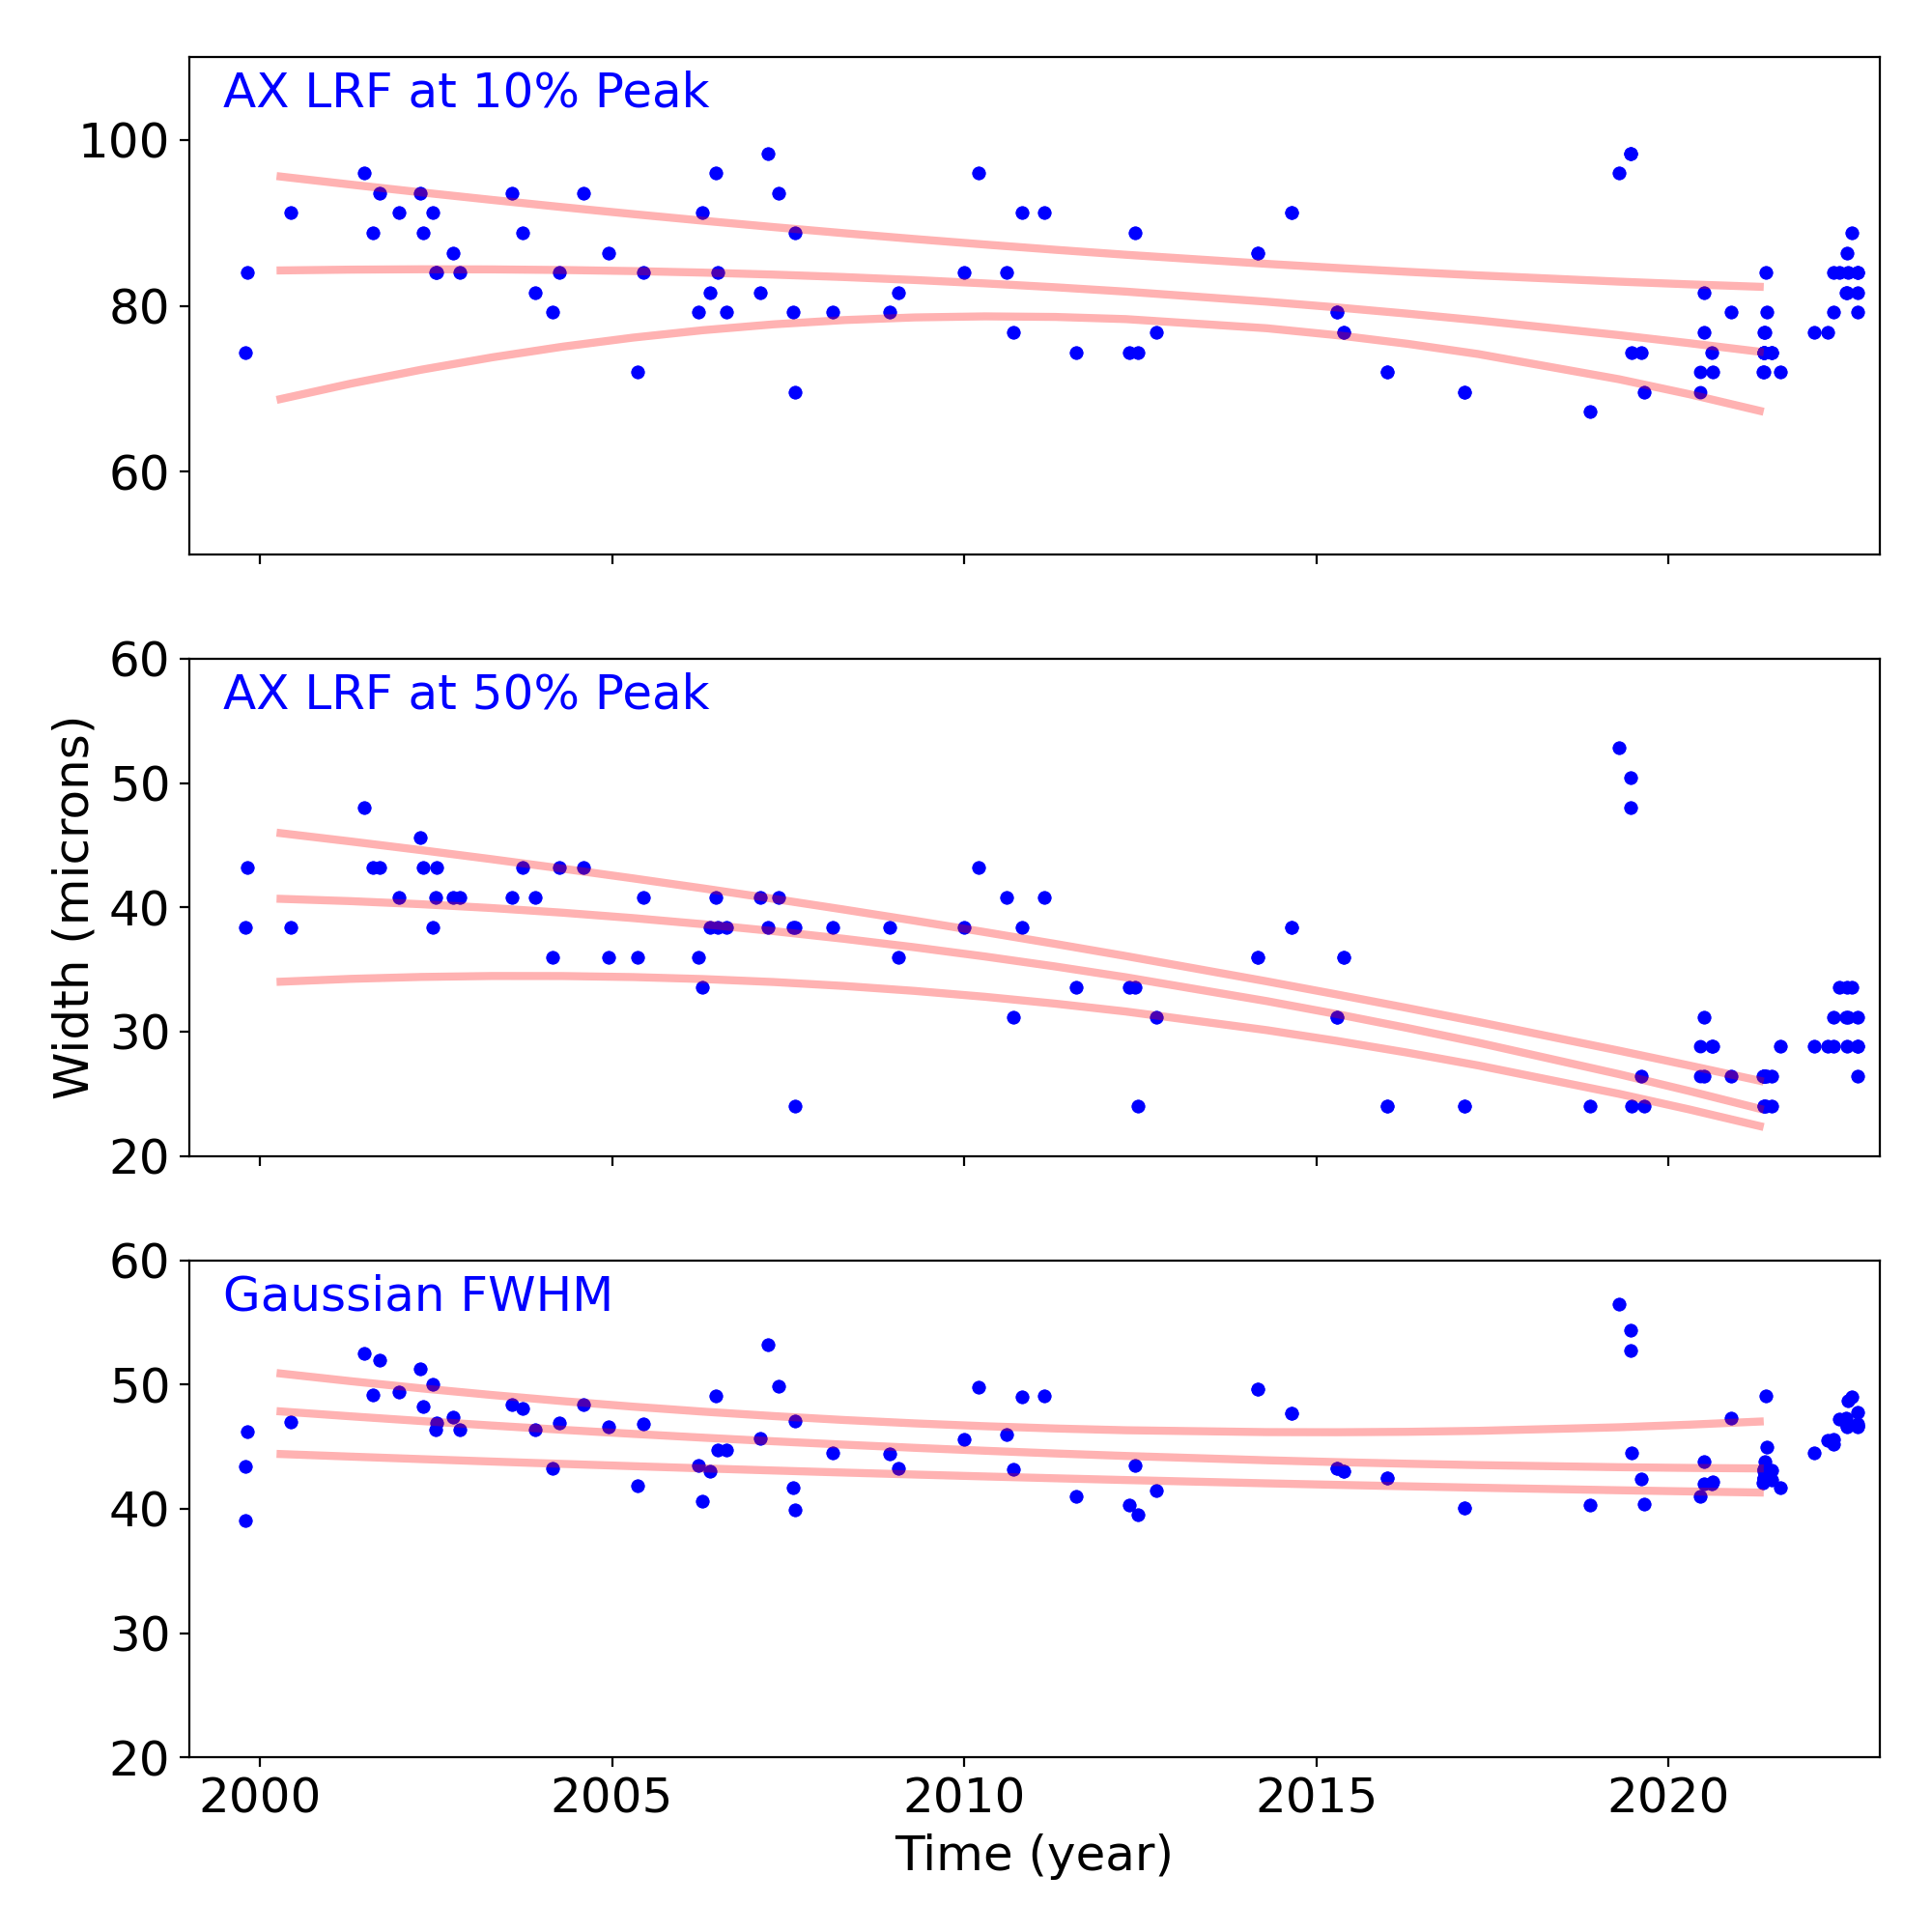
Grating Trends/Focus
We plot the width of the zero order streak of ACIS/HETG observations and the width of the zero order image for HRC/LETG observations of point sources. No significant defocusing trend is seen at this time. See Gratings Trends pages.
PCAD
ACA Trending
| ACIS |
)
|
)
|
)
|
|
|---|---|---|---|---|
)
|
)
|
)
| ||
| HRCI |
)
|
)
|
)
|
)
|
| HRCI |
)
|
)
|
)
|
)
|
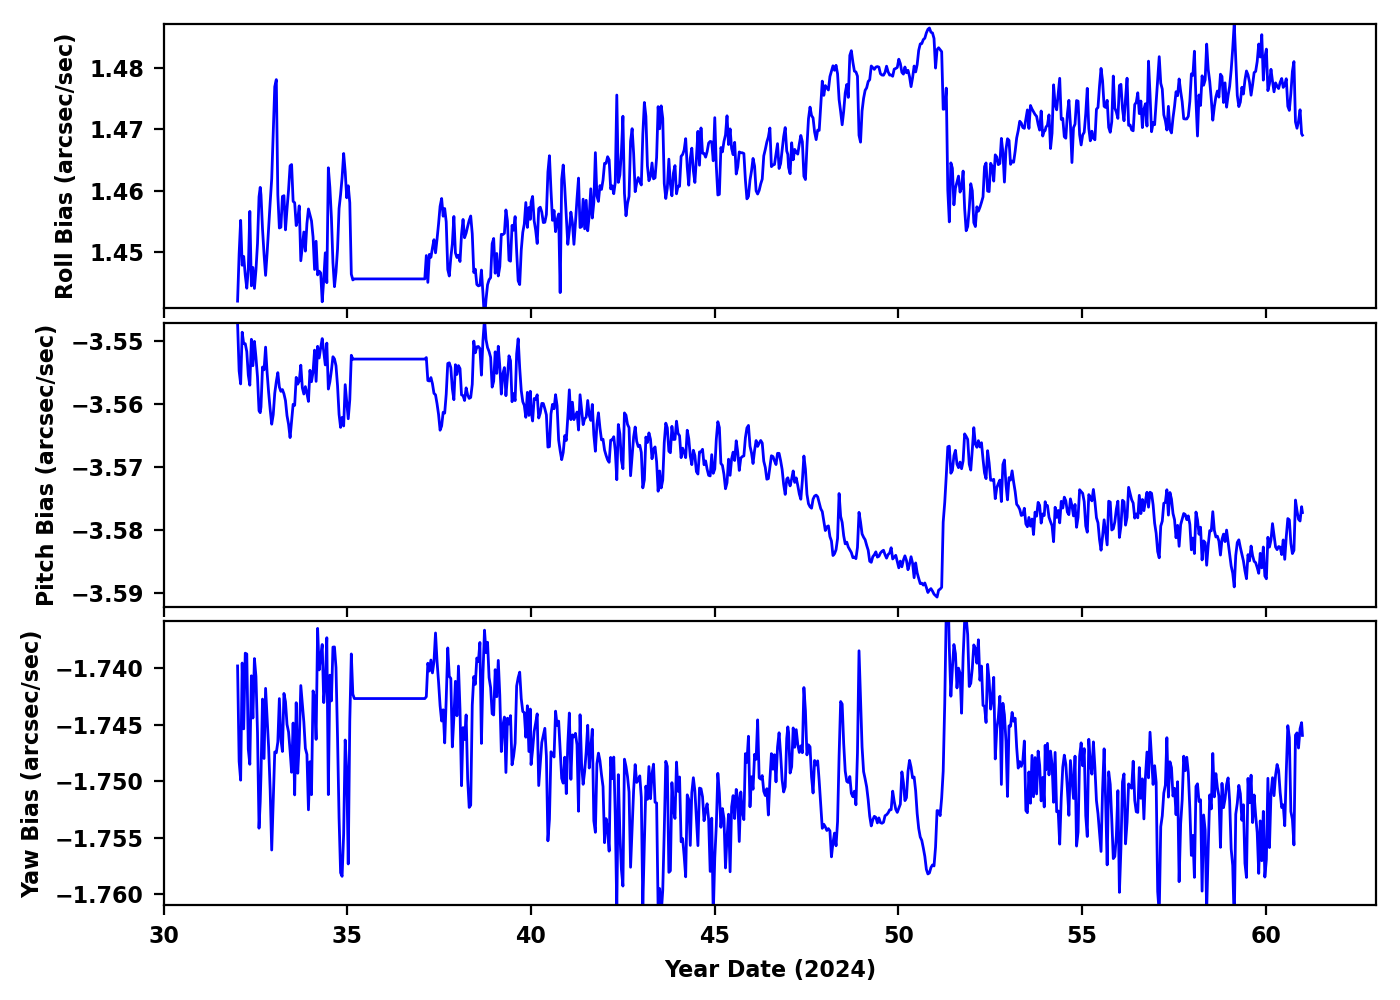
Gyro Bias Drift
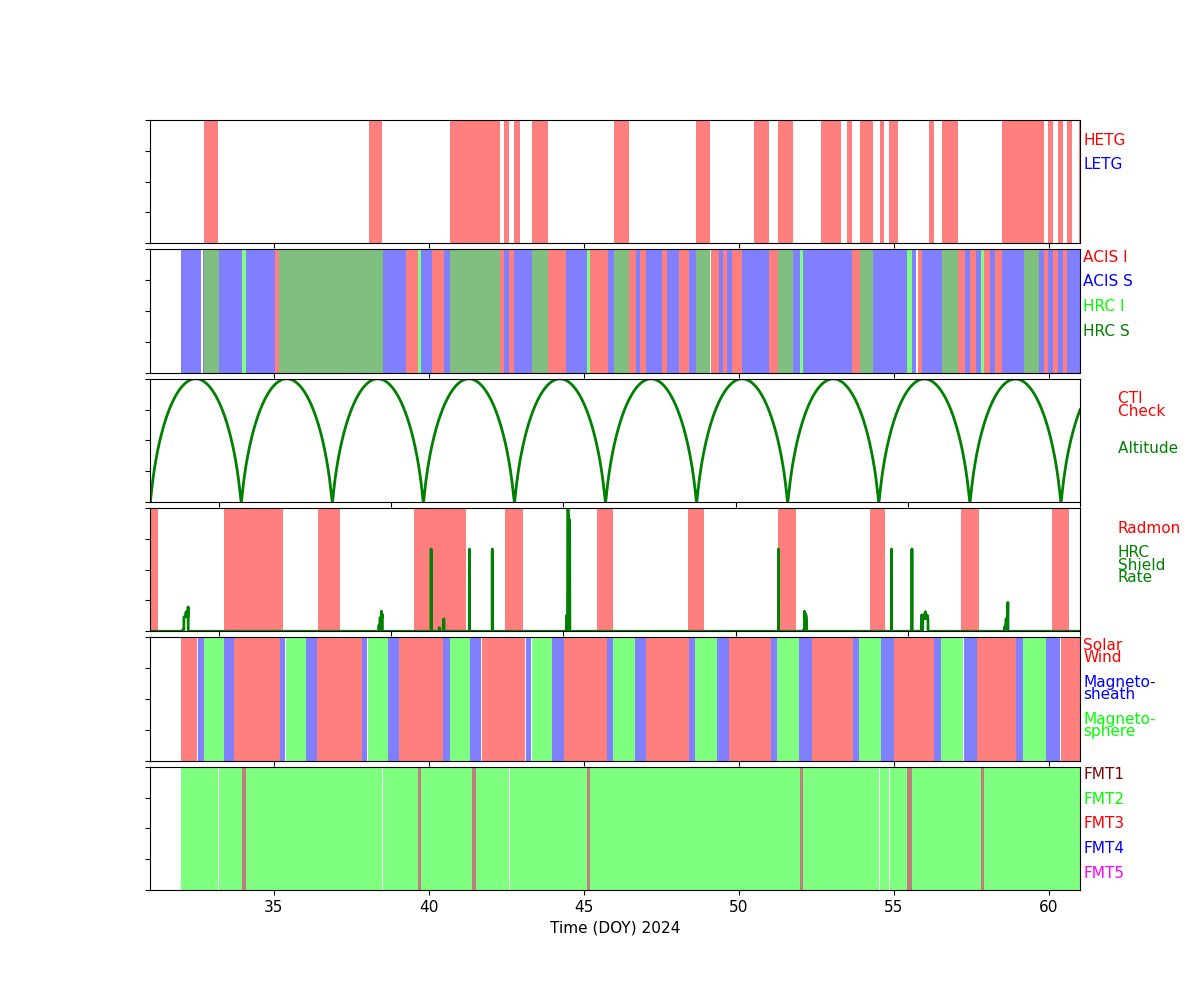
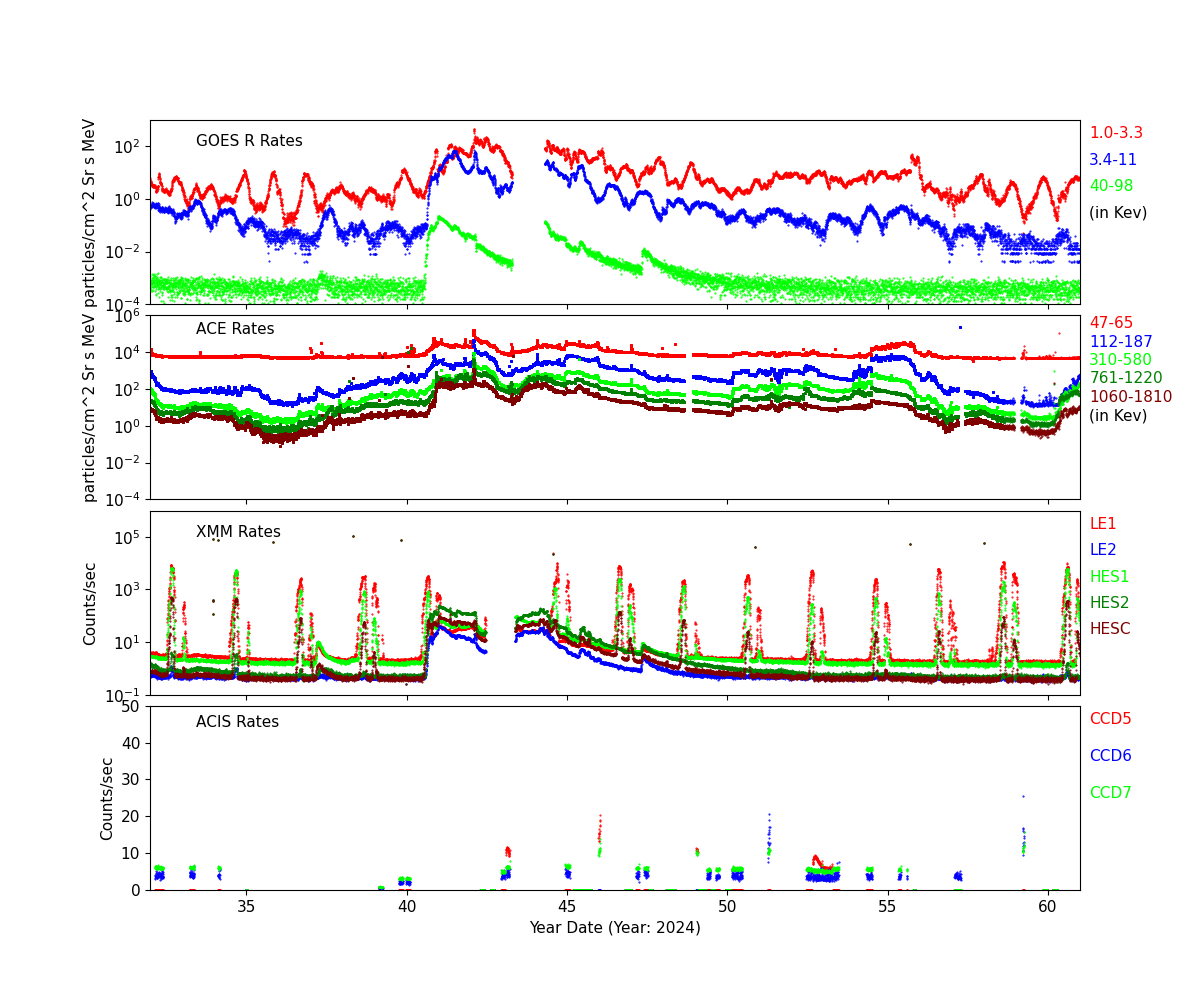
Radiation History
Radiation Count Rates of Feb 2024
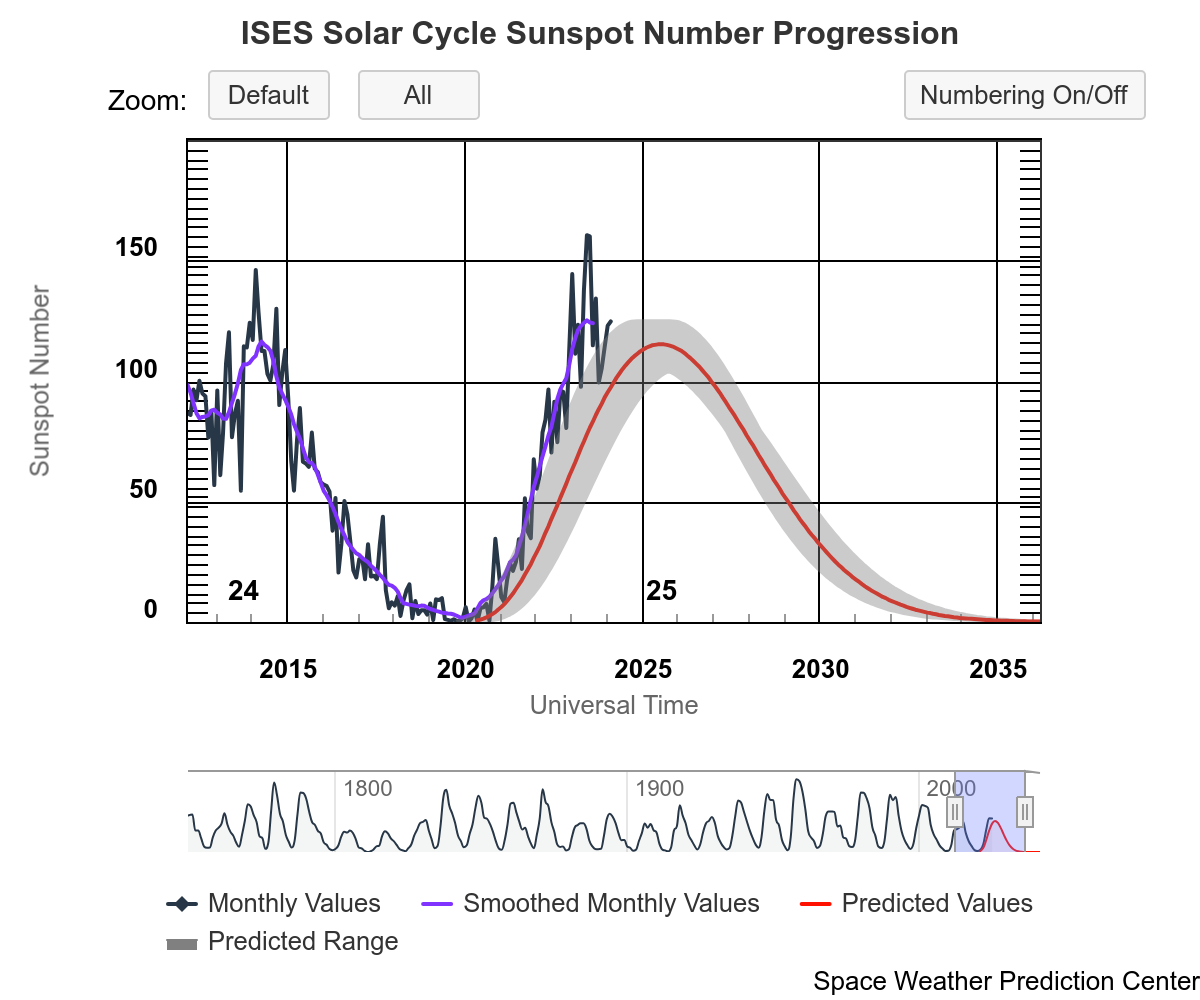
Sun Spot History (See:NOAA Page)
Trending
Quarterly Trends
- HRC Temperature
| Previous Quarter | |||||||
| MSID | MEAN | RMS | DELTA/YR | DELTA/YR/YR | UNITS | DESCRIPTION | |
| 2ceahvpt | 0.001 | 5.568e-04 | (2.79+/-0.01)e2 | 0.14 +/- 0.41 | K | CEA RADIATOR TEMPERATURE AT CENTER | |
|---|---|---|---|---|---|---|---|
| 2chtrpzt | 7.657e-04 | 5.485e-04 | (2.76+/-0.01)e2 | 0.15 +/- 0.40 | K | CENTRAL ELECTRONICS BOX TEMP | |
| 2condmxt | 0.001 | 8.217e-04 | (2.70+/-0.02)e2 | -0.87 +/- 0.54 | K | CONDUIT -X FACE TEMPERATURE | |
| 2dcentrt | 7.479e-04 | 2.794e-04 | (2.74+/-0.01)e2 | 0.17 +/- 0.21 | K | DETECTOR HOUSING TEMP 2 | |
| 2dtstatt | 0.003 | 4.523e-04 | (2.70+/-0.01)e2 | 0.07 +/- 0.32 | K | DETECTOR HOUSING TEMP 1 | |
| 2fhtrmzt | 0.006 | 0.001 | (2.65+/-0.03)e2 | -1.01 +/- 0.91 | K | FRONT END ELECTRONICS BOX TEMPERATURE | |
| 2fradpyt | 0.005 | 0.001 | (2.63+/-0.03)e2 | -1.18 +/- 0.88 | K | FRONT END ASSEMBLY +Y AT RADIATOR CENTER TEMP | |
| 2pmt1t | -0.003 | 6.786e-04 | (2.83+/-0.02)e2 | 0.12 +/- 0.42 | K | PMT 1 TEMPERATURE | |
| 2pmt2t | -0.002 | 6.911e-04 | (2.83+/-0.02)e2 | 0.21 +/- 0.43 | K | PMT 2 TEMPERATURE | |
| 2uvlspxt | -6.398e-04 | 4.948e-04 | (2.75+/-0.01)e2 | 0.36 +/- 0.36 | K | UV LIGHT SHIELD NEXT TO SNOUT TEMP | |
- HRC HK
| Previous Quarter | |||||||
| MSID | MEAN | RMS | DELTA/YR | DELTA/YR/YR | UNITS | DESCRIPTION | |
| 2fe00atm | -3.621e-04 | 0.006 | -1.20 +/- 3.15 | 0.56 +/- 0.12 | C | Front end temperature | |
|---|---|---|---|---|---|---|---|
| 2fepratm | on | 0.075 | 0.004 | 25.19 +/- 1.89 | -2.48 +/- 1.79 | C | FE temp card temperature | off | 3.976e-04 | 0.005 | -1.11 +/- 3.12 | 0.57 +/- 0.11 |
| 2imhvatm | on | 0.046 | 0.003 | 31.71 +/- 1.25 | -1.31 +/- 1.13 | C | Imaging det HVPS temperature | off | 0.008 | 0.003 | 16.31 +/- 1.64 | -0.02 +/- 0.12 |
| 2iminatm | on | 0.064 | 0.003 | 20.52 +/- 1.59 | -1.25 +/- 1.57 | C | Imaging det temperature | off | 0.002 | 0.001 | 1.29 +/- 0.67 | 0.27 +/- 0.06 |
| 2lvplatm | on | 0.036 | 0.003 | 28.00 +/- 1.17 | -1.19 +/- 1.10 | C | LVPS plate temperature | off | -0.003 | 0.003 | 10.20 +/- 1.51 | 0.14 +/- 0.09 |
| 2prbscr | on | 0.001 | 1.075e-04 | 1.76 +/- 0.05 | -0.03 +/- 0.05 | AMP | Primary bus current | off | 7.708e-06 | 2.818e-05 | 1.71 +/- 0.02 | (8.30+/-152.50)e-5 |
| 2prbsvl | 9.826e-04 | 2.024e-04 | 26.76 +/- 0.12 | -0.04 +/- 0.01 | V | Primary bus voltage | |
| 2smtratm | on | 2.481e-13 | 2.768e-09 | 5.94 +/- 0.00 | (2.46+/-13.58)e-13 | C | Selected motor temperature | off | -3.541e-15 | 999.000 | 5.66 +/- 0.00 | (2.67+/-1.54)e-14 |
| 2sphvatm | on | -0.002 | 0.003 | 31.48 +/- 1.19 | -0.02 +/- 1.24 | C | Spect det HVPS temperature | off | -0.018 | 0.003 | 16.55 +/- 1.78 | 0.31 +/- 0.08 |
| 2spinatm | on | 0.054 | 0.003 | 19.08 +/- 1.49 | -1.14 +/- 1.53 | C | Spect det temperature | off | -0.001 | 0.001 | 3.46 +/- 0.78 | 0.09 +/- 0.05 |
- PCAD Temperature
| Previous Quarter | |||||||
| MSID | MEAN | RMS | DELTA/YR | DELTA/YR/YR | UNITS | DESCRIPTION | |
| aacccdpt | 5.140e-05 | 7.863e-04 | (2.65+/-0.02)e2 | 0.47 +/- 0.47 | K | AC CCD TEMP (PRI) | |
|---|---|---|---|---|---|---|---|
| aacccdrt | 1.529e-04 | 8.473e-04 | (3.09+/-0.02)e2 | 0.57 +/- 0.51 | K | AC CCD TEMP (RDNT) | |
| aach1t | 2.078e-04 | 8.645e-04 | (3.06+/-0.02)e2 | 0.46 +/- 0.52 | K | AC HOUSING TEMP (ACH1) | |
| aach2t | 2.692e-04 | 8.665e-04 | (3.06+/-0.02)e2 | 0.54 +/- 0.52 | K | AC HOUSING TEMP (ACH2) | |
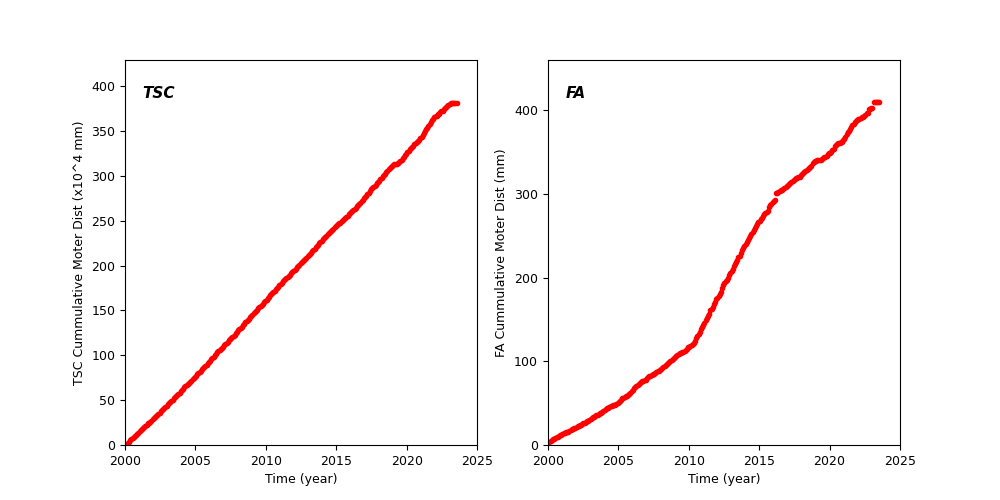
Spacecraft Motions
TSC and FA Cummulative Moter Distance
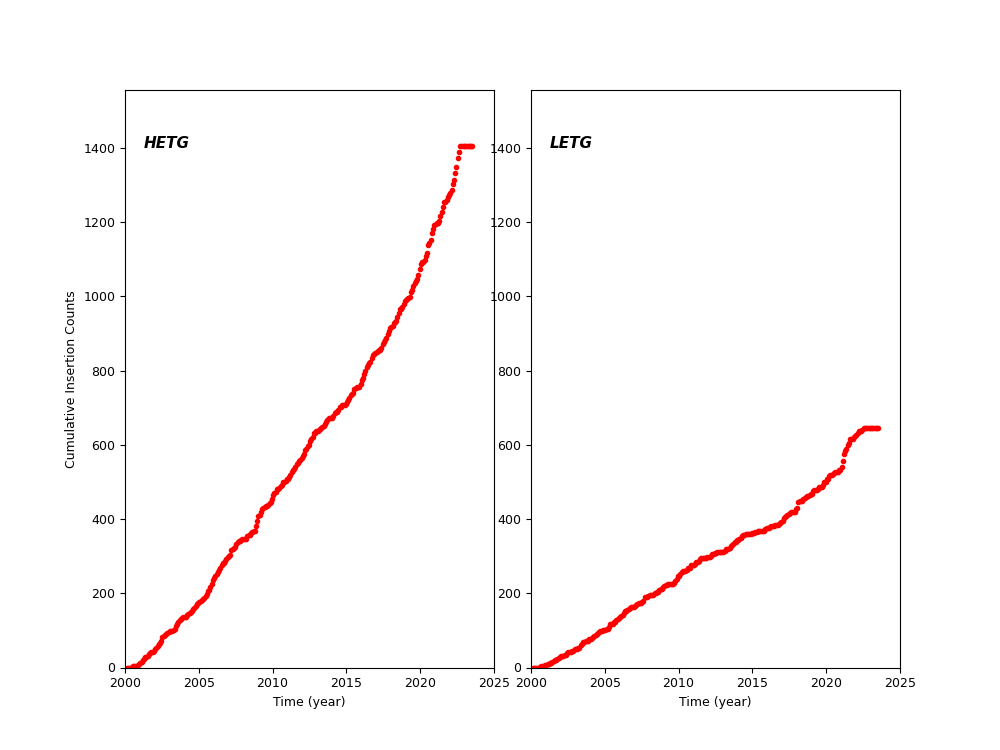
HETG and LETG Cummulative Insertion Counts
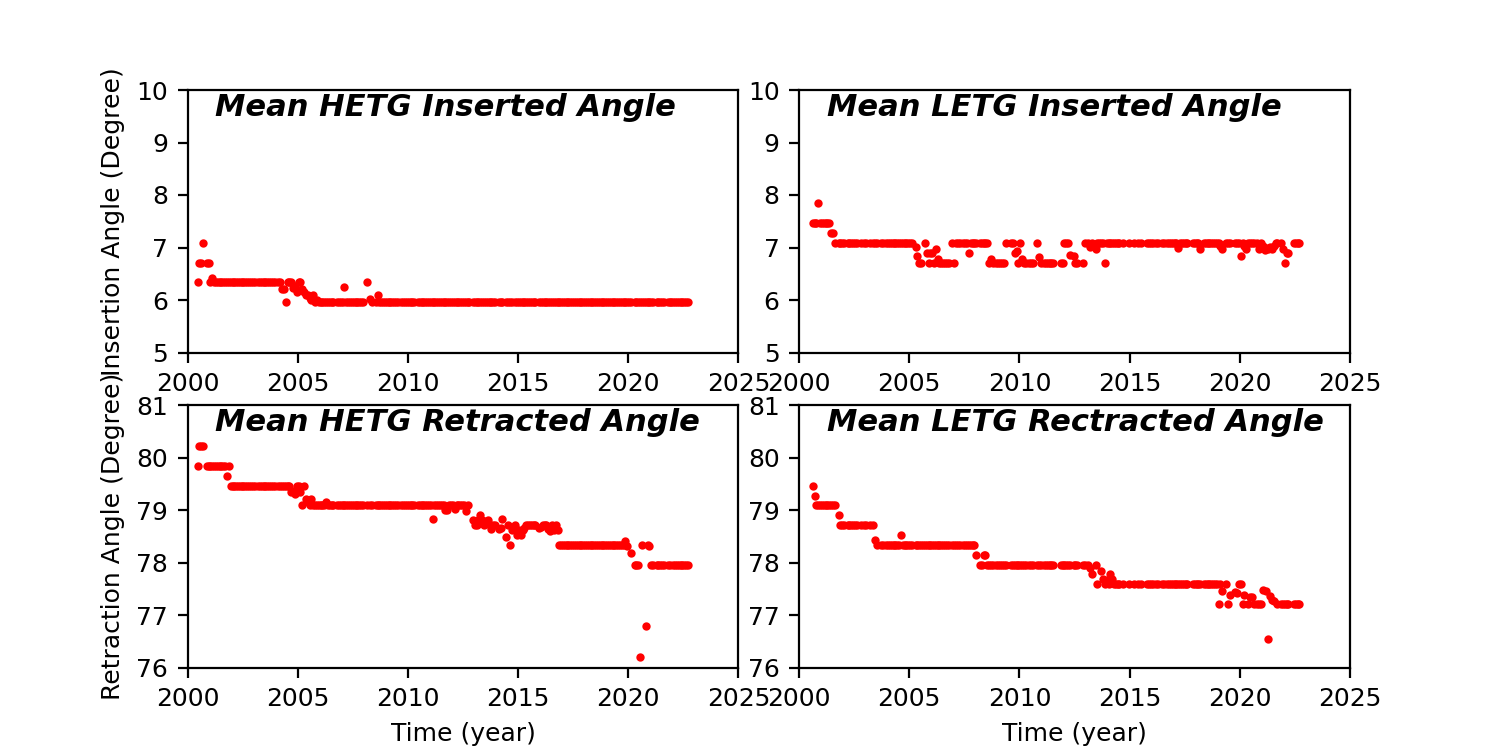
HETG/LETG Insertion/Retraction Angle
Reaction Wheel Rotations