ACIS
ACIS DOSE Registered-Photon-Map
The steps we took to compute the dose map are;
- Level 1 Event files for a specified month are obtained from archive.
- Image data including I2, I3, S2, S3 CCDs are extracted from all event files.
- All the extracted image data were merged to create a month long exposure map for the month.
- The exposure map is opened with ds9, and check a distribution of count rates against energy. From this, estimate the upper threshold value. Any events beyond this upper threshold are assumed erroneous events such as bad pixels.
- Using this upper threshold, the data is filtered, and create a cleaned exposure map for the month.
- The exposure map from each month from the Sep 1999 is added up to create a cumulative exposure map for each month.
- Using fimgstatistic, we compute count rate statistics for each CCDs.
- For observations with high data drop rates (e.g., Crab nebula, Cas A), we corrected the observations by adding events.
Please check more detail plots at Telemetered Photon Dose Trend page.
)
)
)
Statistics:
# IMAGE     NPIX     MEAN        RMS        MIN     MAX
ACIS_mar24 6004901       3.376         4.456           0.0      485


I2 node 0  262654	3.069384	2.000512	0.0	 54.0
I2 node 1  262654	3.255191	2.186274	0.0	140.0
I2 node 2  262654	3.196501	2.029361	0.0	 88.0
I2 node 3  262654	3.158606	2.357663	0.0	426.0

I3 node 0  262654	3.483809	2.161509	0.0	 80.0
I3 node 1  262654	3.512888	2.169399	0.0	107.0
I3 node 2  262654	3.318128	2.045953	0.0	 61.0
I3 node 3  262654	3.398277	2.213983	0.0	364.0

S2 node 0  262654	4.783134	4.020161	0.0	395.0
S2 node 1  262654	4.929774	4.678381	0.0	485.0
S2 node 2  262654	5.113484	5.157307	0.0	445.0
S2 node 3  262654	5.004535	4.410823	0.0	471.0

S3 node 0  262654	6.426869	4.666388	0.0	208.0
S3 node 1  262654	7.409905	4.536382	0.0	209.0
S3 node 2  262654	7.057525	3.893213	0.0	187.0
S3 node 3  262654	6.083329	3.036897	0.0	134.0
)
)
)
Statistics:
 IMAGE     NPIX      MEAN        RMS           MIN      MAX
ACIS_total   6004901       2681.912         3405.830           0.0   156594


I2 node 0  262654	2328.579340	471.768459	497.0	14953.0
I2 node 1  262654	2453.718285	683.773113	506.0	154588.0
I2 node 2  262654	2481.605736	526.011674	533.0	16206.0
I2 node 3  262654	2485.825179	643.825361	497.0	34496.0

I3 node 0  262654	2676.846900	659.798517	497.0	14694.0
I3 node 1  262654	2758.823699	1750.673164	518.0	55992.0
I3 node 2  262654	2468.702156	462.315472	491.0	14971.0
I3 node 3  262654	2448.405654	497.831389	460.0	35700.0

S2 node 0  262654	3128.465410	505.362624	1693.0	22543.0
S2 node 1  262654	3321.126548	755.948130	1871.0	18461.0
S2 node 2  262654	3681.729573	760.437661	2285.0	32661.0
S2 node 3  262654	3639.622897	614.172226	2009.0	81391.0

S3 node 0  262654	5542.495535	2995.600618	2439.0	54891.0
S3 node 1  262654	6762.865826	2387.453656	0.0	69061.0
S3 node 2  262654	5496.196580	1363.266412	2567.0	27502.0
S3 node 3  262654	4312.856587	769.622641	2605.0	26640.0
)
|
)
|
)
|
)
|
| Dec 2023 | Sep 2023 | Jun 2023 | Mar 2023 |
|---|
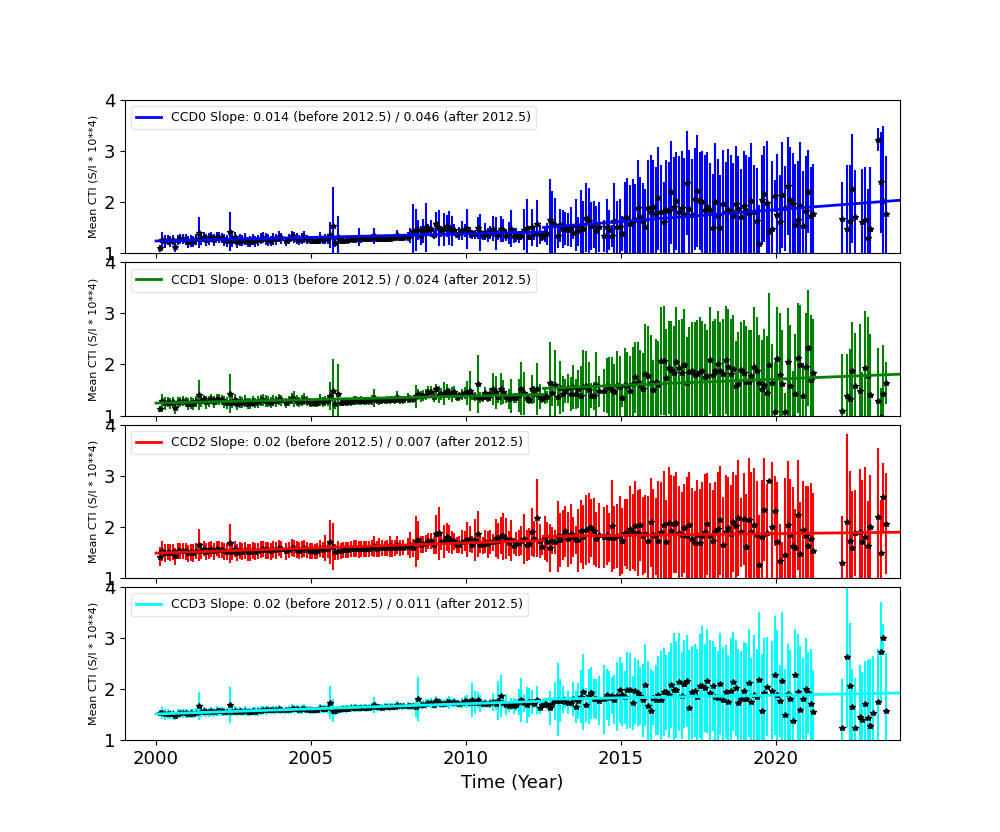
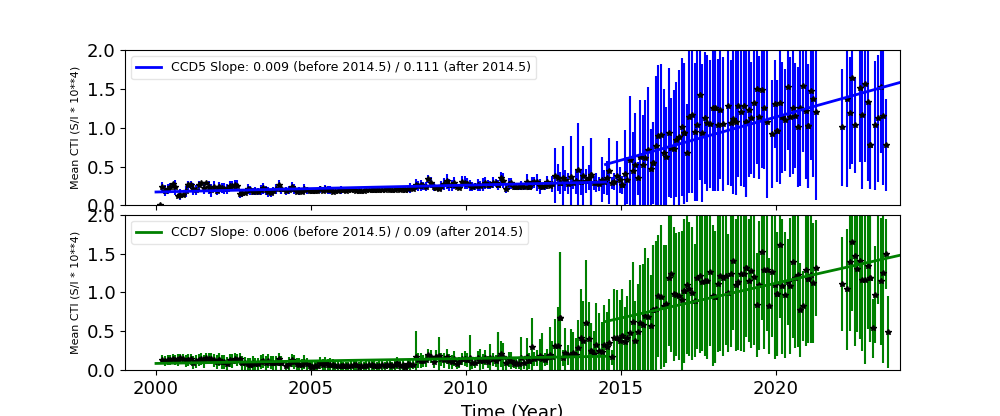
The Mean Detrended CTI
We report CTIs with a refined data definition. CTIs were computed for the temperature dependency corrected data. Please see CTI page for detailed explanation. CTI's are computed for Mn K alpha, and defined as slope/intercept x10^4 of row # vs ADU. Data file: here
Imaging CCDs
Spectral CCDs
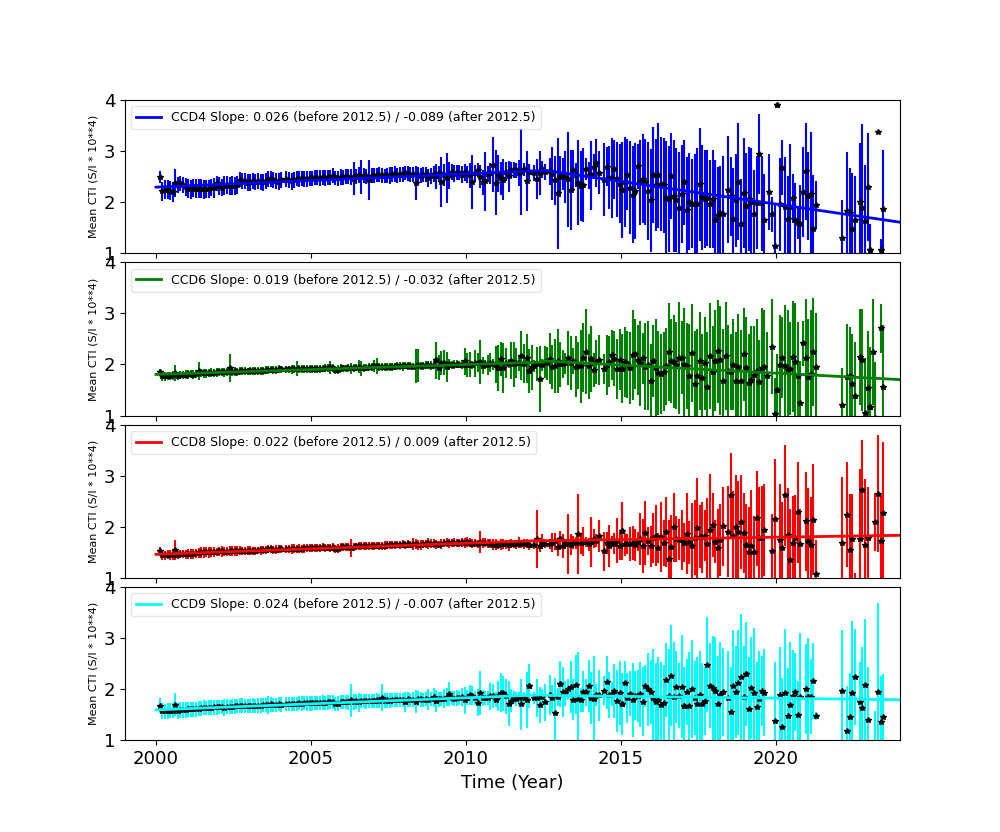
Backside CCDs
Focal Plane Temperature
Mar 2024 Focal Temperature
| The Mean (max) FPT: | |
|---|---|
| -107.53 | +/- 7.69 C |
| Mean Width: | |
| 0.8 | +/- 0.58 days |
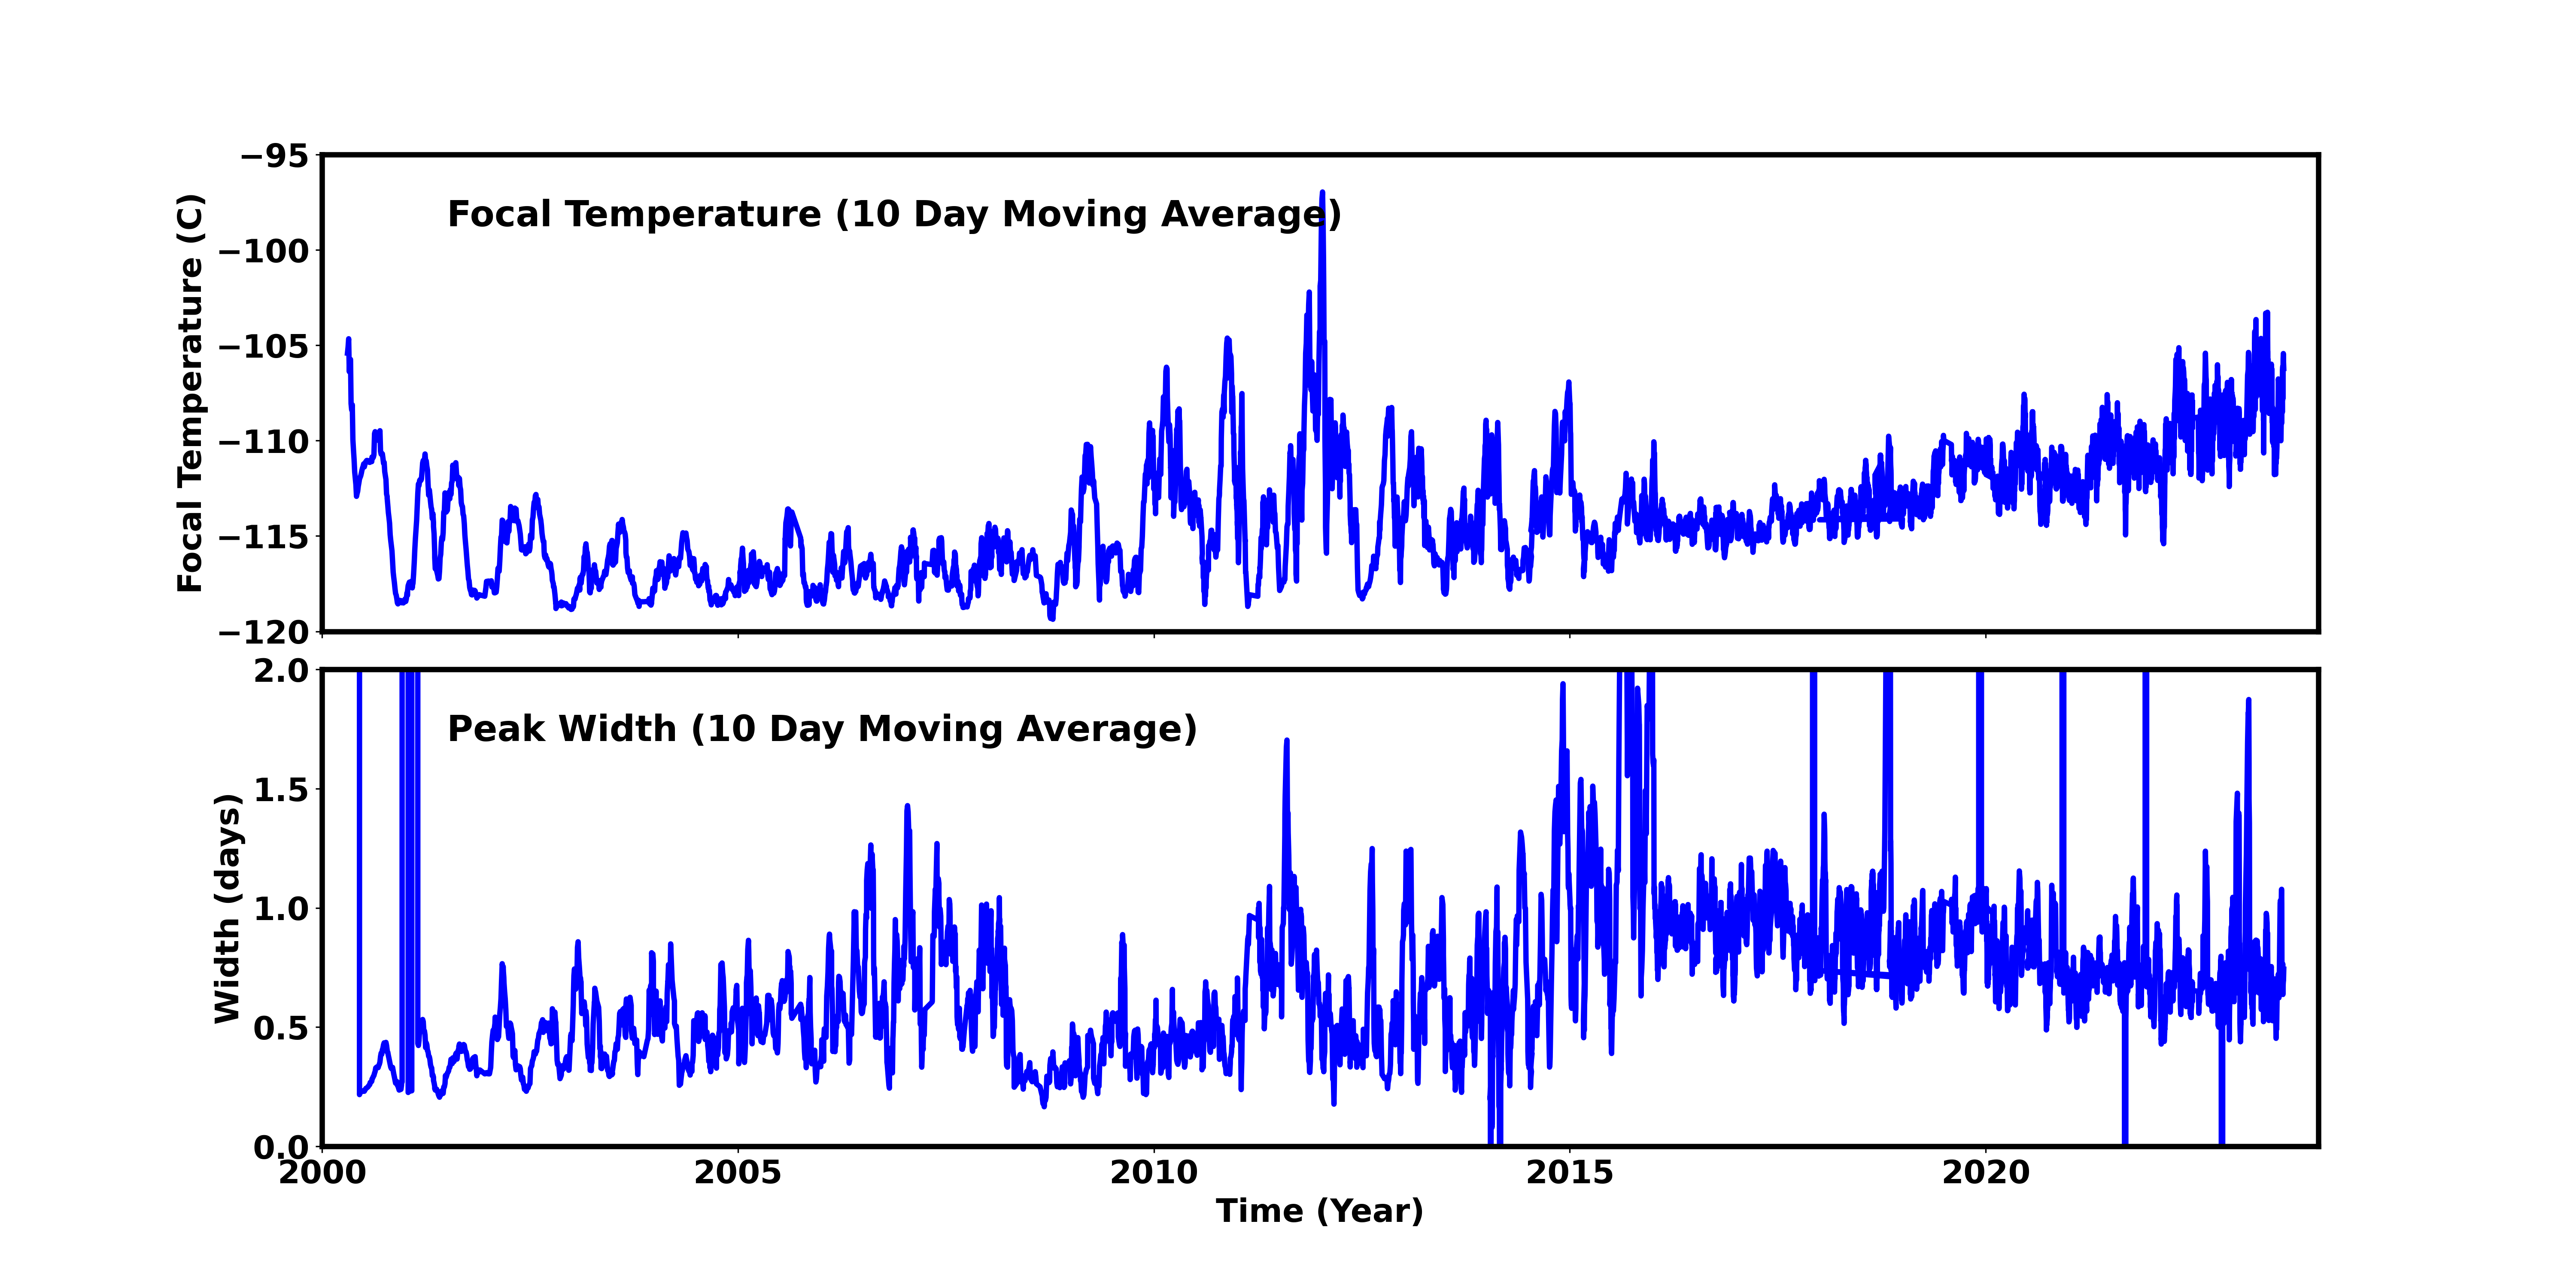
Averaged Focal Plane Temperature
We are using 10 period moving averages to show trends of peak temperatures and peak widths. Note, the gaps in the width plot are due to missing/corrupted data.
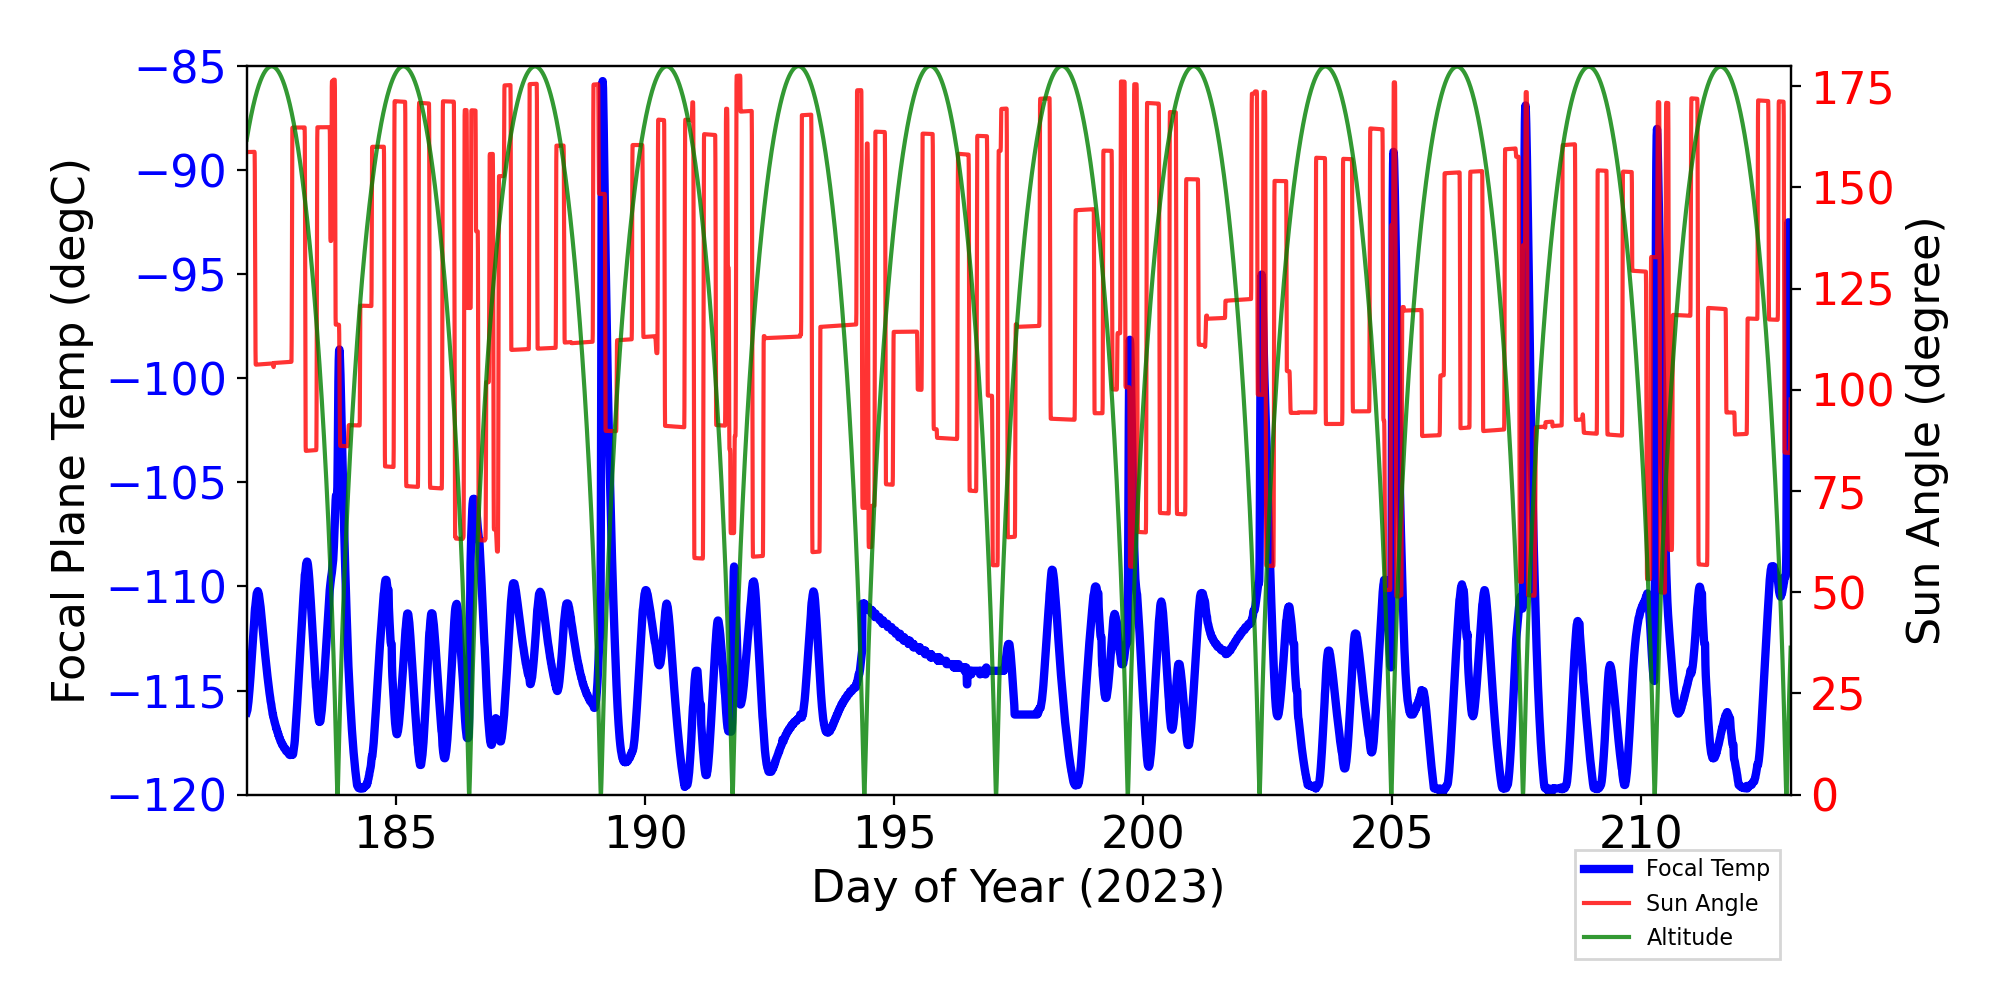
Focal Plane Temperature, Sun Angle and Altitude
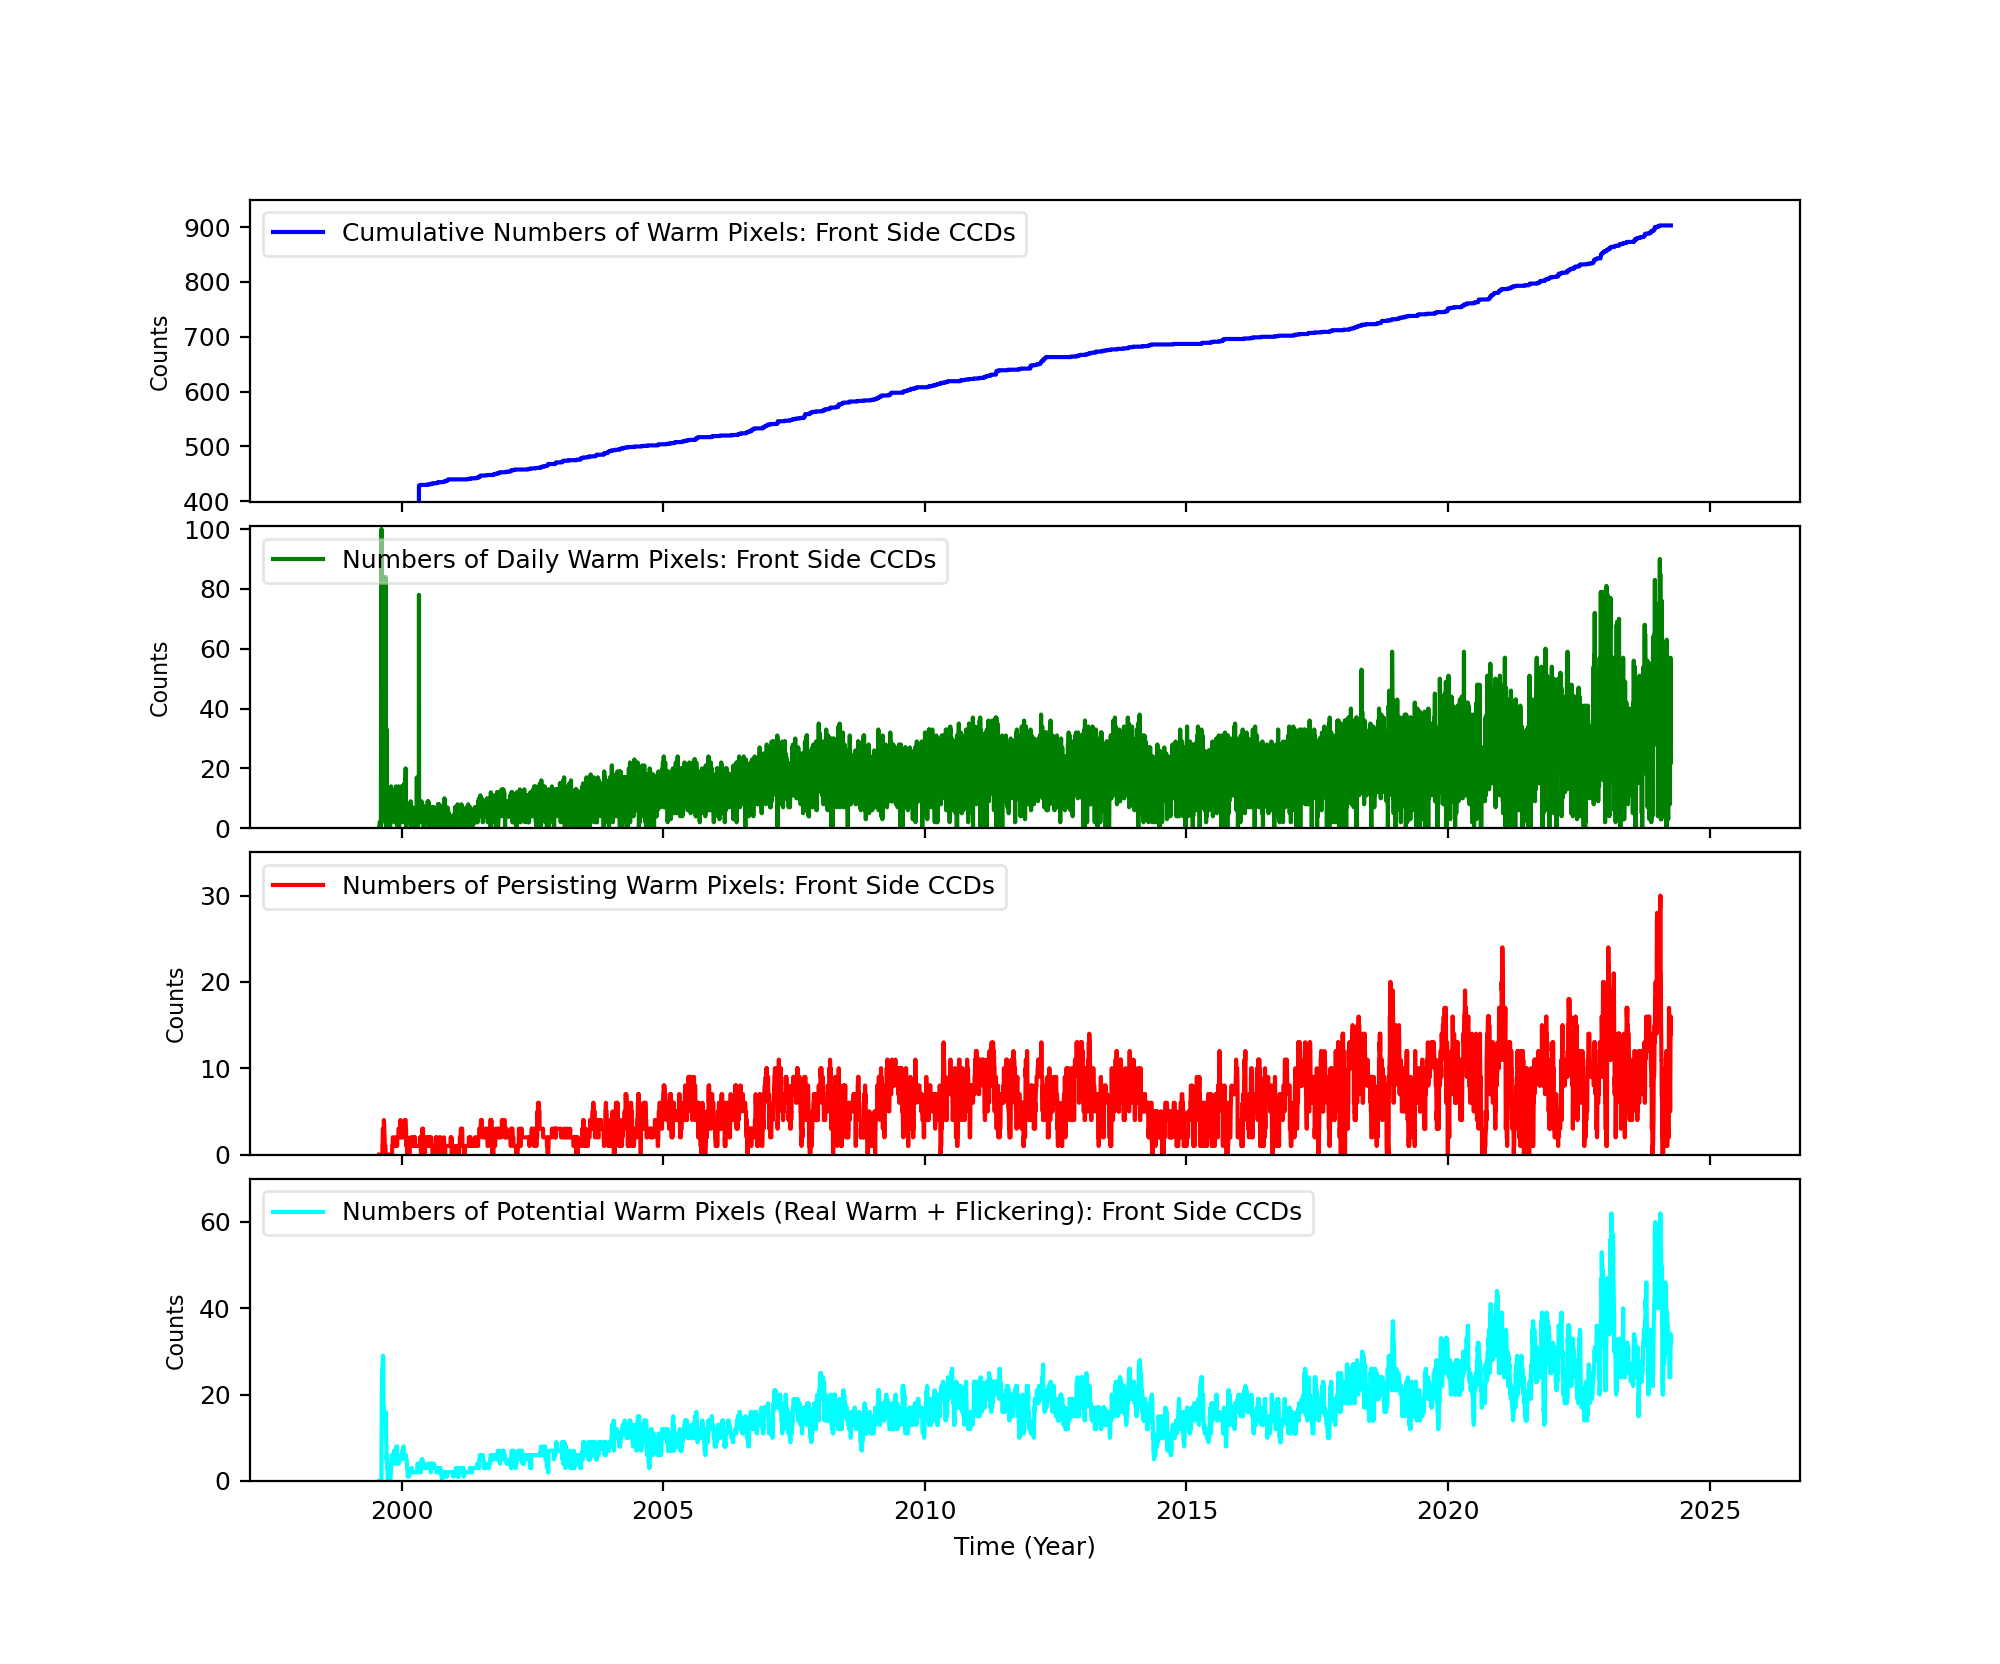
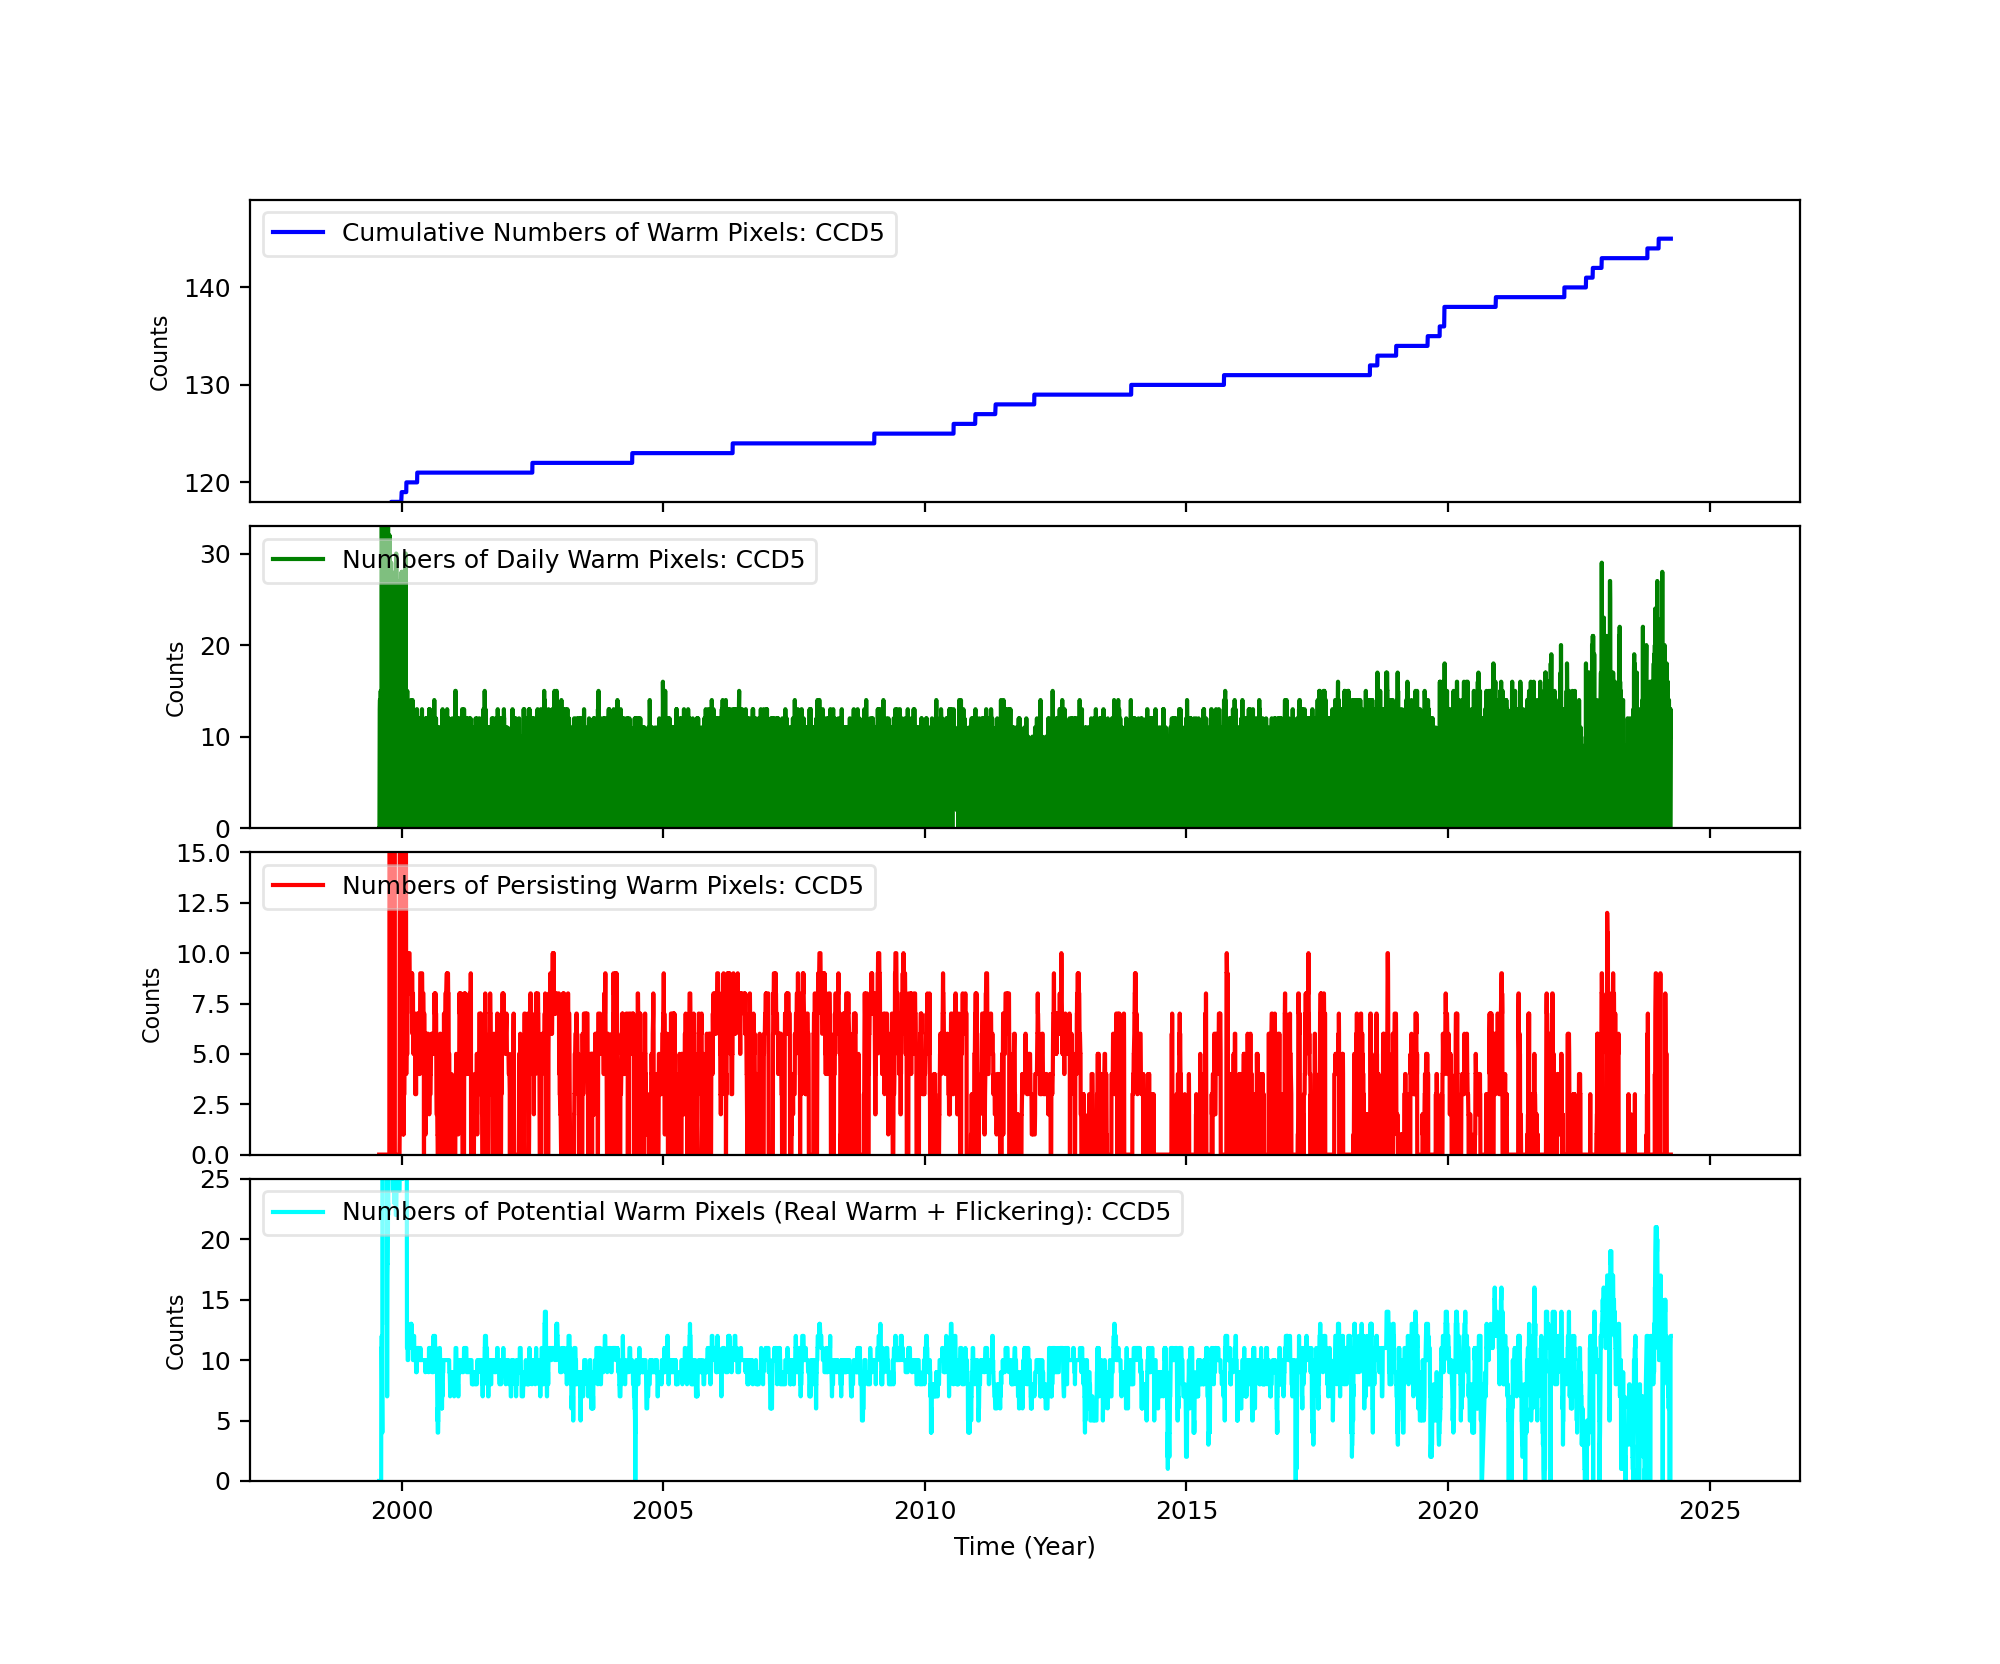
Bad Pixels
The plots below were generated with a new warm pixel finding script. Please see Acis Bad Pixel Page for details.
Front Side CCDs
Back Side CCD (CCD5)
Science Instrument Background Rates
| Name | Low (keV) | High(KeV) | Description |
|---|---|---|---|
| SSoft | 0.00 | 0.50 | Super soft photons |
| Soft | 0.50 | 1.00 | Soft photons |
| Med | 1.00 | 3.00 | Moderate energy photons |
| Hard | 3.00 | 5.00 | Hard Photons |
| Harder | 5.00 | 10.00 | Very Hard photons |
| Hardest | 10.00 | Beyond 10 keV |


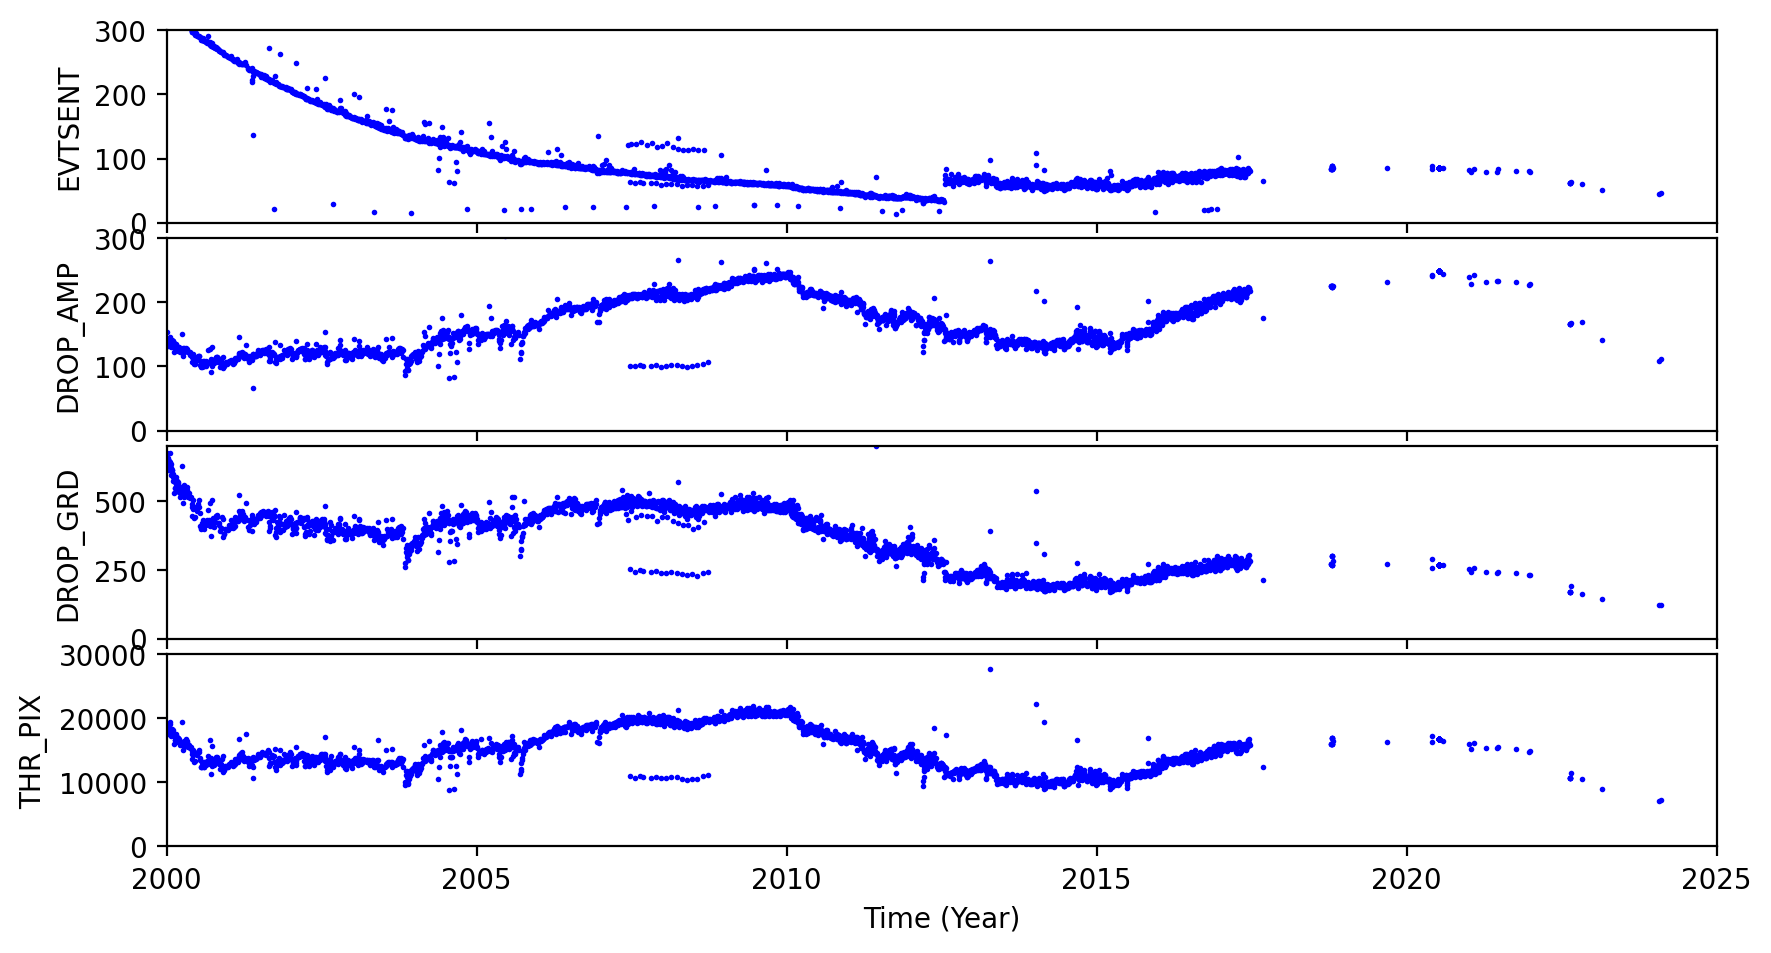
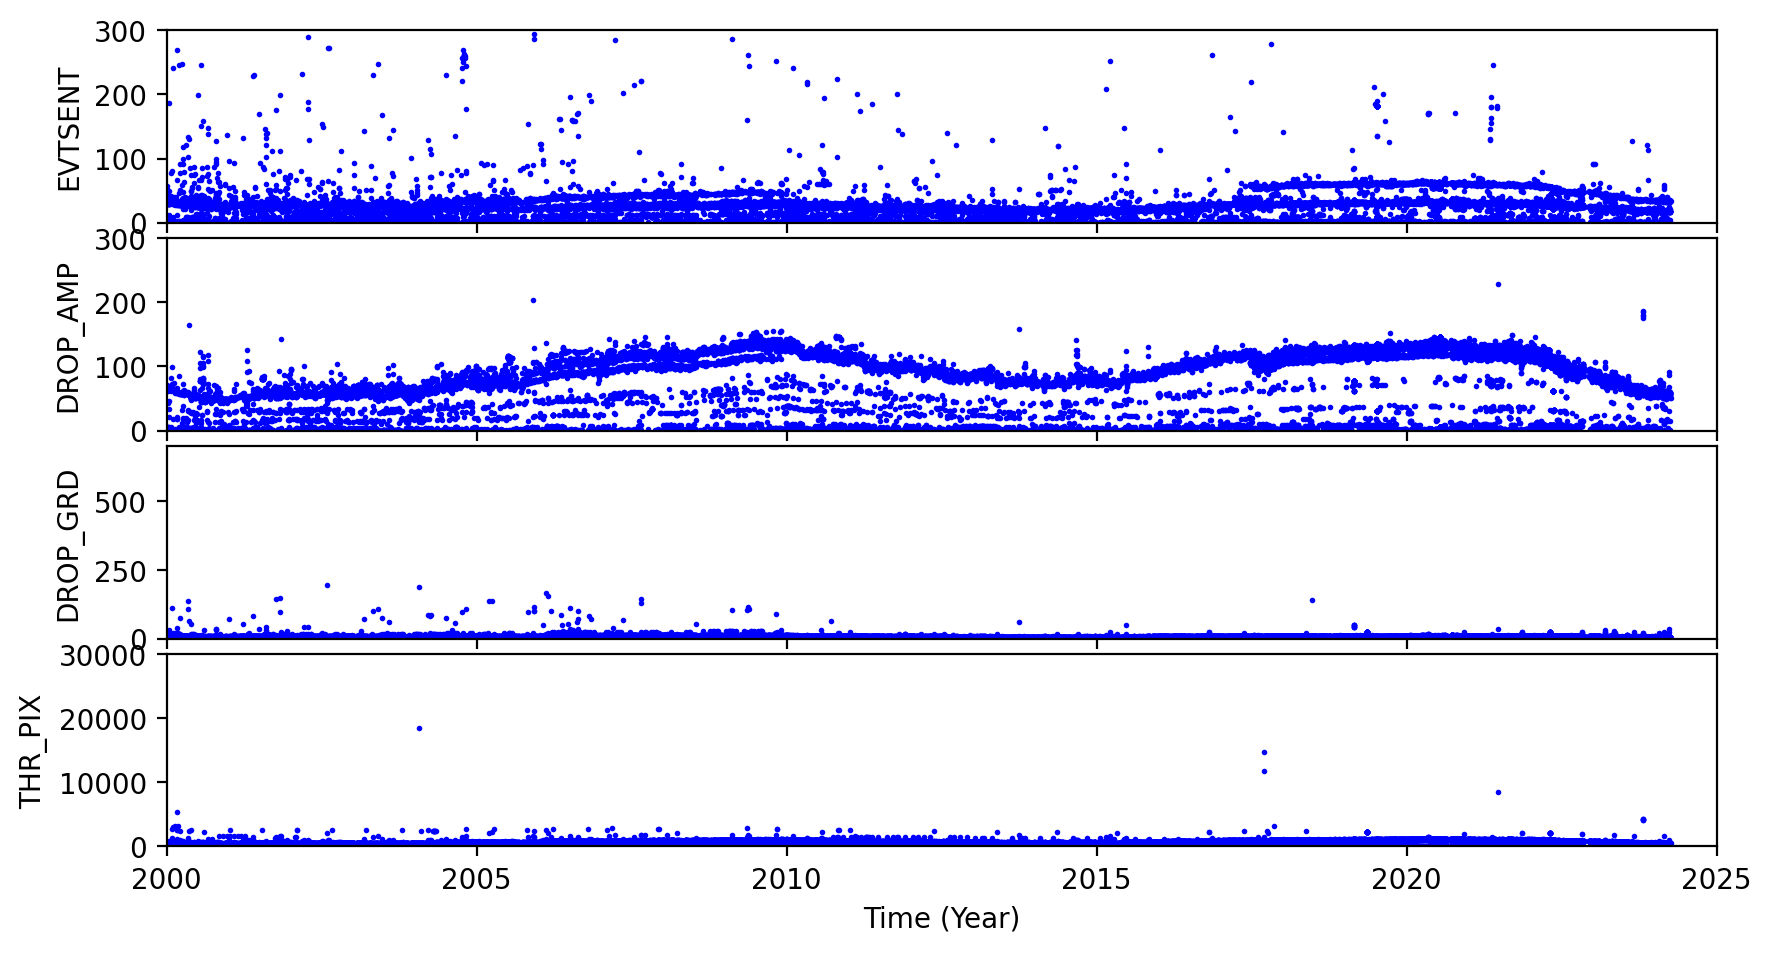
ACIS Rejected Events
The links below are plots of stat1 quantities, showing on-board rejected events. The average EVTSENT, DROP_AMP, DROP_POS, DROP_GRD, THR_PIX, and maximum BERR_SUM obtained from L1 acis*stat1.fits files are plotted for each observation. CTI observations are plotted separately from regular science observations.
Column definitions:
- EVTSENT - number of events sent in data record
- DROP_AMP - number of discarded events due to corrected amplitude
- DROP_POS - number of discarded events due to CCD position
- DROP_GRD - number of discarded events due to grade code
- THR_PIX - number of pixels above respective threshold level
- BERR_SUM - number of pixel bias errors so far in science run
Note the half-life decline of the CTI source is clearly evidenced in the steady janline of EVTSENT.
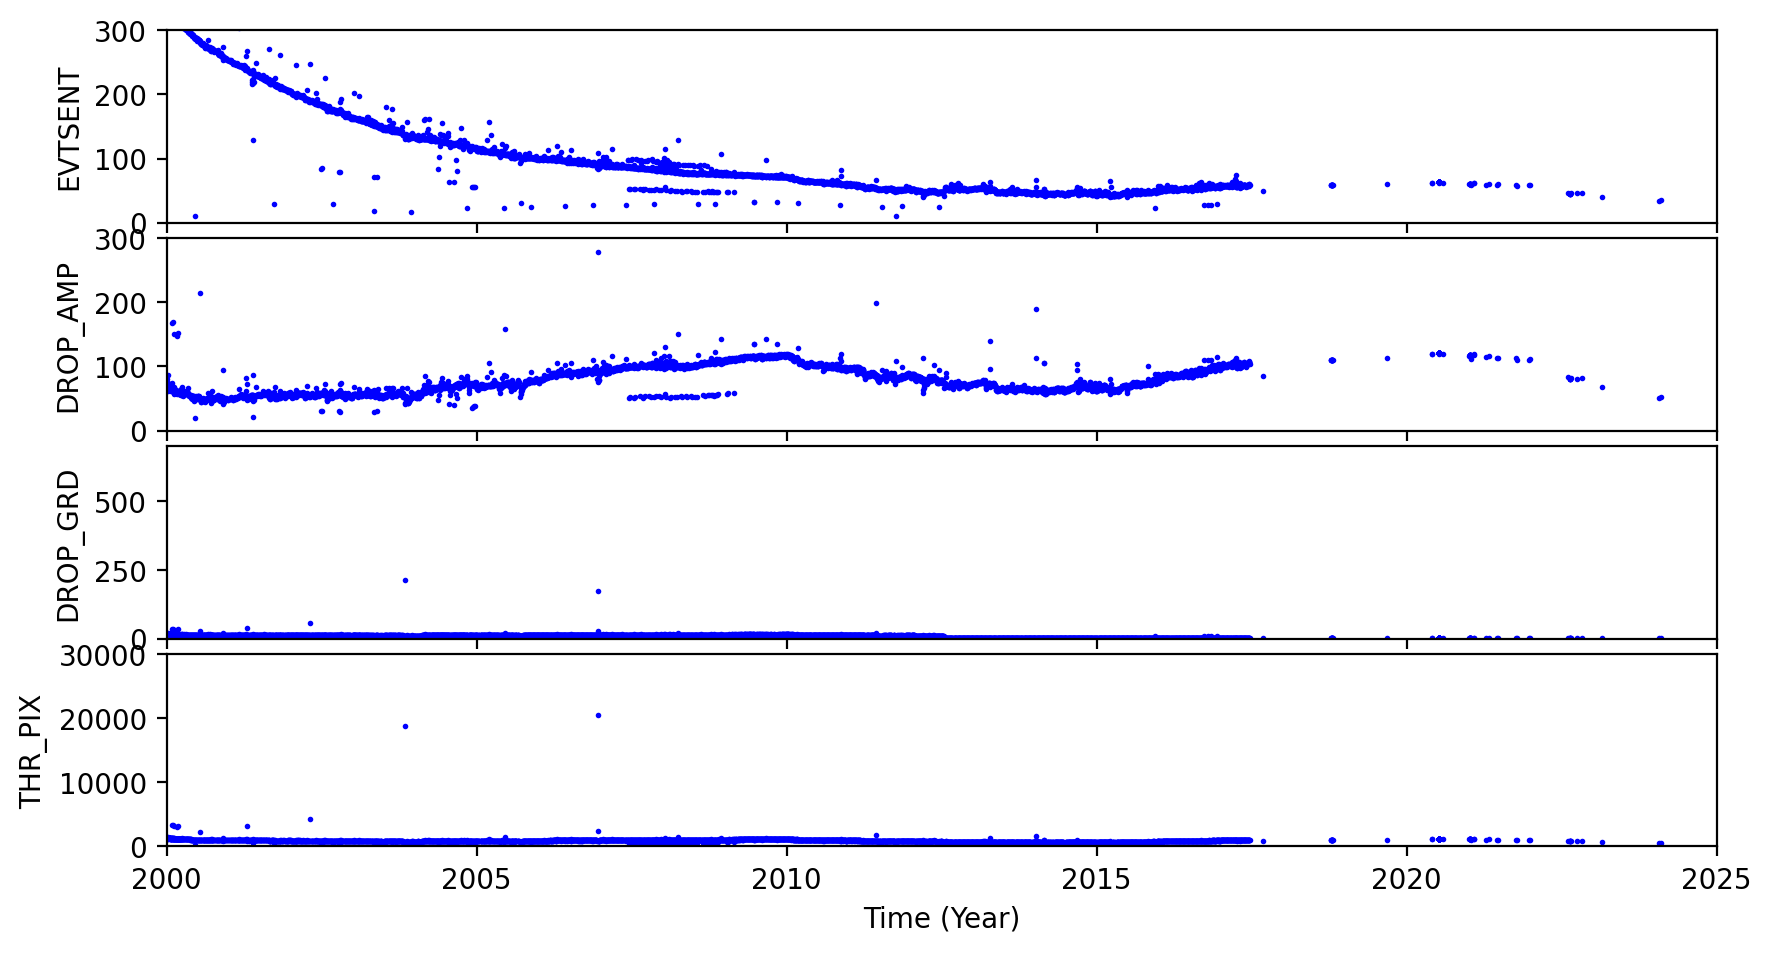
CCD3 Observations
| CTI | Science |
|
|
|---|
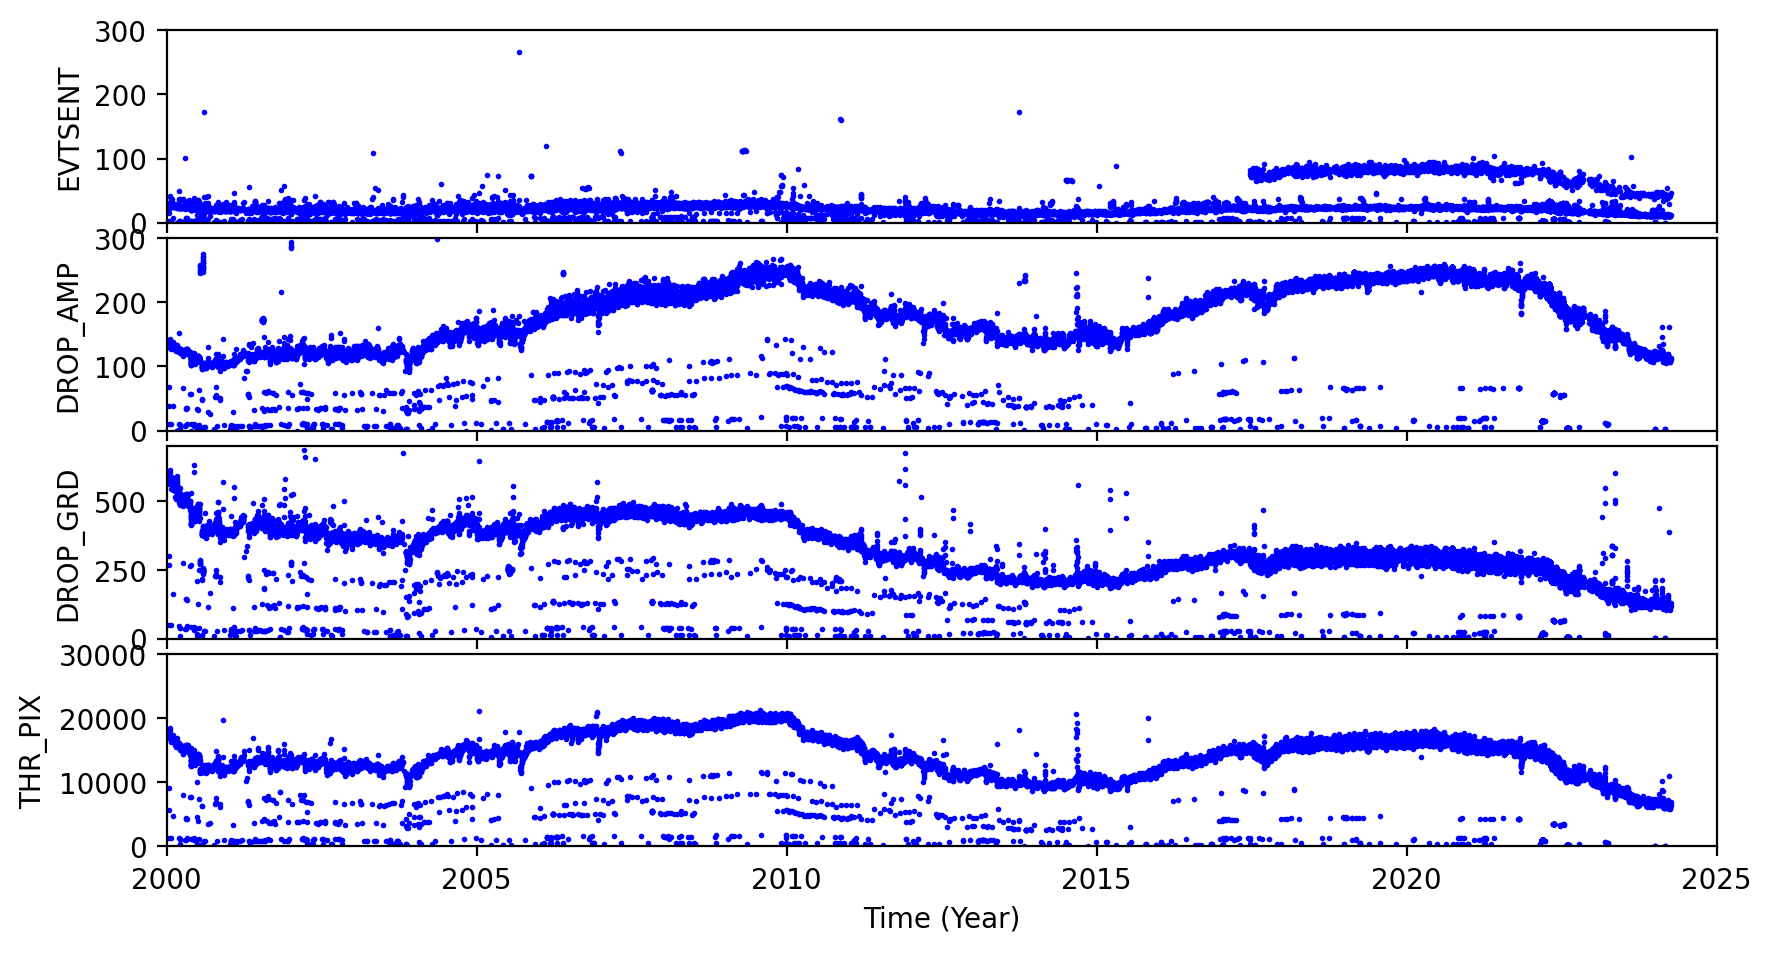
CCD7 Observations
| CTI | Science |
|
|
|---|
ACIS Gain Trends
We computed ACIS gain and offset from ACIS event1 files used in CTI computation, following the step described by C. Grant ACIS gain @ -120C page.
Instead computing gains and offsets from individual observations, we combined all data from each month and computed an monthly averaged gain and offset.
The following plots show CCD3 and CCD5 gains and offset trends.
| CCD 3 | |
)
|
)
|
| CCD 5 | |
)
|
)
|
[an error occurred while processing this directive]
HRC
DOSE of Central 4K Pore-Pairs
Please refer to Maximum Dose Trends for more details.
)
|
|---|
IMAGE                NPIX      MEAN    STDDEV      MIN       MAX
HRCI_03_2024.fits  16777216	0.037 	0.199 	0.000 	12.000
)
IMAGE                       NPIX      MEAN    STDDEV      MIN       MAX
HRCI_08_1999_03_2024.fits  16777216	na	na	na	na
)
|
|---|
IMAGE                NPIX      MEAN    STDDEV      MIN       MAX
HRCS_03_2024.fits  16777216	0.013 	0.118 	0.000 	3.000
)
IMAGE                       NPIX      MEAN    STDDEV      MIN       MAX
HRCS_08_1999_03_2024.fits  16777216	na	na	na	na
|
|
Max dose trend plots corrected for events that "pile-up"
in the center of the taps due to bad position information.
|
)
|
)
|
)
|
)
|
| Dec 2023 | Sep 2023 | Jun 2023 | Mar 2023 |
|---|
)
|
)
|
)
|
)
|
| Dec 2023 | Sep 2023 | Jun 2023 | Mar 2023 |
|---|
Gratings
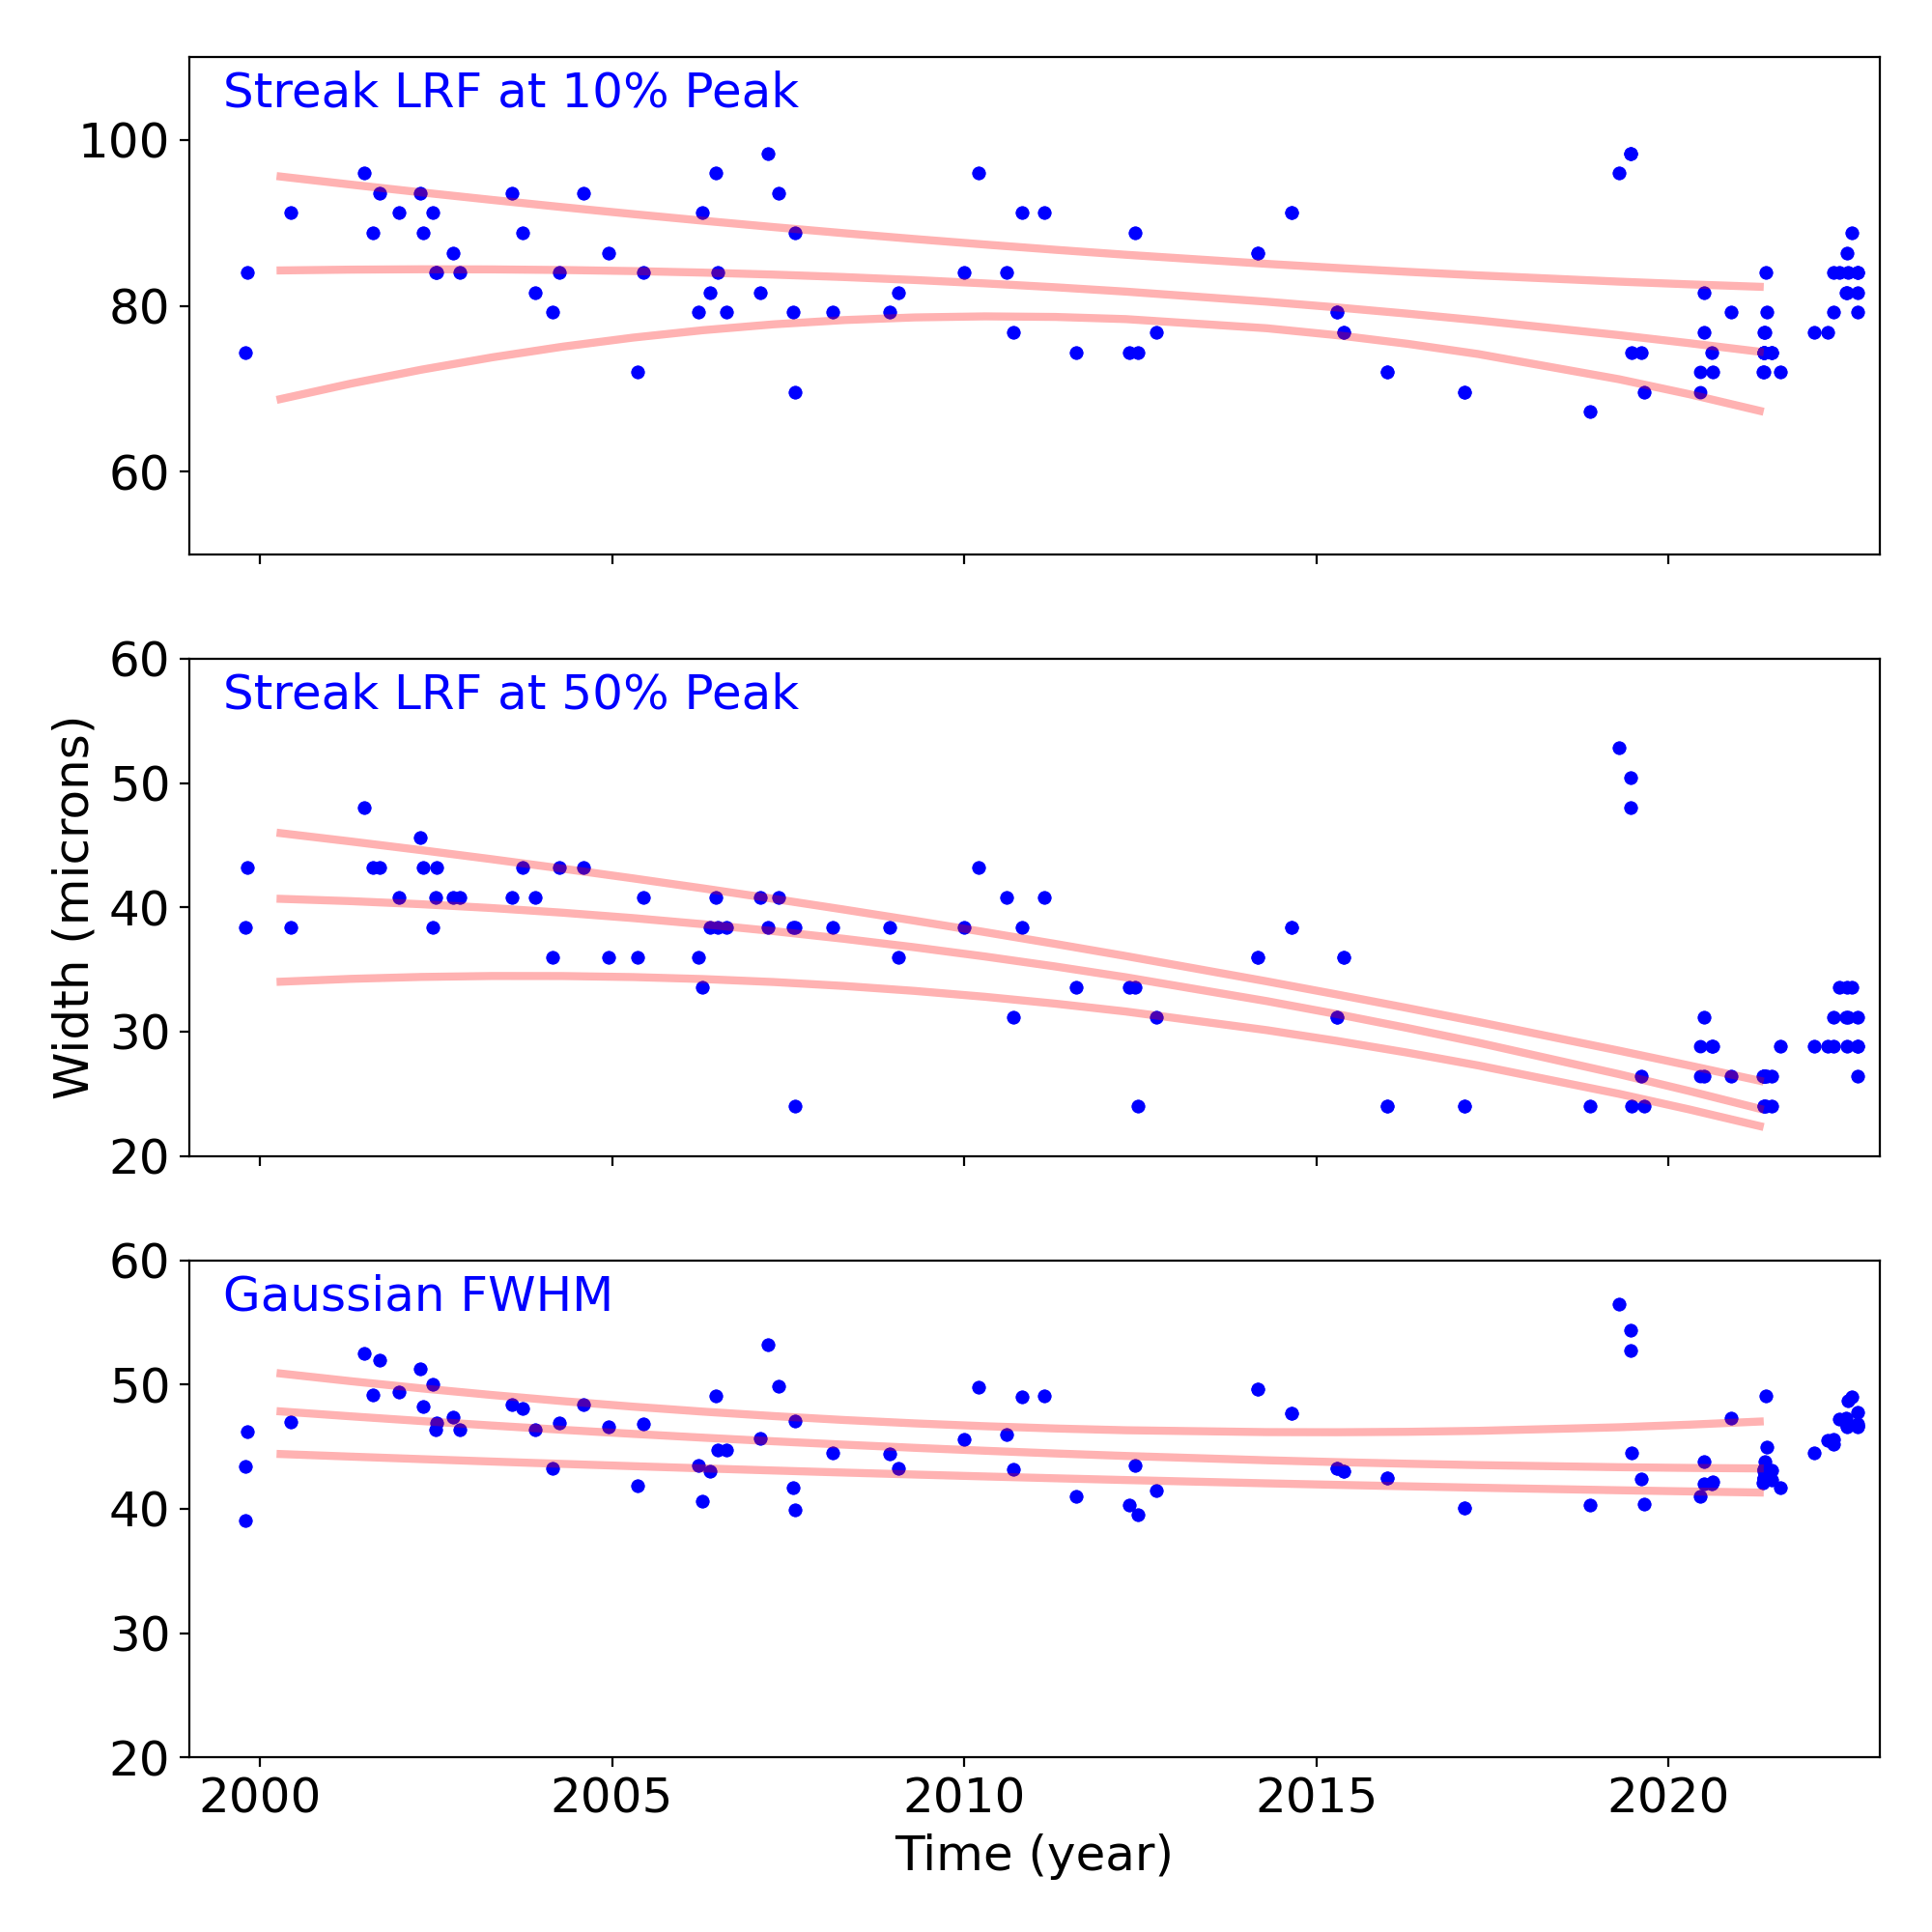
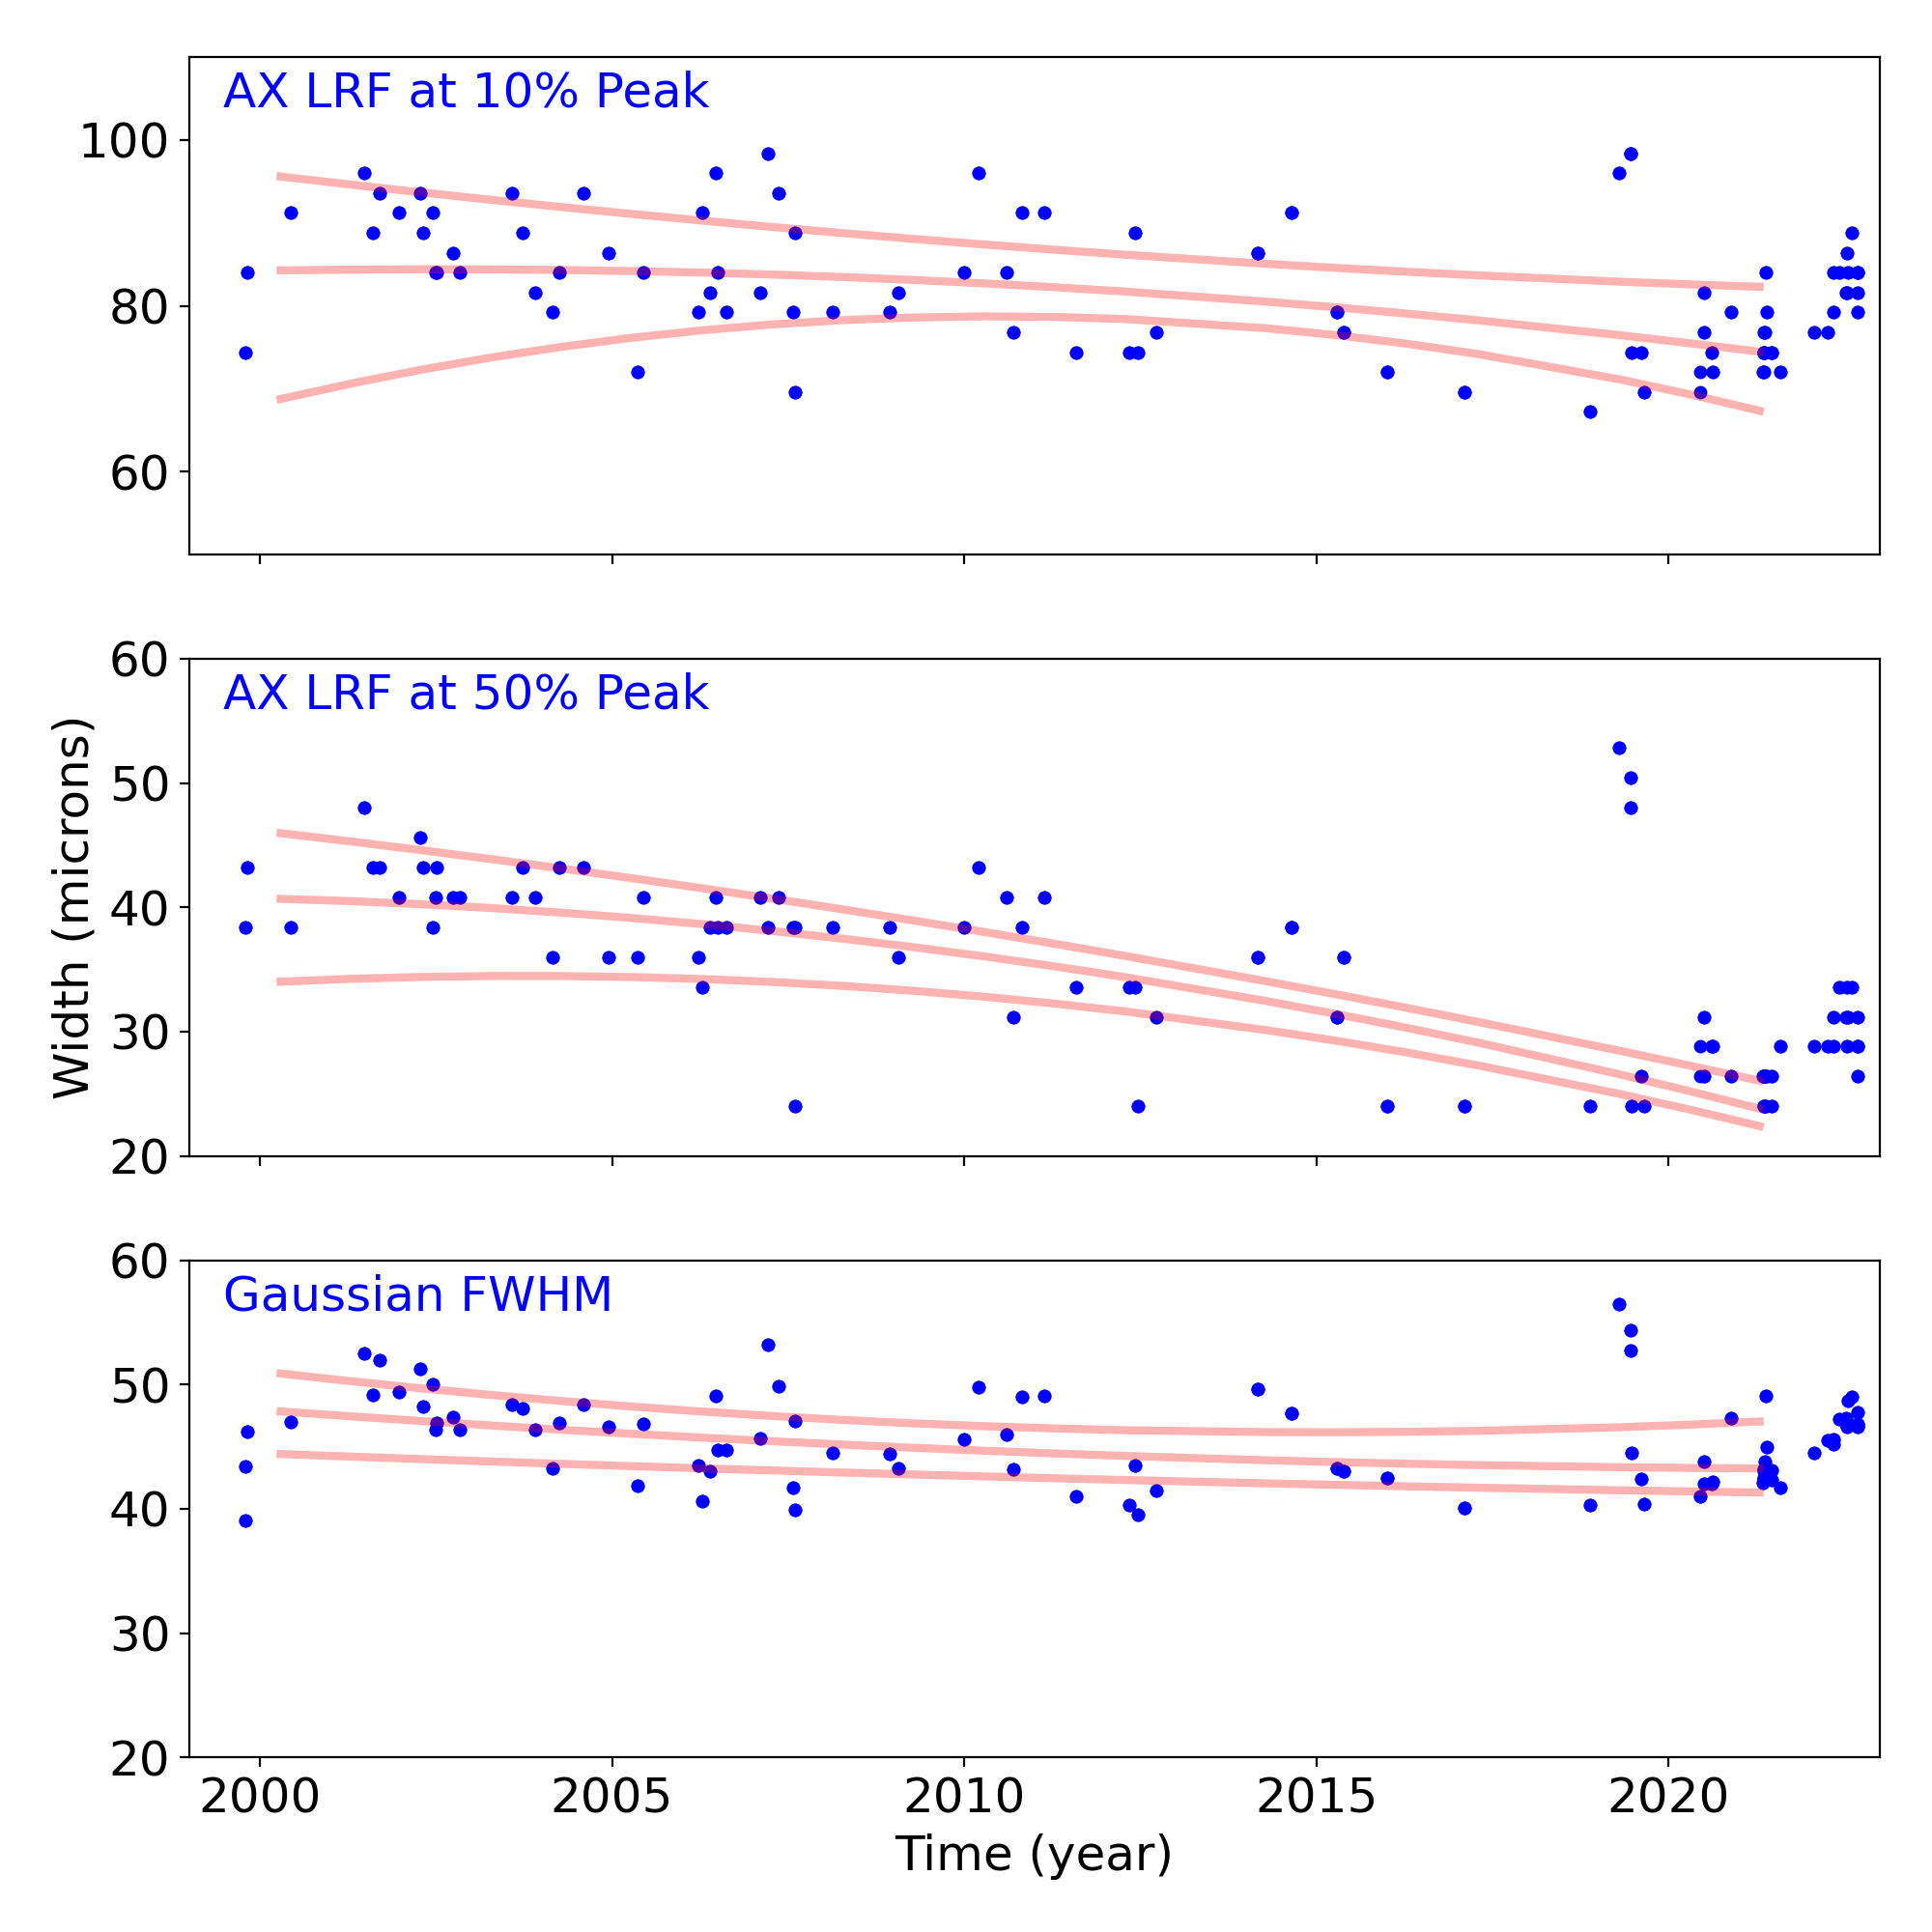
Grating Trends/Focus
We plot the width of the zero order streak of ACIS/HETG observations and the width of the zero order image for HRC/LETG observations of point sources. No significant defocusing trend is seen at this time. See Gratings Trends pages.
PCAD
ACA Trending
| ACIS |
)
|
)
|
)
|
|
|---|---|---|---|---|
)
|
)
|
)
| ||
| HRCI |
)
|
)
|
)
|
)
|
| HRCI |
)
|
)
|
)
|
)
|
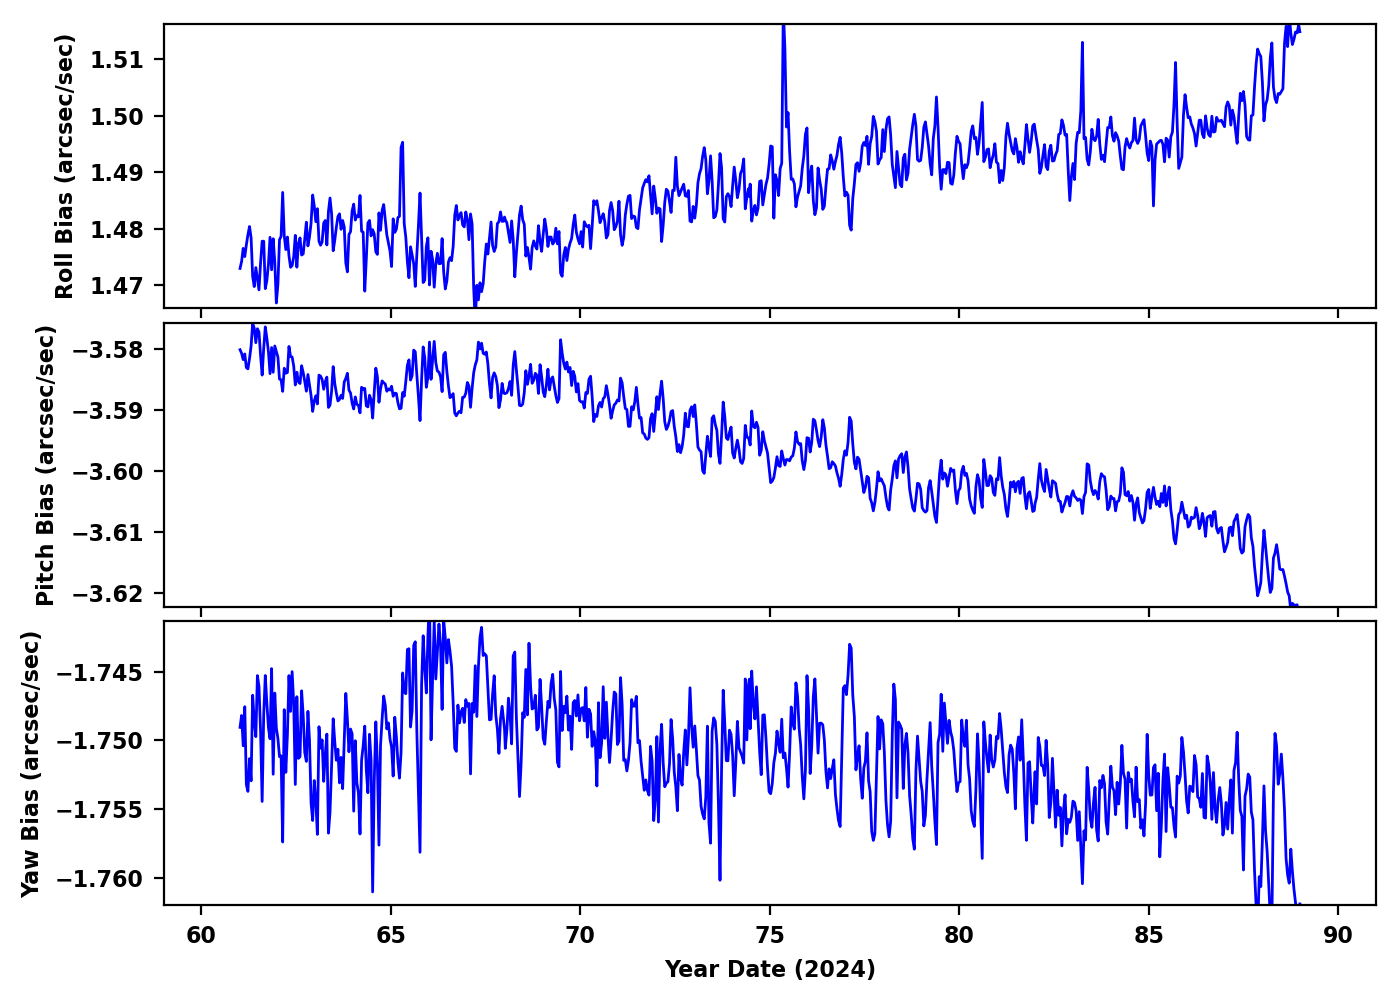
Gyro Bias Drift
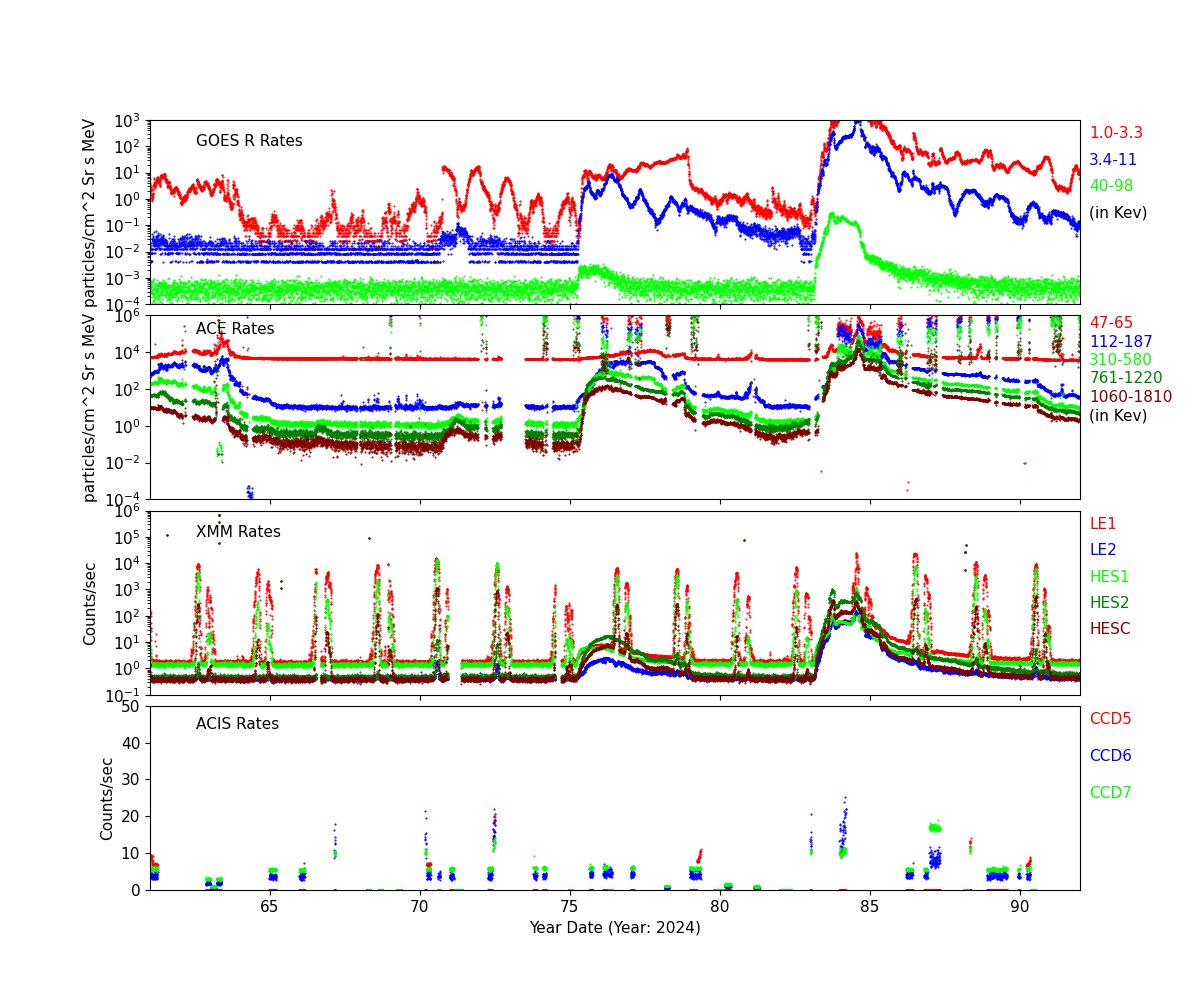
Radiation History
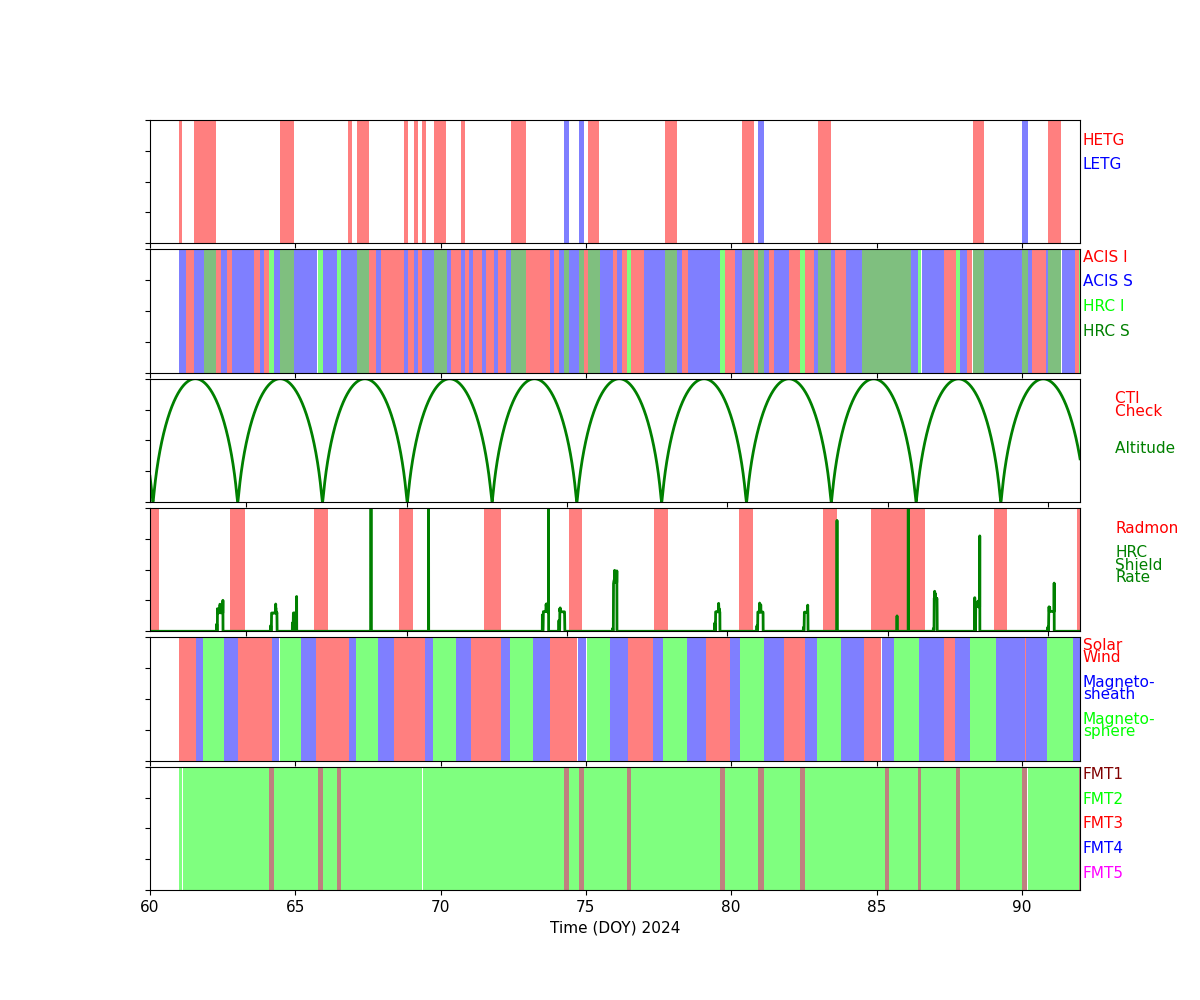
Radiation Count Rates of Mar 2024
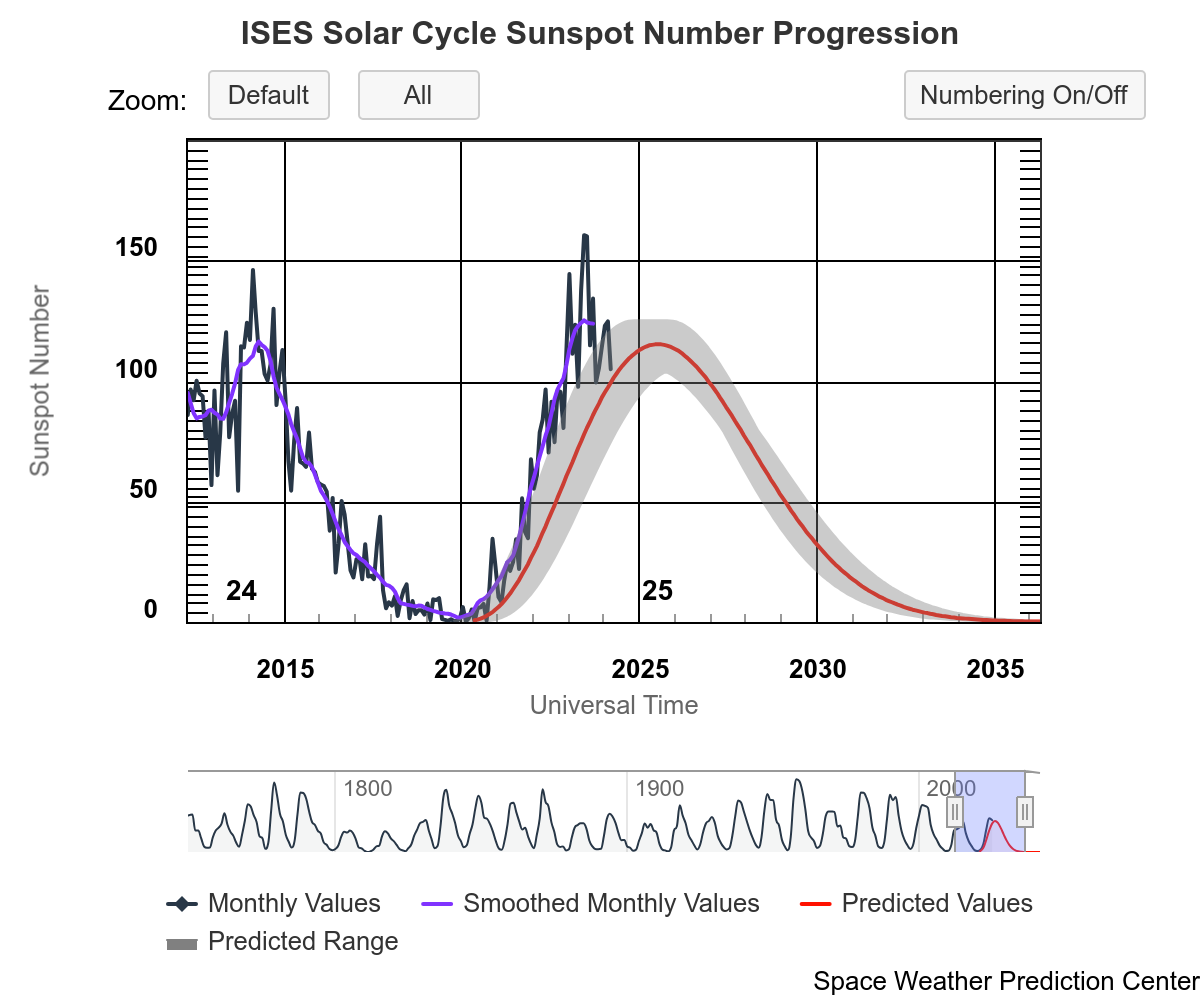
Sun Spot History (See:NOAA Page)
-->
Trending
Critical Trends
| ACIS Temperatures - Daily Maximums | |||||||
|---|---|---|---|---|---|---|---|
| MSID | MEAN | RMS | DELTA/YR | DELTA/YR/YR | UNITS | DESCRIPTION | |
| 1pdeaat | 0.001 | 0.002 | (2.99+/-0.04)e2 | 1.24 +/- 1.33 | K | PSMC DEA PS A TEMP | |
| HRMA Computed Averages - Daily Maximums | |||||||
|---|---|---|---|---|---|---|---|
| MSID | MEAN | RMS | DELTA/YR | DELTA/YR/YR | UNITS | DESCRIPTION | |
| obaavg | -0.014 | 0.001 | (2.98+/-0.02)e2 | -1.27 +/- 0.65 | TEMP | OBA/TFTE | |
| EPHIN Temperatures - Daily Maximums | |||||||
|---|---|---|---|---|---|---|---|
| MSID | MEAN | RMS | DELTA/YR | DELTA/YR/YR | UNITS | DESCRIPTION | |
| teio | 0.026 | 0.009 | (3.30+/-0.22)e2 | 2.97 +/- 3.64 | K | EPHIN ELECTRONICS HOUSING TEMP | |
| tephin | 0.008 | 0.003 | (3.39+/-0.08)e2 | 2.15 +/- 2.13 | K | EPHIN SENSOR HOUSING TEMP | |
| S/C Main Temperatures - Daily Maximums | |||||||
|---|---|---|---|---|---|---|---|
| MSID | MEAN | RMS | DELTA/YR | DELTA/YR/YR | UNITS | DESCRIPTION | |
| tcylfmzm | 0.020 | 0.004 | (3.13+/-0.10)e2 | 1.24 +/- 1.91 | K | CNT CYL TEMP:-Z SIDE UNDER LAE-1 | |
| tcylfmzp | 0.020 | 0.004 | (3.16+/-0.09)e2 | 1.12 +/- 1.75 | K | CNT CYL TEMP:-Z SIDE UNDER LAE-2 | |
| S/C Ancillary Temperatures - Daily Maximums | |||||||
|---|---|---|---|---|---|---|---|
| MSID | MEAN | RMS | DELTA/YR | DELTA/YR/YR | UNITS | DESCRIPTION | |
| tfssbkt1 | 0.015 | 0.012 | (3.50+/-0.29)e2 | 3.75 +/- 4.12 | K | FSS BRAC | |
| tfssbkt2 | 0.017 | 0.013 | (3.45+/-0.29)e2 | 3.80 +/- 4.17 | K | FSS BRAC | |
| tsctsf1 | 0.004 | 0.002 | (3.24+/-0.05)e2 | 0.53 +/- 1.31 | K | SC-TS FITTING -1 TEMP | |
| tsctsf6 | 0.003 | 0.002 | (3.24+/-0.05)e2 | 0.36 +/- 1.36 | K | SC-TS FITTING -6 TEMP | |
| MUPS - Daily Maximums | |||||||
|---|---|---|---|---|---|---|---|
| MSID | MEAN | RMS | DELTA/YR | DELTA/YR/YR | UNITS | DESCRIPTION | |
| pm1thv1t | 0.016 | 0.007 | (3.52+/-0.16)e2 | -1.18 +/- 2.51 | K | MUPS 1 THRUSTER VALVE 01 TEMP | |
| pm2thv1t | 0.063 | 0.022 | (3.18+/-0.51)e2 | 0.41 +/- 7.55 | K | MUPS 2 THRUSTER VALVE 01 TEMP | |
| pm1thv2t | 0.015 | 0.007 | (3.54+/-0.16)e2 | -0.79 +/- 2.65 | K | MUPS 1 THRUSTER VALVE 02 TEMP | |
| pm2thv2t | 0.059 | 0.023 | (3.16+/-0.55)e2 | 1.27 +/- 8.00 | K | MUPS 2 THRUSTER VALVE 02 TEMP | |
| pline02t | 0.023 | 0.005 | (3.36+/-0.12)e2 | 0.78 +/- 2.28 | K | PROP LINE TEMP 02 | |
| pline03t | 0.025 | 0.006 | (3.29+/-0.14)e2 | 0.57 +/- 2.15 | K | PROP LINE TEMP 03 | |
| pline04t | 0.023 | 0.005 | (3.17+/-0.11)e2 | 2.82 +/- 2.29 | K | PROP LINE TEMP 04 | |
Quarterly Trends
- PCAD FTS Temperature and Gradient
| Previous Quarter | |||||||
| MSID | MEAN | RMS | DELTA/YR | DELTA/YR/YR | UNITS | DESCRIPTION | |
| ohrthr27 | 4.531e-04 | 6.225e-05 | (2.97+/-0.00)e2 | -0.00 +/- 0.02 | K | RT 20 : PERISCOPE | |
|---|---|---|---|---|---|---|---|
| ohrthr42 | 0.003 | 3.019e-04 | (2.97+/-0.01)e2 | 0.51 +/- 0.12 | K | RT 133: PERISCOPE | |
| ohrthr43 | 0.003 | 3.296e-04 | (2.97+/-0.01)e2 | 0.43 +/- 0.16 | K | RT 134: PERISCOPE | |
| oobagrd3 | -2.965e-04 | 5.231e-05 | -0.33 +/- 0.12 | 0.02 +/- 0.04 | K | RT 505 TO RT 504: PERISCOPE GRADIENT MONITOR | |
| oobagrd6 | 4.743e-05 | 5.770e-06 | 0.13 +/- 0.01 | 0.01 +/- 0.00 | K | RT 507 TO RT 506: PERISCOPE GRADIENT MONITOR | |
- SIM Temperature
| Previous Quarter | |||||||
| MSID | MEAN | RMS | DELTA/YR | DELTA/YR/YR | UNITS | DESCRIPTION | |
| 3btu_bpt | -0.010 | 0.002 | (2.66+/-0.04)e2 | 0.02 +/- 1.27 | K | BTU BASEPLATE (+X)), ABORT HTR TSC2 | |
|---|---|---|---|---|---|---|---|
| 3tsmxcet | -0.046 | 0.018 | (2.41+/-0.41)e2 | 0.66 +/- 5.09 | K | -X TURTLE SHELL NR HRC CEA | |
| 3tsmxspt | -0.332 | 0.081 | (4.39+/-1.91)e2 | 20.84 +/- 25.54 | K | -X TURTLE SHELL NR ACIS SS | |
- SIIM Electronics
| Previous Quarter | |||||||
| MSID | MEAN | RMS | DELTA/YR | DELTA/YR/YR | UNITS | DESCRIPTION | |
| agrndadc | -3.242e-06 | 5.164e-07 | -(3.83+/-0.93)e-4 | (3.81+/-1.50)e-4 | V | Analog fround A/D convert reading | |
|---|---|---|---|---|---|---|---|
| fatabadc | -2.463e-05 | 2.878e-05 | 4.99 +/- 0.08 | 0.01 +/- 0.00 | V | FA Tab Position Sensor A/D Converter | |
| n15vadc | 4.888e-07 | 1.280e-07 | -15.02 +/- 0.00 | -(2.92+/-7.56)e-5 | V | -15V Power Supply A/D Converter Reading | |
| p15vadc | -3.171e-07 | 1.174e-07 | 14.96 +/- 0.00 | -(4.74+/-10.21)e-5 | V | +15V Power Supply A/D Converter Reading | |
| p5vadc | 3.783e-06 | 7.379e-07 | 4.94 +/- 0.00 | (7.42+/-5.60)e-4 | V | +5V Power Supply A/D Converter Reading | |
| tsctabadc | -1.713e-04 | 0.001 | 4.97 +/- 0.17 | 0.14 +/- 0.17 | V | TSC Tab Position Sensor A/D converter | |
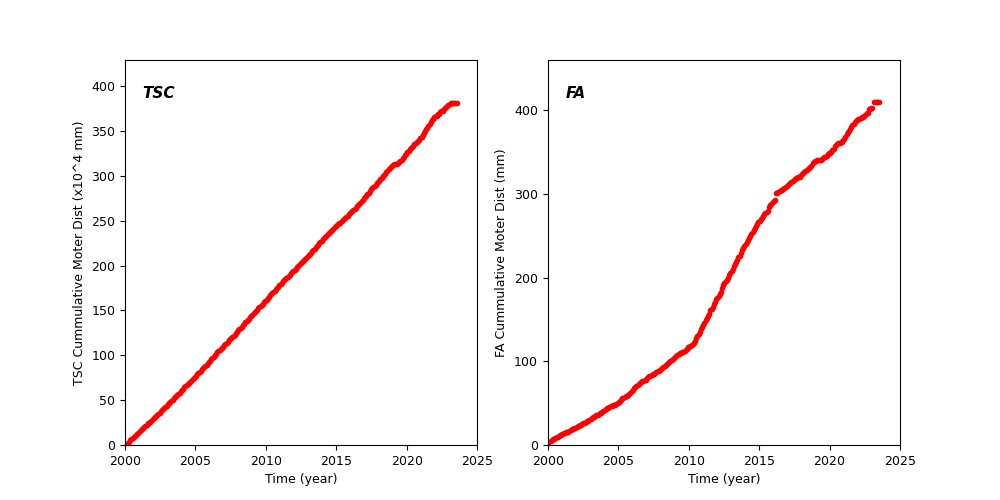
Spacecraft Motions
TSC and FA Cummulative Moter Distance
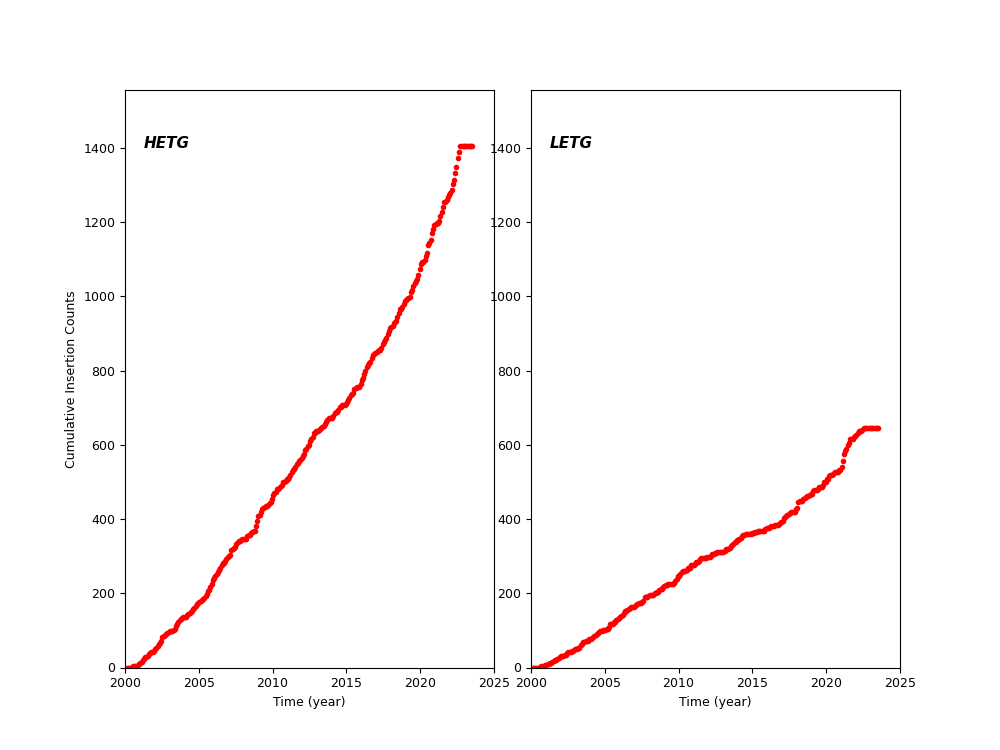
HETG and LETG Cummulative Insertion Counts
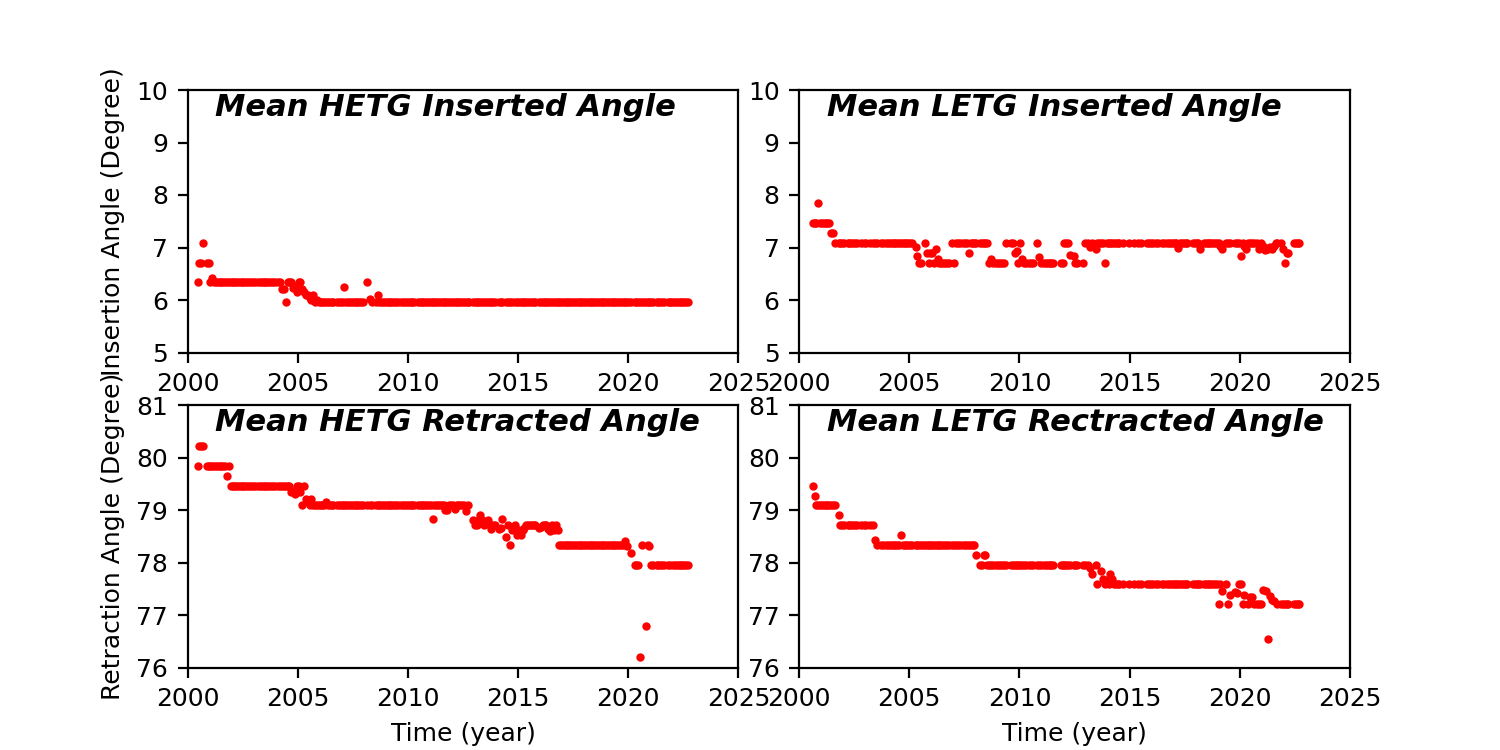
HETG/LETG Insertion/Retraction Angle
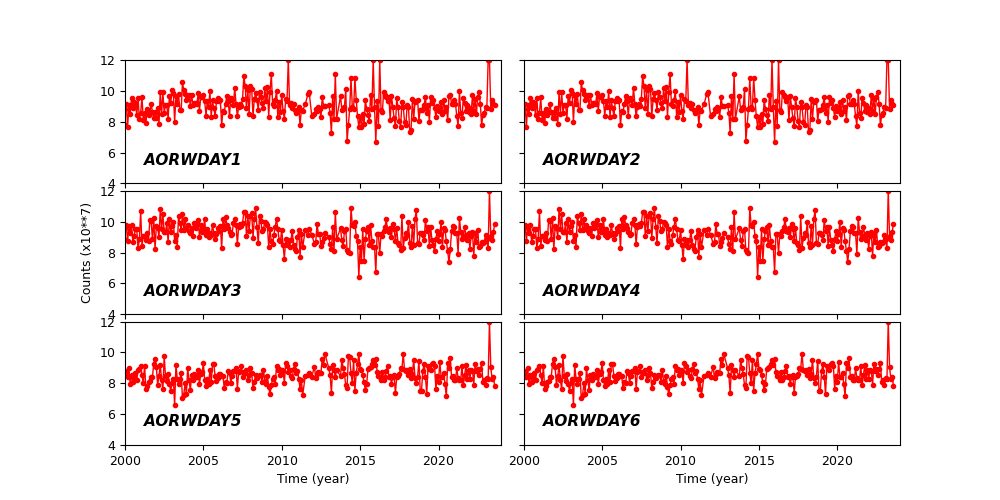
Reaction Wheel Rotations